


Register for a Free Live Training
Hot Stocks Outlook uses VantagePoint’s market forecasts that are up to 87.4% accurate, demonstrating how traders can improve their timing and direction. In this week’s video, VantagePoint Software reviews forecasts for Caterpillar ($CAT), Lockheed Martin ($LMT), Reddit ($RDDT), Lucid Group($LCID), Seagate Technologies ($STX), KLA-Tencor ($KLAC)
VantagePoint A.I. Hot Stocks Outlook for October 3, 2025
Lucid Group($LCID)
Hello again, traders, and welcome back to the hot stocks outlook for October 3rd, 2025. Hope you all have had a excellent week out there in the financial markets. And, as always, we’re here to take a look at the most recent Vantage Point AI predictive forecast. So, if you haven’t already, be sure to go ahead and click the link down in the description below and get signed up for a live demonstration so you can learn all the specifics about how these predictive indicators and technologies are helping traders navigate the financial markets.
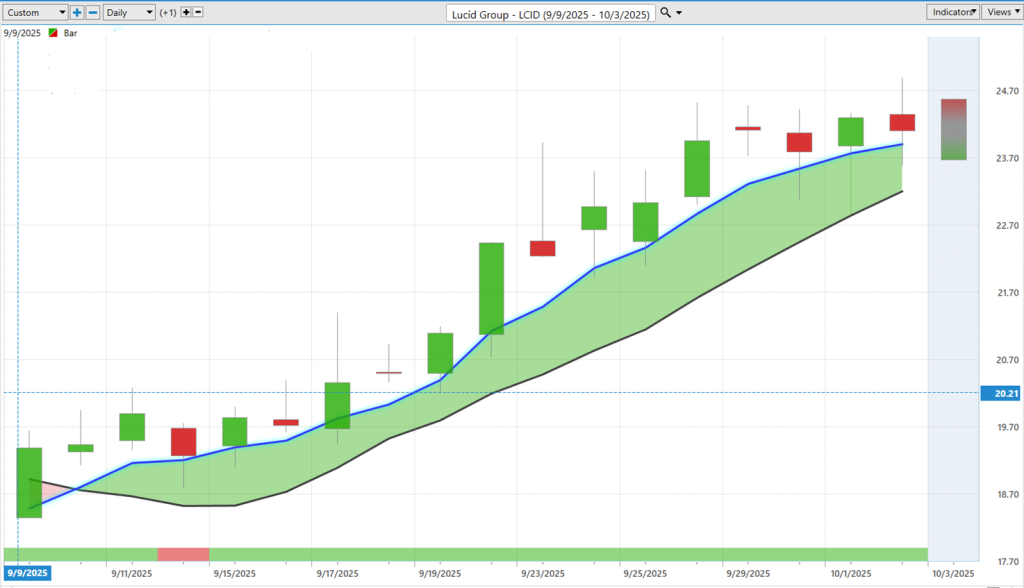
And so, uh, we’ll go ahead and start out with Lucid Group, which this is actually a stock we looked at over, uh, a couple weeks ago. Uh, and it’s a great example how we can really update things and understand how these forecasts really update every single day for traders, so they can be prepared for what’s likely to occur next. And so, uh, what we have here with Lucid Group is daily bars and candles, right? So, each one of these candlesticks here is going to represent a full and complete trading day. And it’s right up against that price data that you’ll notice there’s a black line and also a blue line value.
And so what that black line is is actually a simple moving average, or what we refer to as the actual simple moving average. Uh, and this is a very common technical analysis tool. And what it does is it just looks back at the previous 10 close prices, adds those all together, and then divides by that number. And that helps to smooth out the existing price action. But it really just lets you know what’s already occurred in the market, right? It just kind of smooths out, uh, price bars and gives you a sense of where market price has been. But traders need to be ahead of that next move in the market, right, and understand where prices are headed next.
And so what Vantage Point traders are able to do is compare that value to this proprietary predicted moving average. And for this number, which we can think of as a a price that’s getting calculated and plotted on the chart every evening. Well, for that number to get calculated, this is where the technology of artificial neural networks and Vantage Point AI really do this approach as far as utilizing the technology and performing what we would call intermarket analysis to get an edge on where those future prices are headed.
And so what that means is that rather than just looking at previous close prices like traditional technical analysis would, Vantage Point’s technology is looking at other markets that are known to drive and influence future prices of the target market you might be trading. So this can be things like individual stocks throughout the, uh, broader stock market. Uh, this can be things like ETFs, which are going to, you know, group a lot of of a sector together. Uh, a lot of these stocks move in tandem, but it really takes this global approach, and so, where applicable, it may look at global currencies; it may look at global interest rates; and even, uh, commodities where applicable. We’ve seen gold make a really strong rally, and that’s influenced—obviously—a lot of gold mining stocks have performed extremely well. Uh, and so what it does is it takes all of this information and produces these highly accurate predictions.
And so we can really train these neural networks to solve for different problems, and so when we’re trying to get a sense on where are these average prices likely to go next, we want these tools in, uh, influenced by those predictive clues. And so, whenever we see that blue line cross above the black line, well, we understand prices should start to go higher. And you see that since that last signal of those signals crossing, we got about a 25% rally in the past 17 trading days. And so, we looked at this again a couple of weeks ago. Uh, and this is really where the updated predicted highs and lows, which we look at each week, and also the Vantage Point neural index—which is this bar at the bottom of the chart—really help traders navigate and manage, uh, existing positions.
So, at the very bottom of the chart you’ll first notice this green line and see it can sometimes go down to red. So this is also utilizing that technology of artificial neural networks, but it’s solving for a different problem, and that being just short-term strength over the next 48 hours, right? So, um, essentially, you know, looking ahead always two candlesticks, right? So very short term. And you’ll notice that once we get this crossover, a lot of separation between that predicted moving average and the actual moving average, you get the neural index goes bearish here, and you’ll notice actually the couple days are pretty subdued. The very next day it flips up to a green and really remains there, letting you know that there’s persistent momentum. So, every time you come in and look at the forecast, it’s pretty much telling you, look, expect higher prices over the next 48 hours in Lucid. Uh, and, of course, lastly, we can look at intraday predictions as well.
So, Vantage Point produces a predicted high and predicted low before every single trading day. So, at 6 p.m. the evening before, you’re getting these levels. So, this would be for Friday’s trading here. And so, what’s going to occur is we’re going to see what the actual market data looks like, and we can see how accurate all of those predictions have been. And so, each week, what we do is say, “Okay, well, let’s look at all of the previous predictions against what ended up actually occurring.” And, again, you see how this works. You get days like this early on in a trend where we never hit this predicted low. All the price action was bullish. And sure enough, market wants to move right down to that level. Uh, but typically on the exact day is where you’re going to see the market move down towards the predicted low and continue moving higher.
So, just in the past couple of weeks since we brought this forecast through one, two, three, about four situations where we moved down to that predicted low and immediately started trading higher towards the next day’s predicted high. So really great opportunity for a swing trade, but also just shorter-term day trades, uh, and really fine-tuning that entry price and making sure you’re aware and really ahead of the market action.
Caterpillar ($CAT)
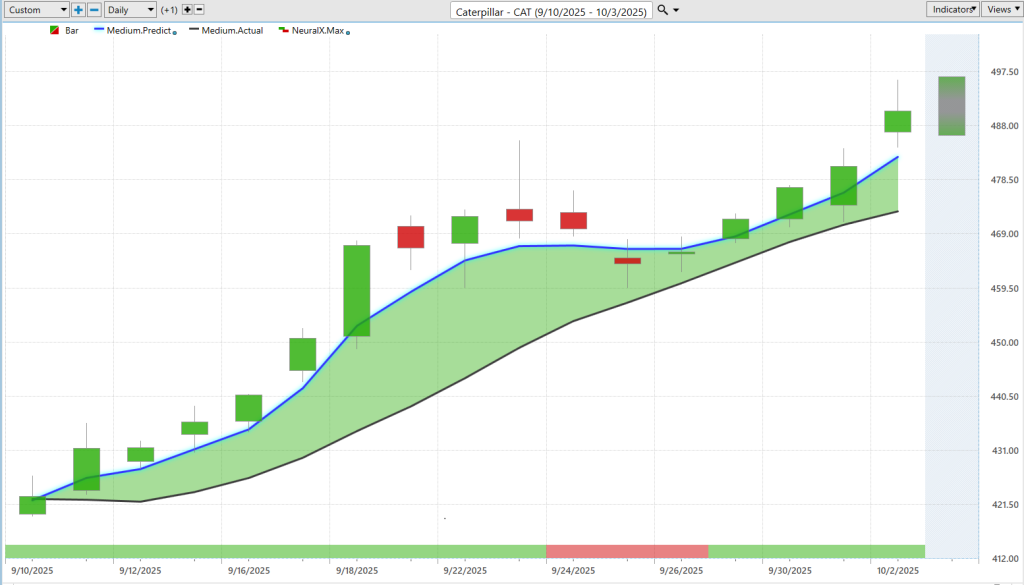
Uh, here’s Caterpillar, so a much larger stock here. Uh, but everything works the exact same way. So, if you’re trading a low price, you know, high volatility stock, really help you trade anything, whether it’s Caterpillar or Lucid; we’ve got Lockheed; we’ll look at Reddit here. Uh, but same situation where you see this blue line crossing above the black line, signaling the overall trend should start moving higher. So this might be a place that you want to look to exploit the bullish side of the market. And you’ll notice here the one time this neural index goes bearish, we get a couple of days of weakness, but as that momentum kicks back into the market, you see that neural index very early in an uptrend, and we really see prices expand to the bullish side.
Uh, we can fine-tune this, of course, and look down at these predicted lows. You see right as this trend gets started, a nice move towards the predicted low; there’s a lot of volatility in the market moving higher here. But the software really adapts very quickly. And so, you see that even after this big move, it’s saying, “Okay, well, expect the market to settle out. Look down towards these predicted lows.” Nearly see how this works daytoday, even this week, moving down towards the predicted low, immediately trading higher off the open from what would have been Wednesday there. So, uh, so far, even in shares of Caterpillar, which is typically going to be a slower moving stock, you’re still up about 14% in just the past 15 trading days. So, really ex—uh, exciting opportunity there.
Lockheed Martin ($LMT)
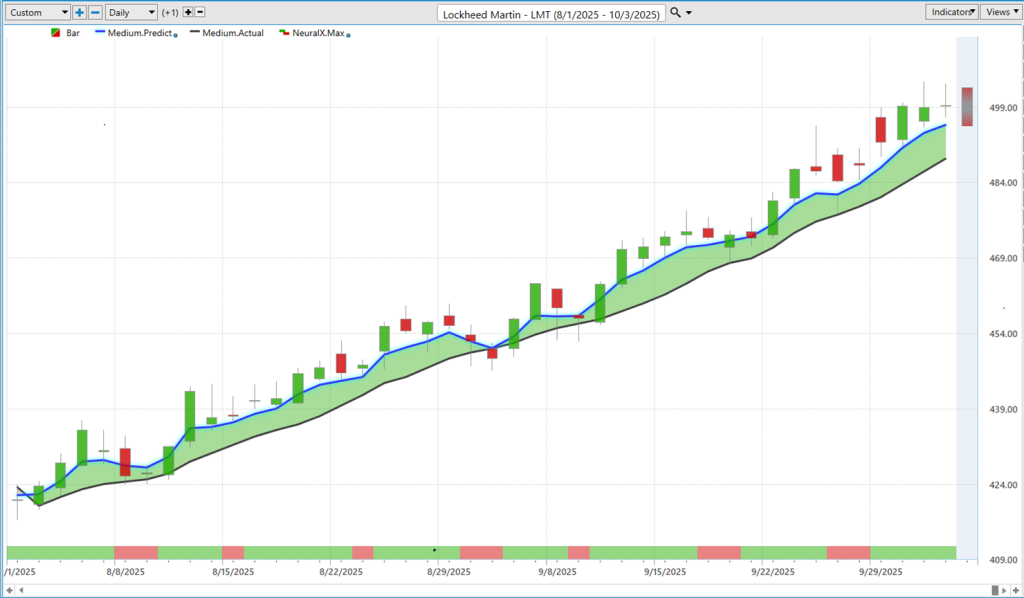
Here’s Lockheed Martin. So, I believe we looked at this probably over a month ago, and the trend has continued. So, as long as this blue line remains above the black line, you can hold on to those position or swing trades. Uh, and, you know, once we get this crossover to the bearish side, maybe you want to go ahead and take some profit or cut the position. Uh, here you see Lockheed—blue line over the black line. Uh, you get a few instances here where this neural index goes bearish, but for the most part, you’re getting this sort of sustained, uh, uh, price momentum and a lot of separation again between that predicted moving average and the actual moving average.
That’s really the point, is these, uh, you know, intermarket analysis and these predictive neural networks are really going to skew these values to create a lot of separation and provide for a very clear forecast on the overall trend. Uh, so as we look at the predicted highs and lows, uh, within this trend, well, we see again how this works. If you’re ready and waiting down towards these predicted lows, we see the market pretty much within about 48 hours maximum, uh, is moving into a profitable direction and towards those predicted high, uh, forecasts here. So, a lot of nice opportunities on the bullish side here in Lockheed. Uh, and sometimes this information can really let you know, hey, there’s something going on in defense stocks. Um, you know, whether you want to look here or, you know, again, some of those other defense companies and contractors, uh, you see a lot of bullishness here. Shares up about 17% in just the past 42 trading days.
Reddit ($RDDT)
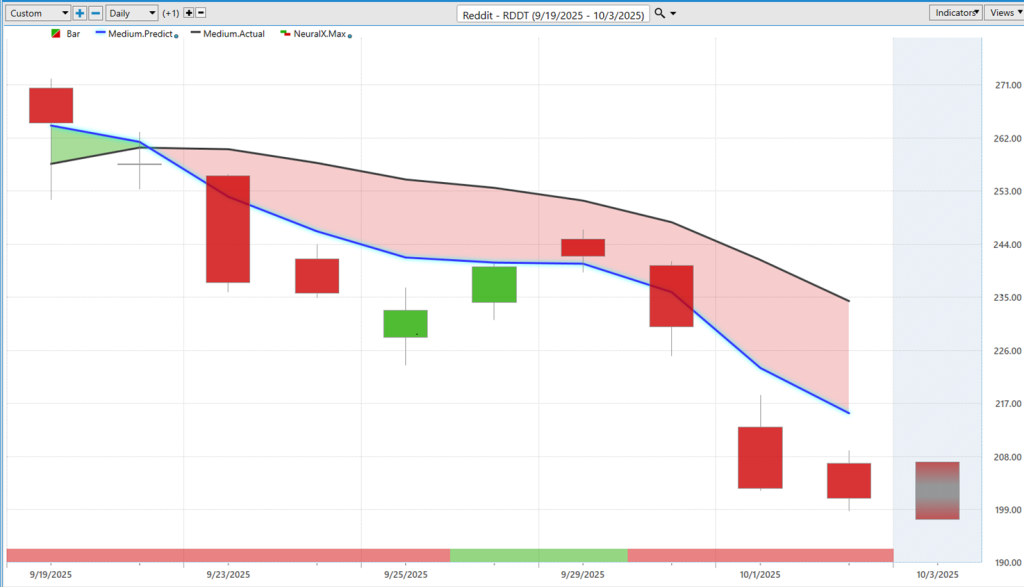
Now, uh, markets don’t always go up, though. Uh, you know, we looked at PY Homes and some of the home builders, which, uh, we actually looked at those stocks probably two or three months ago, went into some really nice uptrends, but it started to really settle down, and we’ve seen some of the predicted moving averages move to the bearish side. And so, you can really pivot your attention to the areas where, you know, you’re seeing that strength, like Lucid and Caterpillar here. Uh, but here in Reddit, we see a very clear blue line crossing below the black line. Uh, you get your neural index in the middle of this move, just bouncing up to a one, again letting you know, hey, you know, 48 hours, you may see some strength. But look at the separation here between that predicted moving average and the actual moving average—the slope still going lower and lower each day.
Uh, and as we look at the predicted highs and lows, this is really fine-tuning everything. And you see it’s really indicating that, look, intraday, you want to be shorting up at these predicted highs and expect weakness from that point. And so, here in Reddit, uh, you know, there’ve been a lot of news driving the stock lower, but multiple entries here really before, uh, that volatility kicks in and prices really started to jump off a bit of a cliff here. So, uh, not a great sign there for Reddit, but, of course, you can just pivot that attention to areas where the predicted, uh, forecasts are extremely bullish
Seagate Technologies ($STX)
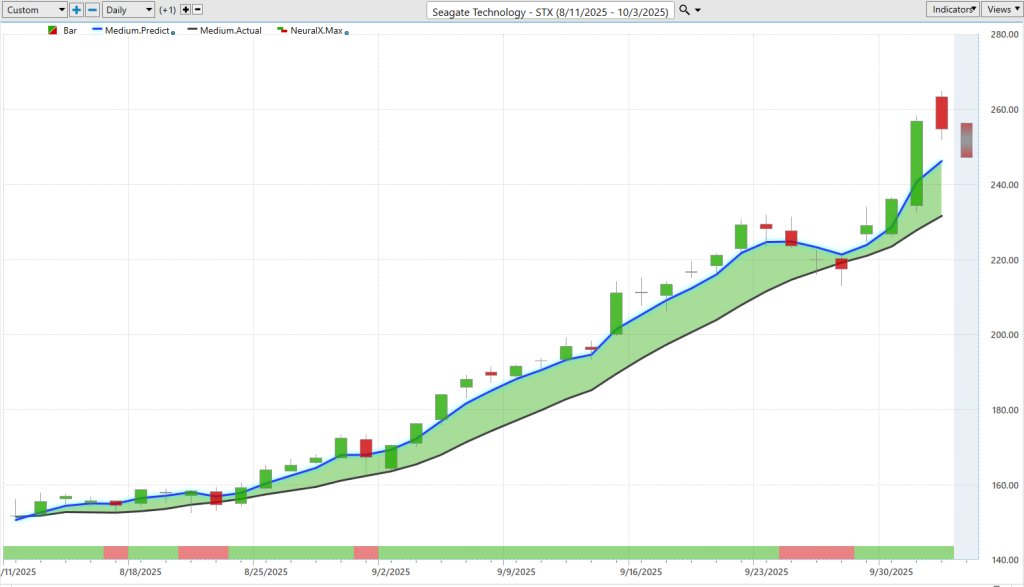
Um, here’s Seagate, Seagate Technologies. I think we looked at Western Digital a couple of weeks ago. And so, these markets will trade very similarly. Uh, but the same thing here: blue line crossing above the black line. Couple of periods where we’ll get that little consolidation, uh, situation. You see prices going a little bit lower over the subsequent 48 hours, but the overall trend still forecasted to the upside—that blue line still remaining above, uh, the actual moving average.
And, of course, again, we can fine-tune this and say, “Okay, well, where are the actual individual price levels that are being forecast as good opportunities to be a buyer in an uptrend?” Uh, and you really see how this works even on this consolidation. Remember, these levels are produced ahead of time, so it’s really telling you, look, before these trading days, expect the range to move lower; again, expect the range to go lower. Once that neural index gets bullish, that’s where we see moving down to these predicted lows, uh, you know, subsequent a lot of momentum on the bullish side here and the uptrend resume.
So again, just really matching the time frame of the indicators with your trading strategy and how you like to navigate the markets really makes things a lot easier, right? We just combine these very straightforward forecast. Here, we see about a 63% rally in just 36 trading days. And so, there’s been just tremendous opportunities on the bullish side, especially throughout the tech space.
KLA-Tencor ($KLAC)
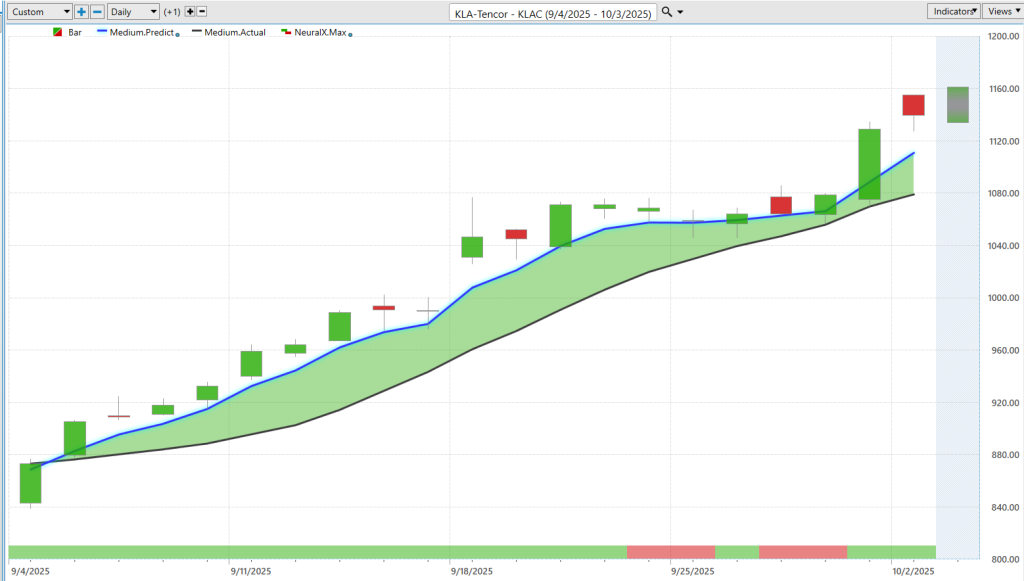
Uh, here’s KLA–Tencor. Uh, and again, very straightforward forecast: blue line crossing above the black line. Lot of strength during this period, and then you get the neural index warning you that, hey, look for markets to settle off a little bit, right, to settle down. We’re not, you know, in that high momentum scenario. Uh, if you’re a position or swing trader, you may want to look for lower prices or just, uh, uh, you know, wait until we see that momentum kick back into the market. Uh, but very clearly here you see it really warns of this sideways price action, but that blue line still above the black line.
And so, very clearly, if you want to do anything, it’s buy at predicted lows, target predicted highs. Uh, and we really see how this works just dayto day, week to week, very consistent in the output, uh, and how this works from market to market. So let’s see—about seven, eight, nine—uh, you know, eight opportunities here on the bullish side, and, uh, market really expanding as far as the overall range, reaching to, uh, new price highs. So, uh, again, the overall move here—very strong move at a 28% in the past 20 trading days.
So, uh, really exciting opportunities. Uh, but it really just comes down to understanding, look, you’ve got this very consistent and accurate forecasting software and technology. Uh, and so, again, regardless of your trading style—if you’re a day trader, swing trader—really incorporate all of these indicators that, again, they’re tuned to solve these different problems in the market, whether it be shorter term, longer term, intraday price levels, uh, to help you succeed in your trading.
So, once again, this has been the Hot Stocks Outlook for October 3rd, 2025. Thank you all for watching. Best of luck out there, and bye for now.

