


Hot Stocks Outlook for the Week of
October 9th, 2020
The Hot Stocks Outlook uses VantagePoint’s market forecasts that are up to 87.4% accurate, demonstrating how traders can improve their timing and direction. In this week’s video, VantagePoint Software reviews forecasts for Allison Transmission Holdings, Square, GoPro, Shopify, Disney
Register for a Free Live Training
This Week’s Hot Stocks Outlook
Hello, traders and welcome back to the hot stocks outlook for October 9th, 2020. Hope you’re all having an excellent week out in the financial markets and as always, plenty of opportunities to cover here. So we’re going to go ahead, start out with a really good example of how the software works here with Alison Transmission Holdings. We’ve got Square, GoPro, Shopify, and lastly, Walt Disney, which we looked at last week and we’ll go ahead and touch once more.
Allison Transmission Holdings
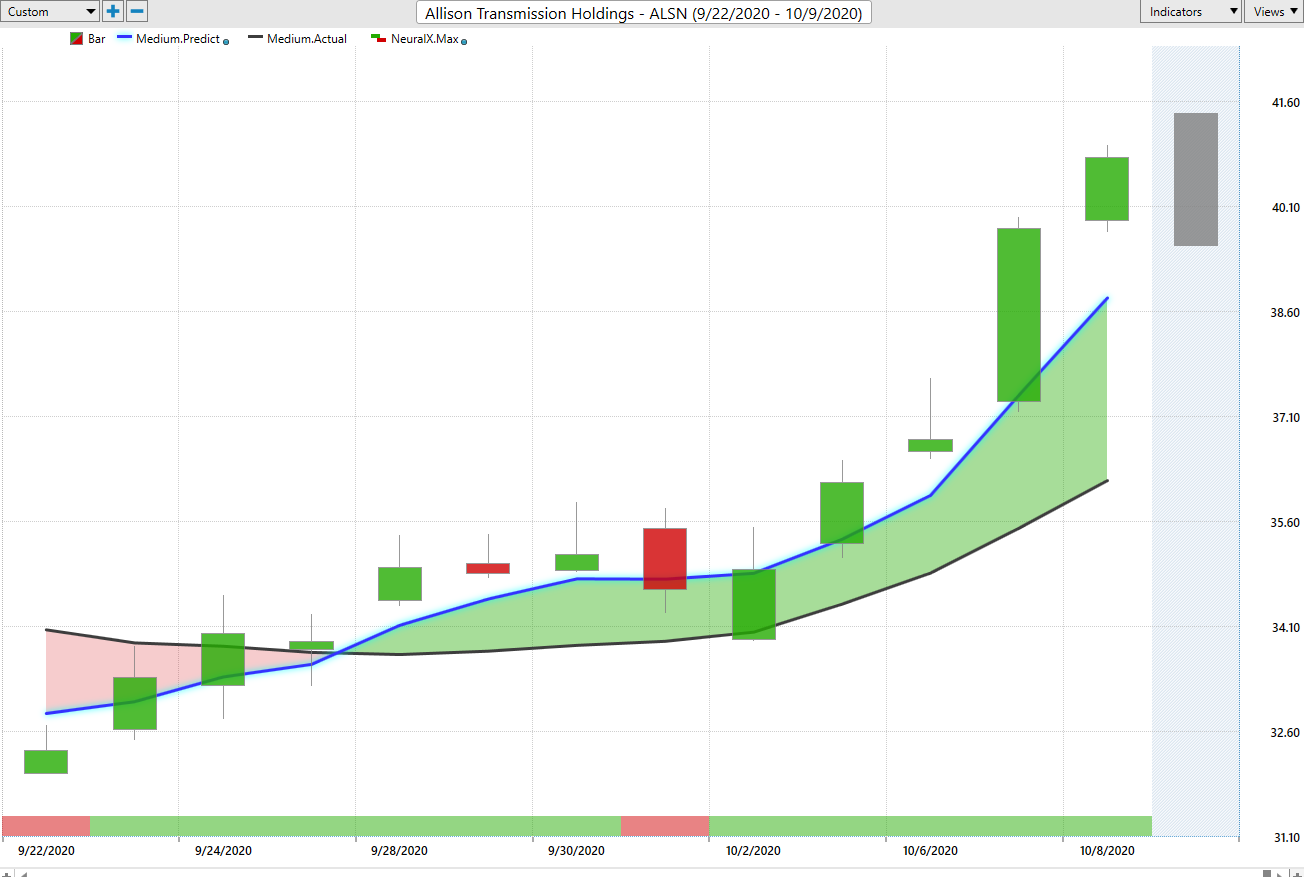
So looking at Alison Transmission Holding, a really good example of how these tools work and what we have here is daily price action. And all of the forecast here that you’re going to see, everything works off of end of day data to generate new forecast and predictions for price. And so what we have here is daily price action and right up against those daily candles, you see that there is a black line and also a blue line.
Now, the black line that you see there, that is a regular simple moving average. It’s a very common technical indicator, looks back over the previous price action, takes the last 10 close prices, adds them together, divide by 10, and you get a good rolling measure of where market prices have been. But of course, as a trader, we need to understand where are prices going to start moving forward so we can be ahead of any sort of move in the marketplace.
And so, what we’re able to compare that black line or value to on the chart is this blue line. And for that value to be calculated and generated each and every trading day, vantage point is utilizing its technology of artificial neural networks and specifically performing what’s called intermarket analysis. So the technology is applied to finding intermarket relationships between the target market. So in this case, Alison Transmission Holding, and other markets that are known to drive and influence and affect future prices.
Now, that’s going to be things like individual stocks and similar sectors or competing companies, things like that. That can be ETF groups, that can be global currency markets, global futures and commodity markets. That’s going to be interest rates, global currencies. And so what it’s able to do is understand specifically which group markets are having a significant impact on future prices and it actually utilizes that information to generate future price prediction. So we can think of that as data to the right of the chart that hasn’t yet occurred. And then what that data is used for is actually to generate all of these indicators, which rather than lagging indicators that look at the past and get dragged around by price, these are forward-looking predictive indicators.
Now, as long as that blue line stays above the black line, the overall trends so average prices are expected to be higher than where they’ve been so the overall trend is up. Now, in addition to that indicator, if you look at the very bottom of your screen, you’ll see that there’s this bar that goes from green to red, green to red. And we also have at the very right, sort of a shadow bar that has a daily range.
Now, at the bottom of the chart here, this is what’s called a predicted neural index. And again, utilizing that inner market approach, generating future price predictions, but this is only geared look 48 hours ahead at a time and it’s forecasting short-term strength or weakness in the market. In many ways, really looking at the future higher highs or lower lows over the next 48 hours in the market. And all the way to the right, you actually have an intraday prediction of price, a predicted high and a predicted low. So what’s going to happen is the trading day is going to occur here and it’s going to fill in this bar and you’ll see actually how accurate those predictions are.
So if we go ahead and look at the entirety of our forecast here, we see we get this blue line or predicted moving average thing. The overall trend is up. We have strength of the short-term as well. And then we want to go in with the help of that predicted high and low and manage the opportunity as it moves forward through time. So in the case of Alison Transmission, we can see how accurate those levels are and you see that you have a couple of days the market doesn’t do much, responds to the predicted high and sells off, but down here, are really the levels where you want to take action and you see that once this neural index goes bearish on the day, you see you do get a gap down, lower prices, but the overall strength is still there and you want to be participating on the bullish side of a market like this in line with what these forecasts are telling you.
So really nice move here, mark it up about 16%, just in the last four trading days from that predicted low, but a good example of an area that’s performing really well with the recent strength that came into the market. So when we looked at last week, we had a lot of weakness over the previous subsequent weeks. And really, all of those markets went into uptrends, aside from Walt Disney here, which we’ll go ahead and look at in a moment.
Square
But another example here of how the software works moving forward in particular markets. So when we look at Square, you see here another good example of a very strong crossover. That blue line is very much above the black line, but you have a lot of chop and a lot of volatility here in this area, but you’re actually going to notice that this is one of the things that I really appreciate about the software is on days where things sort of gap around, or sort of go outside the predicted range that we might have, right? So here’s our predicted high and low range. We sort of come outside of that area. The software has a very strong ability to utilize those intermarket relationships, look at how things are shifted around, what happened, where are things moving, where are other markets closing and then reevaluate those forward-looking predictions, whether it’s the neural index over 48 hours, those predicted highs and lows that get readjusted, as well as the overall predicted moving average direction and whether that’s going to hold above the actual moving average and stay in an uptrend.
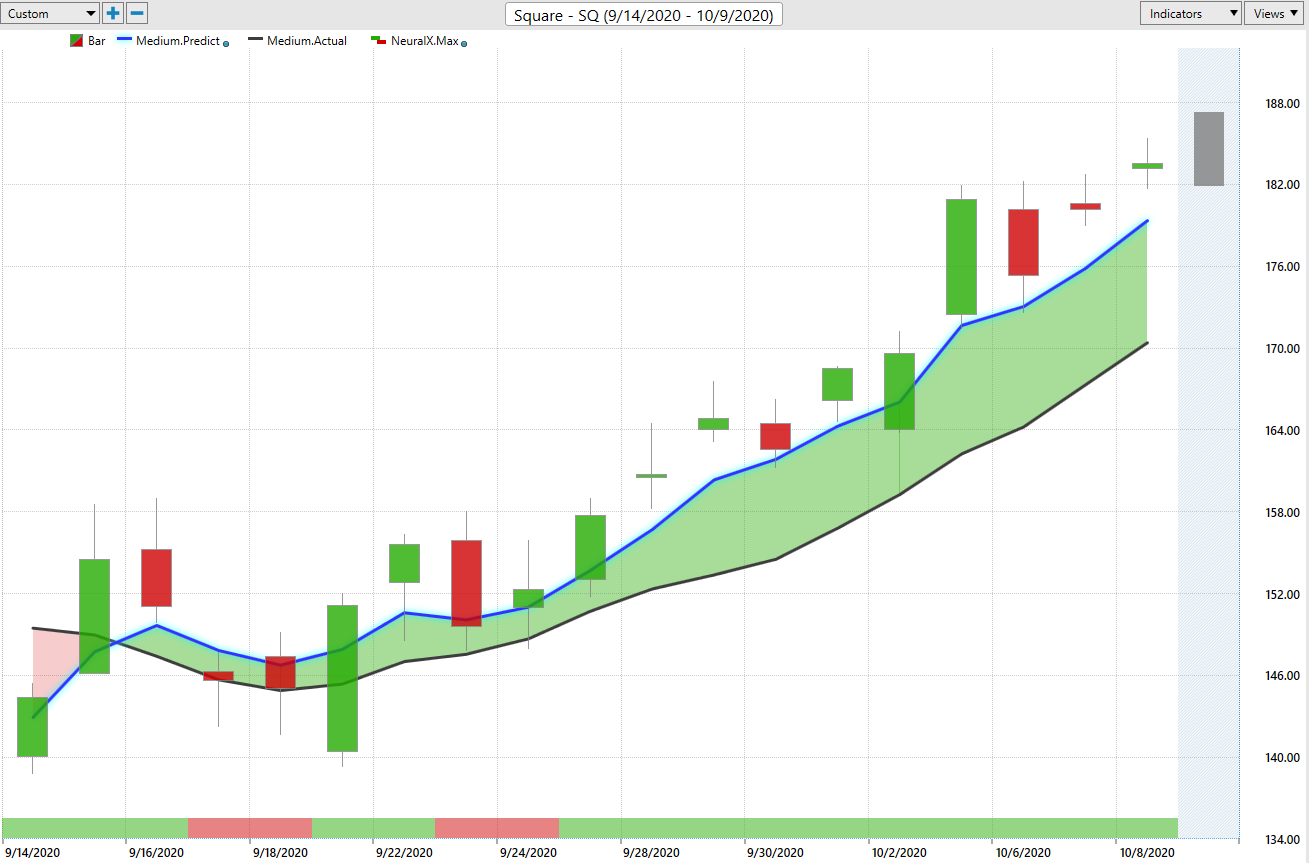
You see here that that blue line is still very much above the black line. You get a couple of these areas where the neural index goes bearish and subsequent weakness over the next 48 hour period, but not an indication of sell. They’re saying, look, there’s some short-term weakness, actually an opportunity to go ahead and be a buyer in the market, but down at advantageous levels here.
And you see again, another one of these situations where you gap down, but it’s almost all buying, as the bullishness comes into the market here and you see several of these entries and other gap down, a little bit of a volatility here, you come out of the area, but move back lower and then continue on in that downtrend or uptrend rather, but get good price levels, as far as where you’re coming in on a daily basis.
So really nice opportunity here in shares of Square. Again, a lot of the market recovering quite well. See shares up over 23%, just in the past 14 trading days. 500 shares there has you up about $17,000 from those lower lows that were set in early on in the trend.
GoPro
We have shares of GoPro, another market, again, doing extremely well recently, but you see here that this is going all the way back to really mid-September.
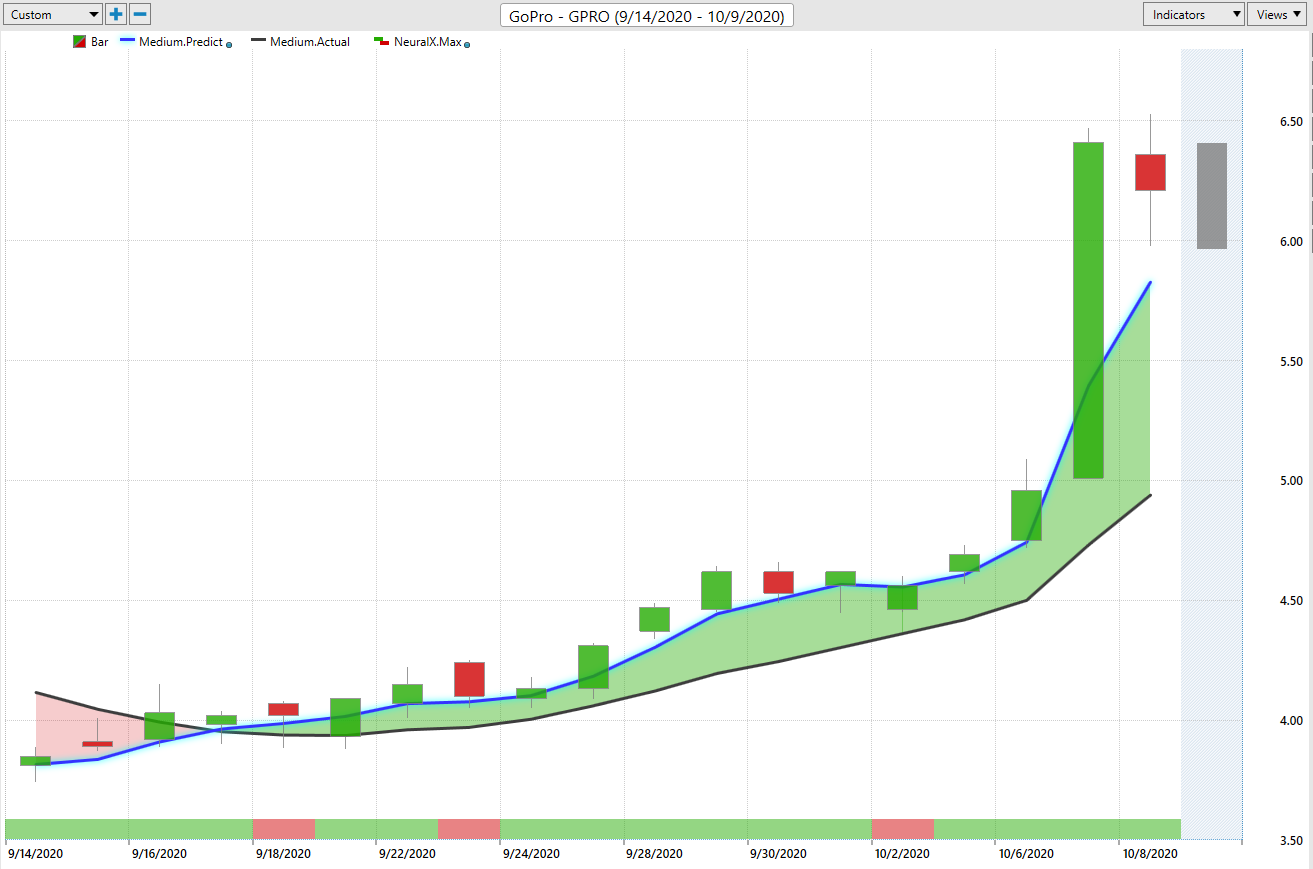
There’s that crossover to the upside. You get a couple of periods where this neural index goes bearish, but overall that blue line neural index, very bullish saying, look, you only want to be long here and take profits on those long positions. And of course, if you’re looking for an intraday level to get involved, well, there’s one, there’s one, there’s one, there’s one, there’s one, all which very good as far as the overall price action, getting it in a good intraday level, saying, okay, well, I know you may not want to chase it up here, wait to get better prices over these trading days and participate in and be involved in that bigger move as shares breakout.
So here, a pretty colossal move, as far as a percentage improvement here. Shares up over 61% in the past 14 trading days. Again, 500 shares is there, which is a tiny, tiny position size, has you up over a grand in a very short period of time there.
Shopify
Here, we have Shopify. And another example here again of these crossovers where what we can actually do is use Intel a scan feature, which actually allows traders to identify fresh crossovers or fresh signals from really any of the indicators. So you can organize things, whether you like to trade off of the neural index over that 48 hour window, whether you want to look towards predicted high and low ranges, moving a certain way. Just about anything you can sort through and identify new opportunities, but with the help of these predictive tools and predictive indicators, so that when you get on to something, you have the benefit of not only recognize that, Hey, there’s been a reversal and an opportunity, but day to day, getting that update of the forecast with the help of these tools, to help you manage the opportunity and really pull the most out of it.
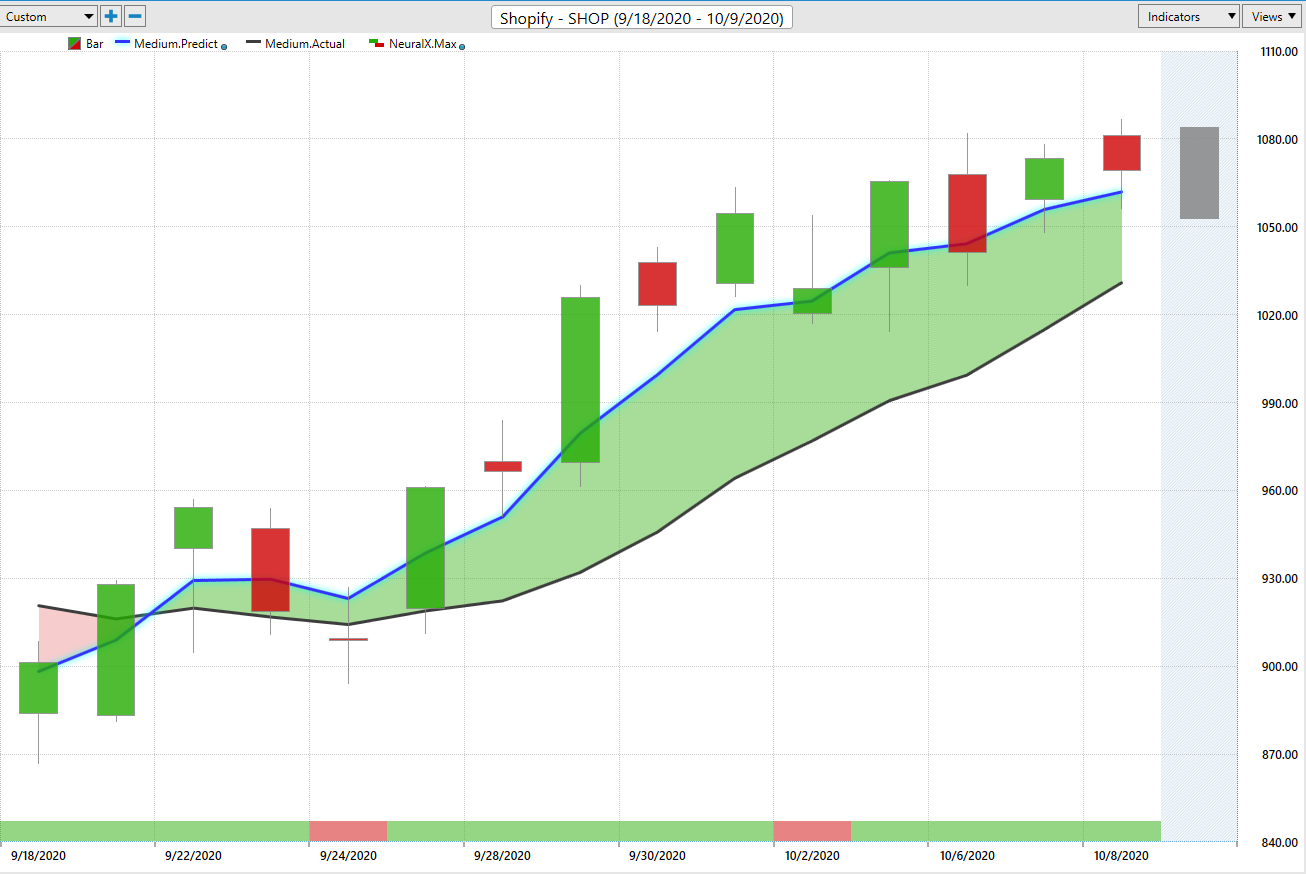
So again, we can see here that trading day like this, you have this trading day where you move a little bit lower, but look at the predicted high and low range, coming lower and letting you know, look, there may be some cheaper prices here. Same thing over here, you get this trading day here. Saying, look, trading range may move down over the next couple of days, but overall, for the timeframe of a 48 hour window or so to take a position, getting really nice entries and being able to participate. And of course, again, make the most of those uptrends. So if you can get into a trend early, but then manage the opportunity and take these bigger chunks out of it and improve or increase the size of your overall position, that’s going to make a big difference as far as your overall trading results.
So, it’s important to understand that, okay, well, there’s these nice moves where you’re getting a 16.5% move over the last 11 trading days, but you got to consider, okay, well, if you’re getting that 16% move, but able to add to that position as the trend continues, you can do well in excess of that 16% or 17% by building a larger position, but with those profits that you’ve accumulated by managing the opportunity effectively.
Disney
And lastly, here, I just wanted to bring in Walt Disney, which like I mentioned, over the past few weeks, there’s been weakness in the market. So there was a Thursday, like three weeks ago, four weeks ago now, where the market’s turned lower, a lot of things got weak and last week we looked specifically at Walt Disney, as well as a large number, three or four other stocks, that were also in down trends.
Every one of those stocks has moved into an uptrend. It says, cover those short positions, get long, but not Walt Disney here. And something’s going on here where you see we’ve gotten this crossover to the downside neural index bearish. But over this past week, it has just remained bearish. And you see that you’re not even close to getting this blue line crossing above the black line. Yet another strong down day there, in shares of a Disney and moving to some lower lows more recently.
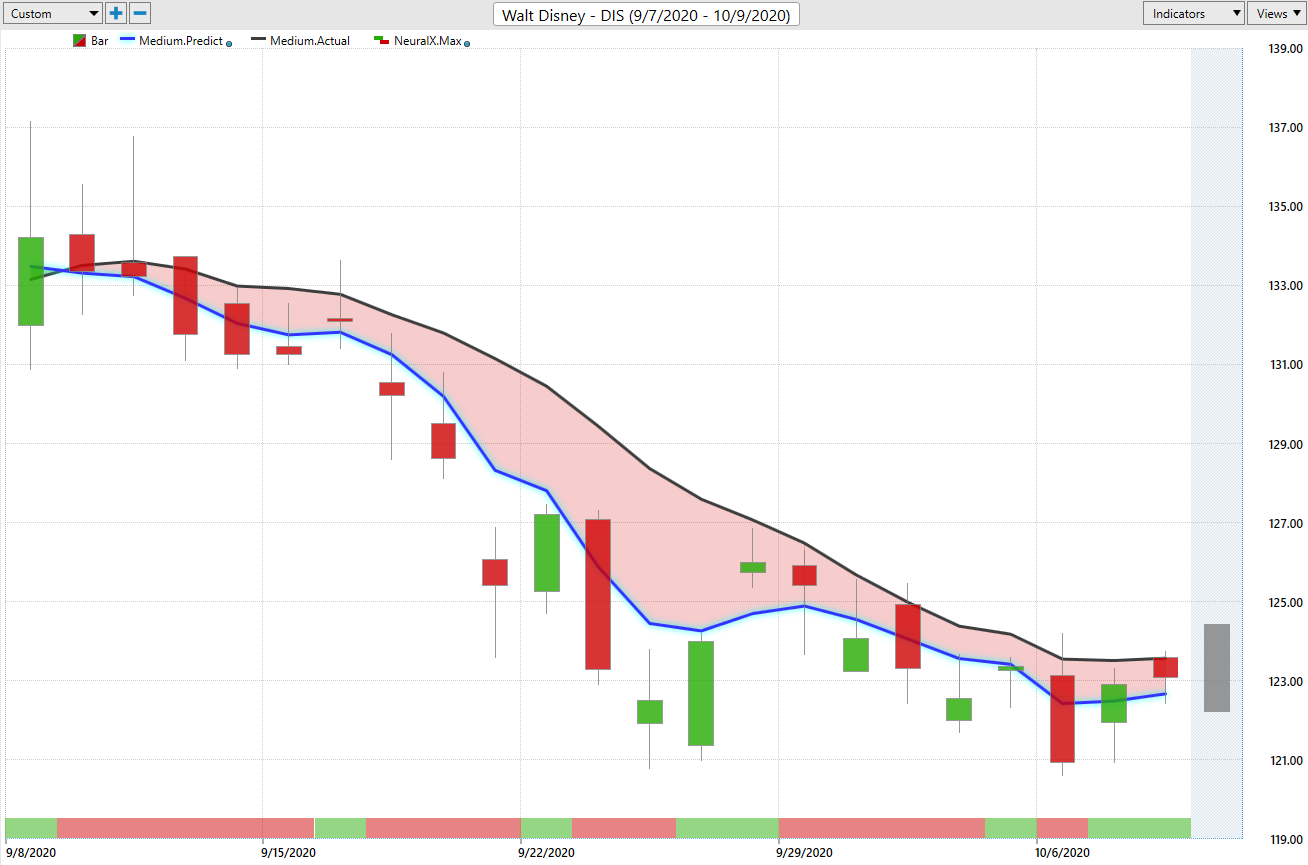
So over the course, it’s not a huge move, as far as a percentage basis. You’re off about 10% or so over the course of the entirety of this, see about 9%. But you want to understand, okay, well, where can I, if I want to actually short the market or create a hedge portfolio, well, where should I go in and actually set short positions and look to take some profit? Well, a better place would be up at these predicted highs. If the trend is still down, going to make more sense than continuing to try to short markets that the crossovers have moved to the upside and things are trending.
So, there’s certainly been many of these areas where things are improving and over the past week, really benefiting off of some strength coming into the markets, energy markets turning higher. But this is how the software can help you, is understanding that, okay, if things are still bearish, great, you can continue those buying or selling campaigns that you identify in an area, but recognizing when those trades are over and when’s things have shifted and you should go ahead and change that overall game plan.
So once again, this has been our hot stocks outlook for October 9th, 2020. Thank you all for watching, best of luck out there and bye for now.