


Hot Stocks Outlook for the Week of
September 6, 2019
The Hot Stocks Outlook uses VantagePoint’s market forecasts that are up to 87.4% accurate, demonstrating how traders can improve their timing and direction. In this week’s video, VantagePoint Software reviews forecasts for Seagate Technology(STX), Oracle Corporation(ORCL), Duke Energy Corporation(DUK), Franklin Resources(BEN), Meredith Corporation(MDP).
This Week’s Hot Stocks Outlook
Good afternoon traders and welcome back to the Hot Stocks Outlook for September 6th, 2019. Hope you all are having an excellent week in the financial markets and as always, plenty to cover in this week’s outlook.
Seagate Technology(STX)
So we’re going to start here with Seagate technology. We’ve got Oracle in the tech space there, Duke Energy for utilities, Franklin Resources, and lastly Meredith, which is publications and magazines and things like that.
So starting out here with Seagate Technologies, what we have are daily price actions. So each one of these bars represents a full and complete trading day and against that daily price action, you see that there’s a couple of lines on the chart there. Now the black line is a very common technical indicator. It’s simply a simple moving average or what we refer to as the actual simple moving average. And what that is is an indicator that’s a really good barometer of where prices have been in the past.
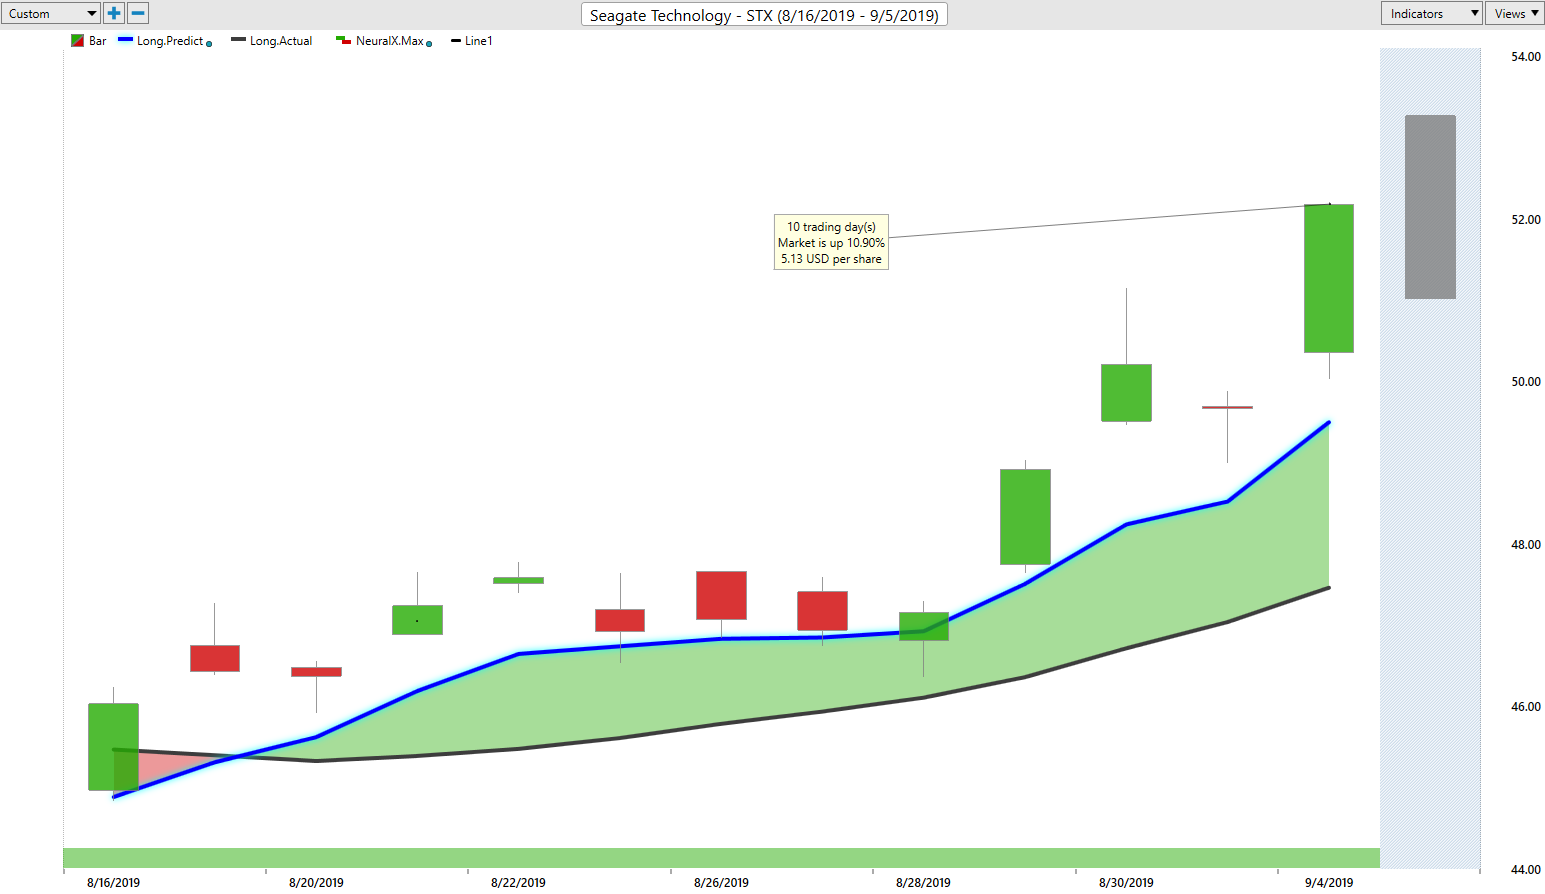
But of course, as a trader, we want to know where are prices going next. And so whenever we have that black line crossed by this blue value on the chart, we want to take notice of that because for this blue value to be generated, VantagePoint is performing a very sophisticated type of analysis called Intermarket analysis. And it’s specifically using the technology of artificial intelligence and neural networks to perform that type of analysis. So when forecasting for future average prices of Seagate Technology VantagePoint is looking at other related stocks, different ETFs, things like the NASDAQ or S&P 500, other futures markets, so currencies, interest rates. And it’s utilizing that information from other related markets and using that to generate future data that then is actually used to generate the value of this predicted moving average. So whenever that blue line of the predicted moving average moves above the black line of the actual moving average, it’s suggesting average prices are going to start moving higher.
But in addition to trend direction, we also have other indicators that are derived via those neural networks, that technology here. So the first one being this indicator at the bottom, which you see it stays green during the entire duration of this move. But we’ll have some more examples. But this is a very short term indicator. It’s only looking ahead 48 hours for strength or weakness in the markets. Think of it as just forecasting two candles at a time and keeps updating as it moves forward.
And lastly, your provided an actual predicted high and predicted low before each and every trading day. So actually a level that intraday you can understand, okay well where do I want to put my limits, where do I want my profit targets to be for the next trading day. And all of this gets updated on an end of day basis.
So here in shares of Seagate Technology, we see very clearly this predicted moving average moving to the upside. And therefore what you want to do is look towards things like, well short term, the Neural Index and also those predicted highs and lows, and we can see actually how accurately predicted highs and lows are against each trading day. So you see that we have a shadow candle here. The trend is, obviously, it’s the upside and what you’d want to be doing is buying at these predicted lows, taking profit at the predicted highs and you see about one, two, three, four, five entries over the course of this move as Seagate Technology’s starting to move higher.
So we had a lot of markets that were really moving lower all through the month of August, but there are things starting to turn up and really you’re seeing quite a mixed market here. So you see shares already up about 12.75, almost 13% here’s in Seagate Technology just in the past couple of weeks here.
Oracle Corporation(ORCL)
Now moving on to shares of Oracle, you’ll see a little bit different in this example and we have a longer move, but you get a little bit of change in the Neural Index. So remember this is only looking ahead 48 hours, so short term strength or weakness in the marketplace. But the overall trend you see here very much to the downside.
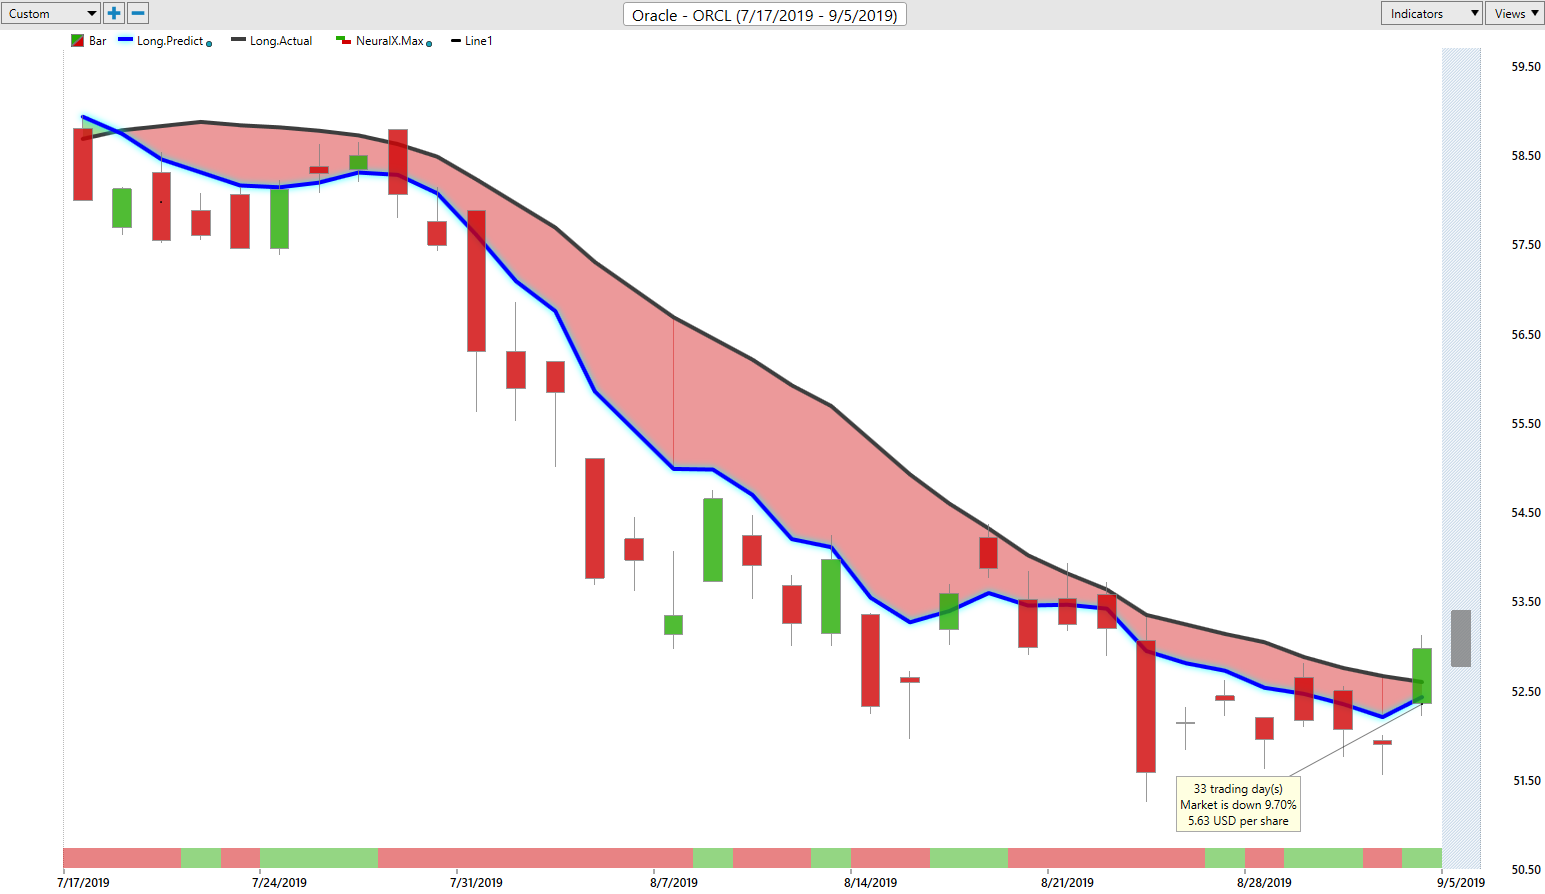
You see that crossover to the downside there from that predicted moving average moving below the actual moving average. And a couple of these portions where you see that neural index gets bullish and you get some short bullish price action, but the distance still between that blue and the black line suggesting prices are still moving lower. You, therefore, want to use your VantagePoint tools, in this case, the predicted highs, to identify areas to actually go ahead and short the market. So you see here over the course of this move, plenty of opportunities to get short as the market’s decline, easily about 10% over the past month here, but multiple opportunities along the way to add to that short position as obviously as things got really volatile towards the beginning of the month, a great time to come in and initiate those short positions and you can trail those stops and you see about 1, 2, 3, 4, 5, 6, 7, 8, 9, 10 entries as that market moves down about 10% over the last month.
Duke Energy Corporation(DUK)
Here in shares of Duke Energy. So utilities, one of the few places doing pretty well here, crossover to the upside from that predicted moving average moving into the upside, you see your Neural Index, you see you get a red configuration here, you get a little bit of volatility to the downside here on the next trading day. Again, that short term, 48-hour weakness, but the trend, that blue line is still very much above the black line and we see we’ve got a really nice move here in shares of Duke Energy. Market up over 7% obviously utilities don’t move a whole lot, but a great opportunity to get involved in the stock, compliment all those short opportunities over the past couple of months here, something, a bit more defensive.
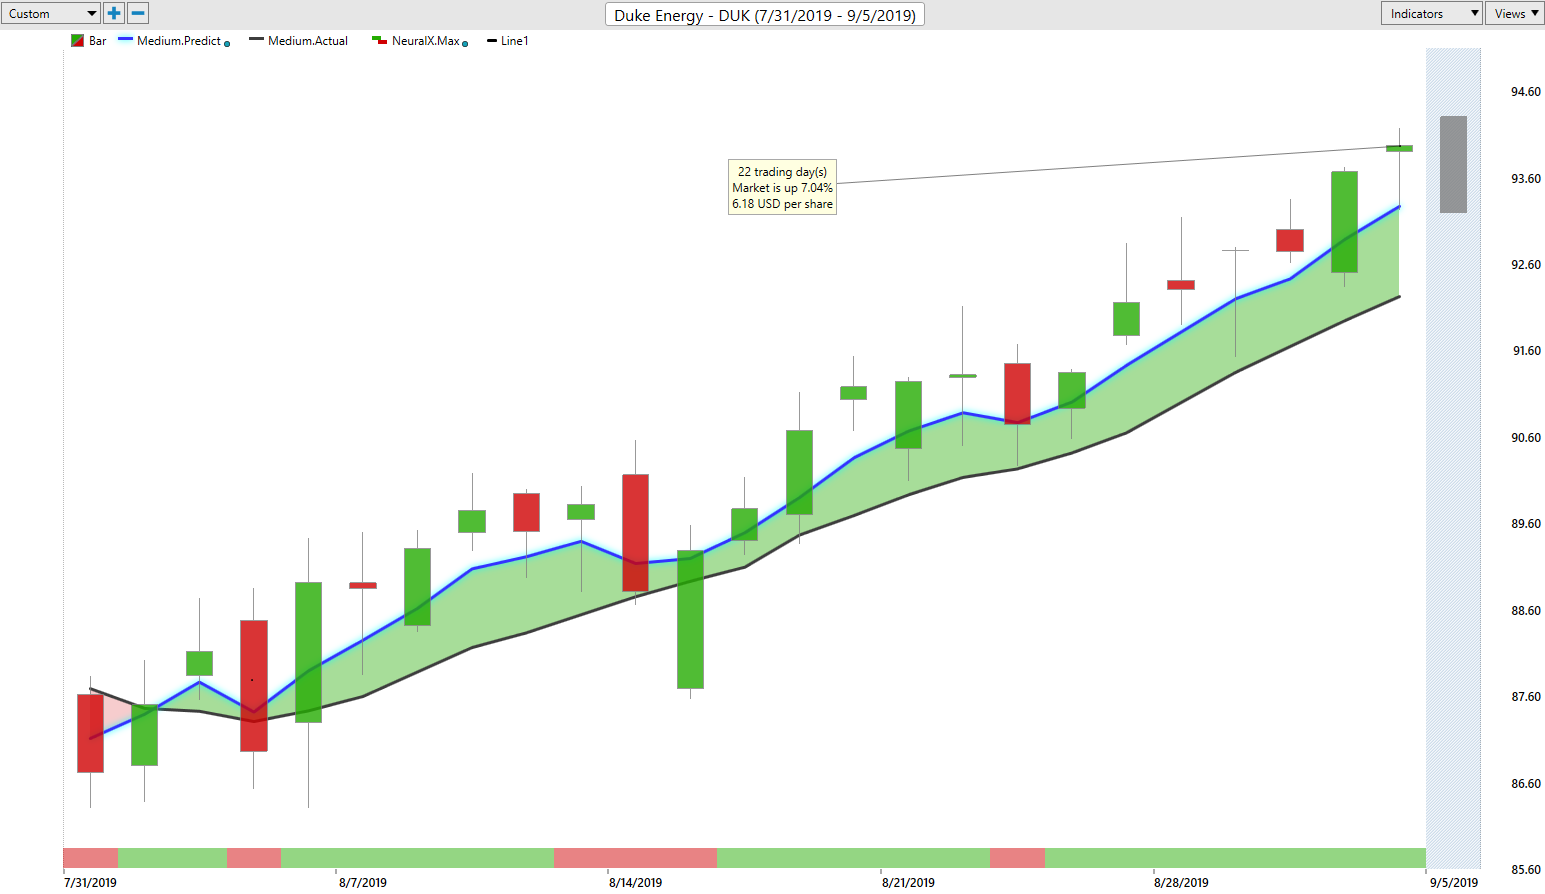
But again, along the way here there are multiple opportunities to buy into your position, maybe take some short term profits up near the predicted highs, buy back in at predicted lows and make the most of this seven percentage. You see multiple, a one and a half, 2% moves from those predicted lows within really a day or two as that overall trend continues to the upside.
Franklin Resources(BEN)
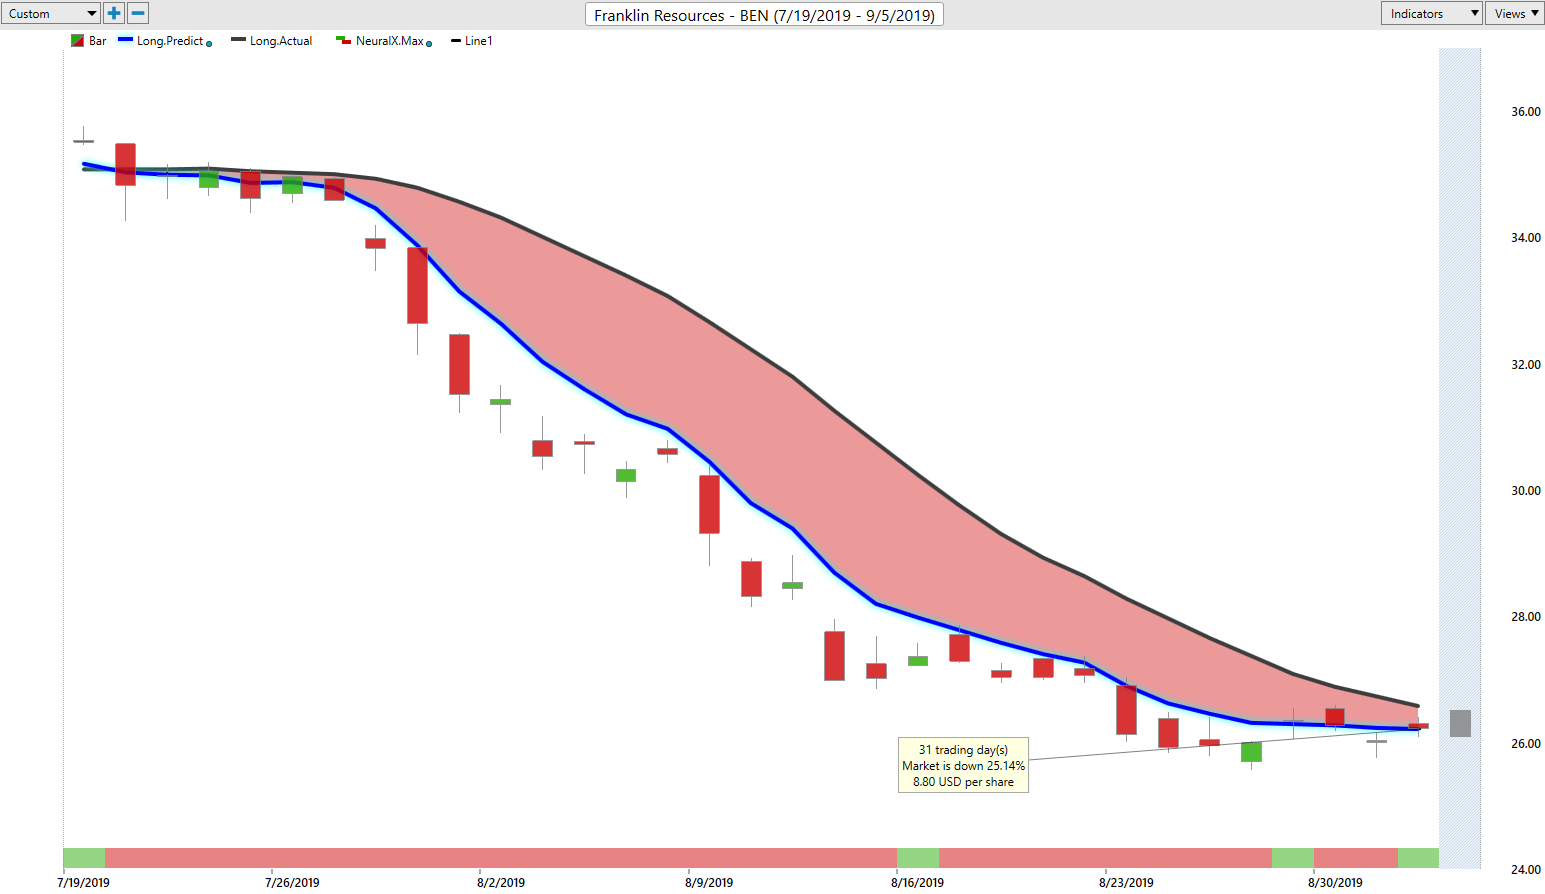
Here, Franklin Resources, we took a look at this a couple of weeks ago when we really started to see all that weakness come in in the markets and you see still you’re seeing the Neural Index say okay, well we’re leveling out a little bit here, but blue line’s still below the black line and the trend still very much to the downside. Certainly, want to look for other places to go ahead and get long, but numerous opportunities here and even when the market starts running sideways, you still have those intraday levels helping you guide and manage the position and really get the most of it. Over the last week, take some profit here, cover your position, maybe try to re-shore it up at these predicted highs and walk that forecast forward. So that blue and the black line indicating okay, well do you want to remain on the short side there, take some profits on your shorts or is that blue line going to cross and you, therefore, want to go ahead and reverse that position there.
Meredith Corporation(MDP)
Lastly here, shares of Meredith. Same thing here, crossover to the downside and just see this tremendous weakness from the Neural Index as this market moves from 55 all the way down to 43 and you see very similar pictures, seeing a lot of stocks start to level off here and go sideways pretty close there as far as our blue and black line, pretty much right on top of each other in this most recent forecast. You see pretty much one penny away from each other saying this market’s really going sideways.
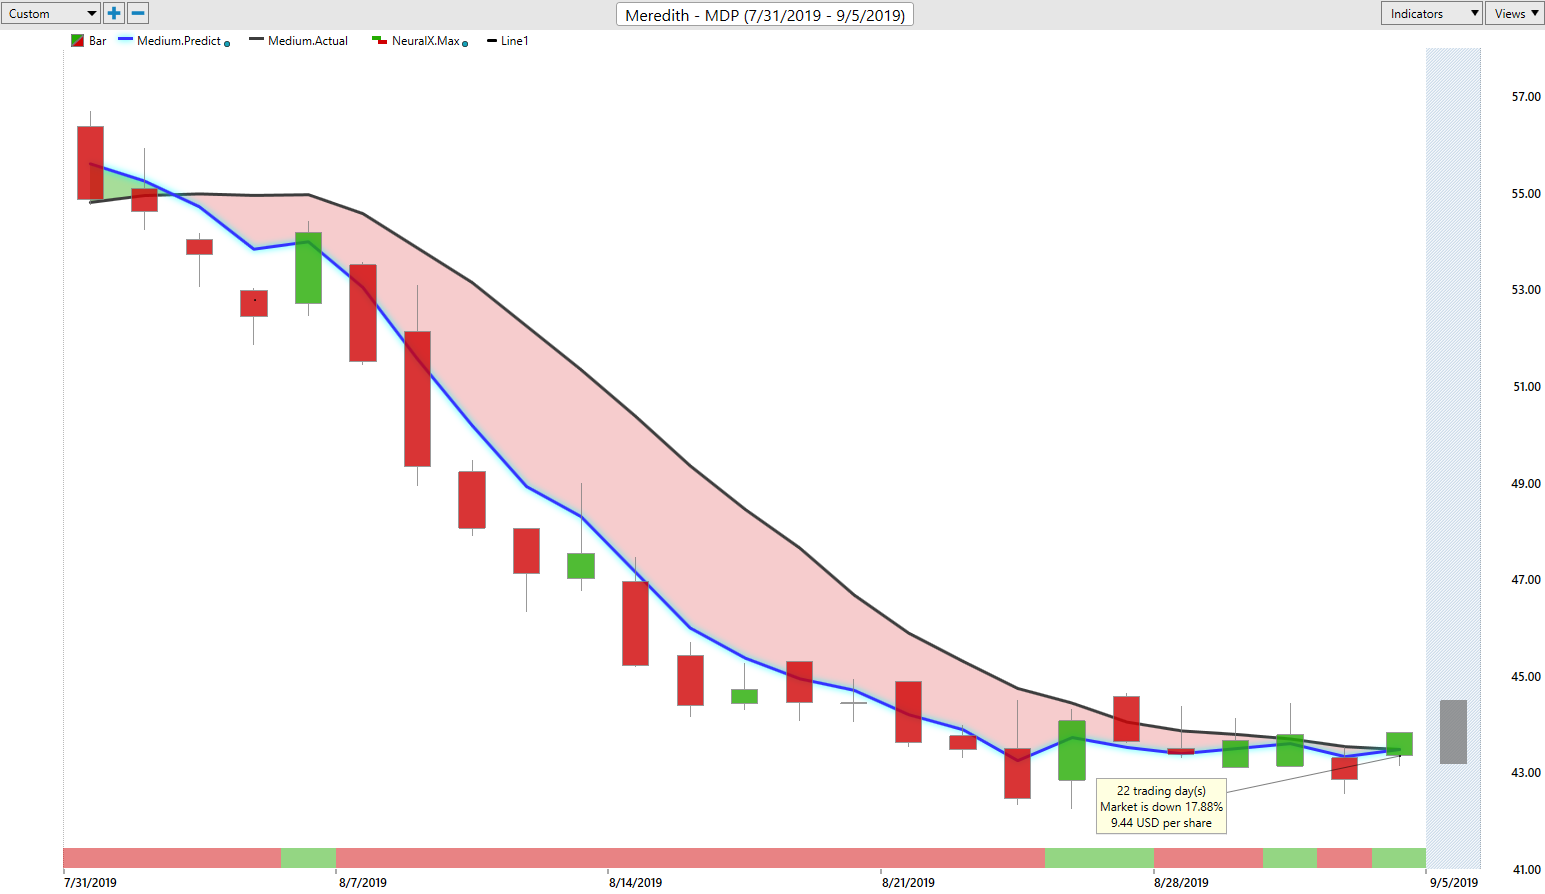
You’ve got Neural Index mixed, but obviously, the beginning of this move saying okay, well where do you want to go ahead and look to get short. Well, really up at these predicted highs, that’s where it’s screaming at you that okay, well if you’re going to take a position on this market, there’s only one way to trade it. And that’s going short, shorting up at these predicted highs. And you see here, 1, 2, 3, 4, 5, 6, 7, 8, 9, 10, 11, 12, 13, 14 entries on the short side of the market. And that’s 14 entries in a market that’s moved down over the past month here, almost down over out 20% here, about 19% in just the past 21 trading days. So again, that month of August coming in, plenty of these opportunities to get short.
And there are these areas where you can go ahead and reverse those positions and look to get long. You’ve seen Seagate, some of these areas, doing really well, but certainly, just this past week entering into that period where things are not moving down as quickly to the downside anymore. There are some areas to go ahead and get long and create that hedged portfolio. So you’re making money regardless of what happens here with the S&P 500 stocks more generally.
So once again, this has been our Hot Stocks Outlook for September 6th, 2019. Thank you all for watching. Best of luck and bye for now.

