There was a time when running your household like the U.S. government would result in foreclosure, awkward conversations with relatives, and perhaps a strongly worded letter from your bank. Today, somehow, an economy producing roughly $28 trillion of output supports more than $100 trillion in debt and liabilities while policymakers, economists, and television pundits congratulate themselves for achieving “resilience.” The math, as the kids say, is not mathing.
Yet markets continue climbing. Stocks make new highs. Debt expands. Governments borrow more. Central banks create liquidity whenever financial gravity becomes inconvenient. Which raises an uncomfortable question: if debt is growing exponentially faster than the economy itself, what exactly is supporting the system? The answer matters because traders are no longer navigating a market driven solely by productivity, profits, and supply and demand. They are navigating a market increasingly powered by credit creation, capital flows, scarcity, and one very busy monetary printing press.
There is no shortage of macro catalysts confronting markets right now. A new Federal Reserve Chair is preparing for a first major interest rate decision and press conference in the next 12 days, midterm elections are rapidly approaching, and investors are once again trying to separate political narratives from economic realities. History suggests administrations of both parties tend to prefer strong economies, supportive financial conditions, and optimistic headlines heading into elections because voters, more often than not, vote their pocketbooks. Against that backdrop, I recently stumbled across a chart that I bookmarked and spent hours studying because it appeared to explain far more than debt levels or GDP growth alone. It offered a framework for understanding liquidity, market cycles, purchasing power, and why traders increasingly need to think less about headlines and more about the underlying machinery driving capital flows. This article explores exactly that.
According to the latest University of Michigan Consumer Sentiment survey, Americans are in a mood generally reserved for people assembling furniture without instructions, and anyone opening a grocery bill. A record number of people think the economy stinks. This has puzzled certain commentators because government statistics insist the economy is doing wonderfully. Apparently, Americans are expected to trust spreadsheets over their own credit card statements. The official story says unemployment is low, wages are solid, and everything is fine. Americans, meanwhile, are staring at grocery prices like they’re luxury goods.
Part of the disconnect may be that government statistics have a remarkable ability to make unpleasant realities appear merely inconvenient. Alternative measurements of unemployment, including people who stopped looking for work or settled for part-time jobs because full-time work never showed up, paint a less cheerful picture. Using broader definitions, unemployment looks considerably higher. If your economy requires increasingly creative definitions to appear healthy, you may not have an economic expansion so much as a statistical magic trick.
Then there is inflation, which economists often discuss the way veterinarians discuss putting down a beloved family pet: gently, with lots of soothing language. Prices continue climbing faster than many paychecks. The Federal Reserve’s preferred inflation gauge says prices rose modestly. Consumers shopping for groceries, insurance, housing, or healthcare seem to have reached a different conclusion. Since the dollar’s final connection to gold disappeared in 1971, America has enjoyed the extraordinary convenience of a monetary system where new money can appear whenever policymakers decide another emergency has arrived. Conveniently, emergencies appear with impressive regularity.
As purchasing power shrinks, debt fills the gap. Households borrow more. Students borrow more. Drivers borrow more. Governments borrow more. The United States has evolved into an economy where debt increasingly functions less like financial leverage and more like emotional support equipment. Consumers carry record balances. Government debt approaches levels previously associated with historical documentaries. And because debt must continuously expand to keep the machine operating smoothly, the system becomes increasingly dependent on lower rates, more liquidity, and larger borrowing needs.
Politicians now compete over who can make life more affordable, usually by proposing policies that involve spending more money the government does not have. This works politically because voters enjoy benefits today and accounting later. But arithmetic has a stubborn personality. Eventually, rising debt, expanding deficits, and larger financing costs force difficult decisions. The real debate is not whether math matters. The debate is whether math arrives gradually with reforms and restraint or abruptly with markets doing the calculations on everyone’s behalf.
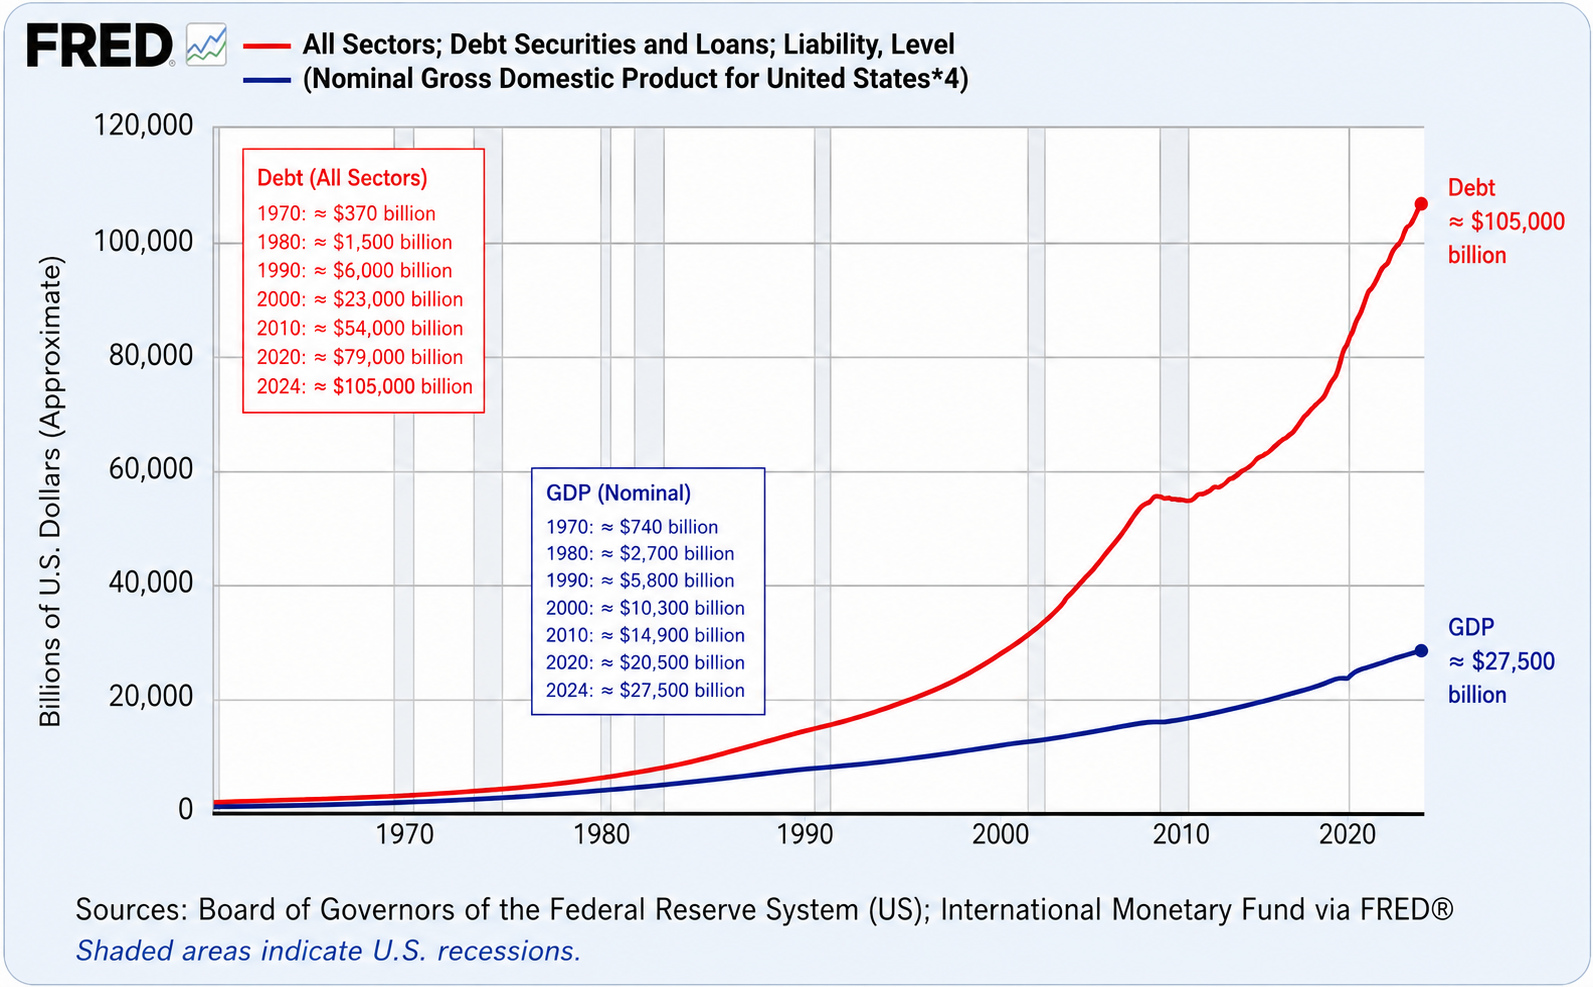
This chart shows that debt has grown dramatically faster than nominal GDP for decades, suggesting the economy increasingly relies on larger amounts of borrowing and liquidity creation to generate each additional dollar of output. For traders, this matters because markets often respond less to headlines and more to liquidity, credit conditions, and capital flows, meaning understanding debt expansion may be just as important as understanding earnings, valuations, or economic forecasts.
The chart above is NOT showing U.S. Federal Government debt only.
It’s showing:
All Sectors; Debt Securities and Loans; Liability, Level
That means it includes:
Federal Government debt
State and local government debt
Household debt (mortgages, credit cards, auto loans)
Corporate debt
Financial sector debt
Bank liabilities
Consumer loans
Business borrowing
Foreign sector liabilities in the system
Other credit market liabilities
The chart shows how dependent the entire economic machine has become on credit expansion.
America used to build wealth the old-fashioned way: savings, productivity, innovation, and occasionally inventing things people wanted. Now we appear to have discovered a more modern strategy: borrow aggressively, print enthusiastically, and call it economic growth. The dirty little secret behind modern markets is that debt has expanded far faster than the economy itself, while policymakers treat credit creation like a miracle drug with no side effects. And for a while, it works beautifully. Flood the system with easy money and suddenly everything rises. Stocks rise. Houses rise. Gold rises. Crypto rises. The family dog probably has a higher valuation. But traders eventually learn an uncomfortable truth: when liquidity disappears, gravity stops being a theory and becomes an event.
The truly impressive achievement is that we have transformed financial markets from engines of price discovery into giant liquidity detectors. Markets used to ask difficult questions like: Is this company profitable? Is productivity improving? Does valuation matter? Today the more relevant question is: where is the next wave of money flowing? Because when growth increasingly requires oceans of new fiat currency, expanding deficits, and debt multiplying faster than productive output, purchasing power starts melting away like ice cubes at a July barbecue while economists debate whether it feels hot outside. Traders who understand this stop obsessing over headlines and start watching liquidity because in modern finance, money talks, credit amplifies, and arithmetic eventually demands equal time.
Deficits sound complicated, but the concept is surprisingly simple: governments spend more money than they collect in taxes and borrow the difference. Unlike households or businesses, however, governments operating under fiat currency systems play by a different set of rules. Families cannot issue bonds purchased by global markets. Businesses cannot create currency. Sovereign governments with control over their own monetary systems can borrow at extraordinary scale because investors, institutions, foreign governments, and central banks all participate in financing the system.
The process itself is almost mechanical. Treasury issues debt to finance spending. Markets absorb that debt. Central banks influence the cost of borrowing through interest rates, liquidity facilities, and, in periods of stress, direct asset purchases. This combination of deficit spending, Treasury issuance, and monetary expansion creates liquidity that rarely sits still. It moves through financial markets, real estate, commodities, credit markets, and speculative assets, often lifting valuations far beyond what fundamentals alone might justify.
For traders, the lesson is straightforward. Markets do not simply react to earnings reports or economic headlines. They react to liquidity conditions. Capital flows toward areas where money is abundant, financing is accessible, and risk appetite expands. In modern markets, understanding where liquidity is flowing often matters far more than understanding what headlines are saying.
Inflation is often described as rising prices. Markets tend to see it differently. Markets see incentives. When the supply of money and credit expands faster than the supply of scarce goods, productive assets, or finite resources, capital begins searching for places to hide, preserve value, or compound faster than currency can lose purchasing power. This is where currency debasement moves from economic theory to market reality.
For decades, investors have operated inside a financial system where monetary expansion, deficit spending, and rising debt levels have become structural rather than cyclical. More dollars enter the system through credit creation, government spending, Treasury issuance, and banking expansion. Those dollars rarely remain idle. They flow into equities, real estate, commodities, collectibles, cryptocurrencies, and increasingly into anything perceived as scarce. The result is that scarcity itself becomes a premium investors are willing to pay for.
This helps explain one of the defining puzzles of modern markets: why assets that appear expensive often become even more expensive. When capital competes for limited supply, valuations can disconnect from historical norms for extended periods. Gold, energy, industrial metals, farmland, housing, premium technology assets, and digitally scarce assets all become participants in the same larger trade. Investors are not simply buying growth. They are buying insulation from dilution.
For traders, the implication is important. Nominal prices matter less than relative performance. In periods of monetary expansion, leadership often concentrates in sectors with constrained supply, pricing power, or scarcity characteristics. This is why capital flows matter more than narratives. Money moves first. Headlines usually arrive later.
The market lesson is simple: when currency supply expands persistently, scarcity itself becomes an asset class. Traders who understand where capital seeks refuge often find themselves aligned with stronger trends rather than fighting them.
Here is a lesson markets teach repeatedly: when governments create more money, investors go hunting for things governments cannot create more of. You can print dollars. You cannot instantly print copper mines, oil fields, farmland, uranium deposits, prime real estate, or Bitcoin. Scarcity has a funny habit of becoming extremely valuable when abundance becomes policy.
Look around at the assets that repeatedly capture capital during inflationary periods and monetary expansion cycles. Energy. Precious metals. Industrial metals. Agricultural products. Infrastructure. Water. Housing. Digital scarcity. These are not random winners. They share one common trait: supply constraints. When more money competes for limited supply, prices tend to respond accordingly. This is Economics 101 with bigger numbers and more emotional investors.
For traders, scarcity creates something even more important than a narrative. It creates trends. Capital flows toward sectors where demand exceeds supply and where companies have pricing power.
The mistake most traders make is waiting for economists or television personalities to explain the move after it already happened. Winners usually leave footprints early. Relative strength improves. Capital rotates. New highs appear. The strongest stocks separate from the crowd. Your job is not to argue whether the scarcity story is right or wrong. Your job is to identify where money is moving.
The takeaway is simple: in a world of expanding debt and expanding fiat currency, scarcity becomes a trading strategy. Follow the sectors with limited supply, strong trends, and improving relative strength because capital almost always runs toward what it cannot easily replace.
One of the most expensive mistakes traders make is confusing opinions with capital flows. Markets do not care about political preferences, economic forecasts, or social media debates. Markets care about where money is moving. Capital leaves footprints, and those footprints show up in relative strength, sector leadership, price momentum, and stocks making new highs while everyone else argues about valuation.
This becomes especially important in debt-heavy, liquidity-driven environments. When monetary expansion accelerates, not every asset benefits equally. Capital concentrates. Leadership narrows. Certain sectors absorb disproportionate flows while others quietly underperform for years. The objective is not to own everything. The objective is to identify where institutional money is consistently allocating capital and align yourself with those trends.
This is why relative strength remains one of the most powerful filters available to traders. Ask simple questions. Is the stock outperforming the broader market? Is it outperforming its sector peers? Is it making higher highs while weaker names struggle? Is the sector itself attracting capital? Strong stocks tend to become stronger because money managers, algorithms, passive flows, and momentum participants frequently reinforce existing leadership.
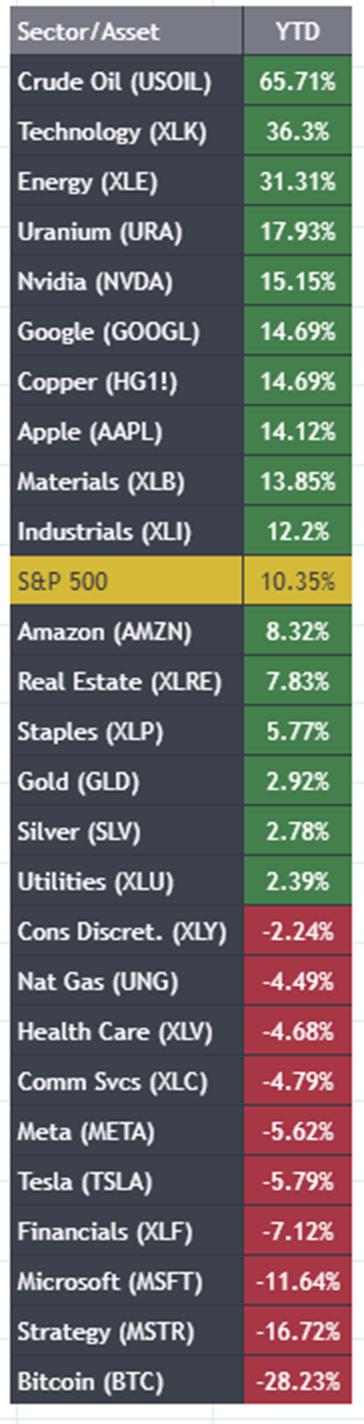
The scoreboard matters more than the story. Companies making new 52-week highs, sectors outperforming major indexes, and assets demonstrating persistent leadership deserve attention because markets reward strength far longer than most people expect. Traders often spend too much time searching for the next turnaround and not enough time studying what is already working.
The takeaway is simple: winners keep winning until they stop. Your edge is not guessing which narrative sounds smartest. Your edge is in forecasting where capital is flowing, identifying leadership early, and having the discipline to stay aligned with strength while avoiding the temptation to rescue underperformers.
Wall Street likes to pretend markets are giant voting machines weighing earnings, valuations, and economic theory. Increasingly, they look more like plumbing systems. Treasury issuance, deficit spending, central bank policy, and credit creation determine how much money sloshes through the pipes. Traders can spend hours debating whether markets should go up or down, but history repeatedly shows that when liquidity expands, asset prices tend to follow, often long before economists or strategists update their forecasts.
One of the more underappreciated questions in modern markets is not what is valuable, but what is difficult to create. In a world where governments can issue debt at scale and central banks can expand balance sheets rapidly during crises, capital often migrates toward assets with perceived scarcity.
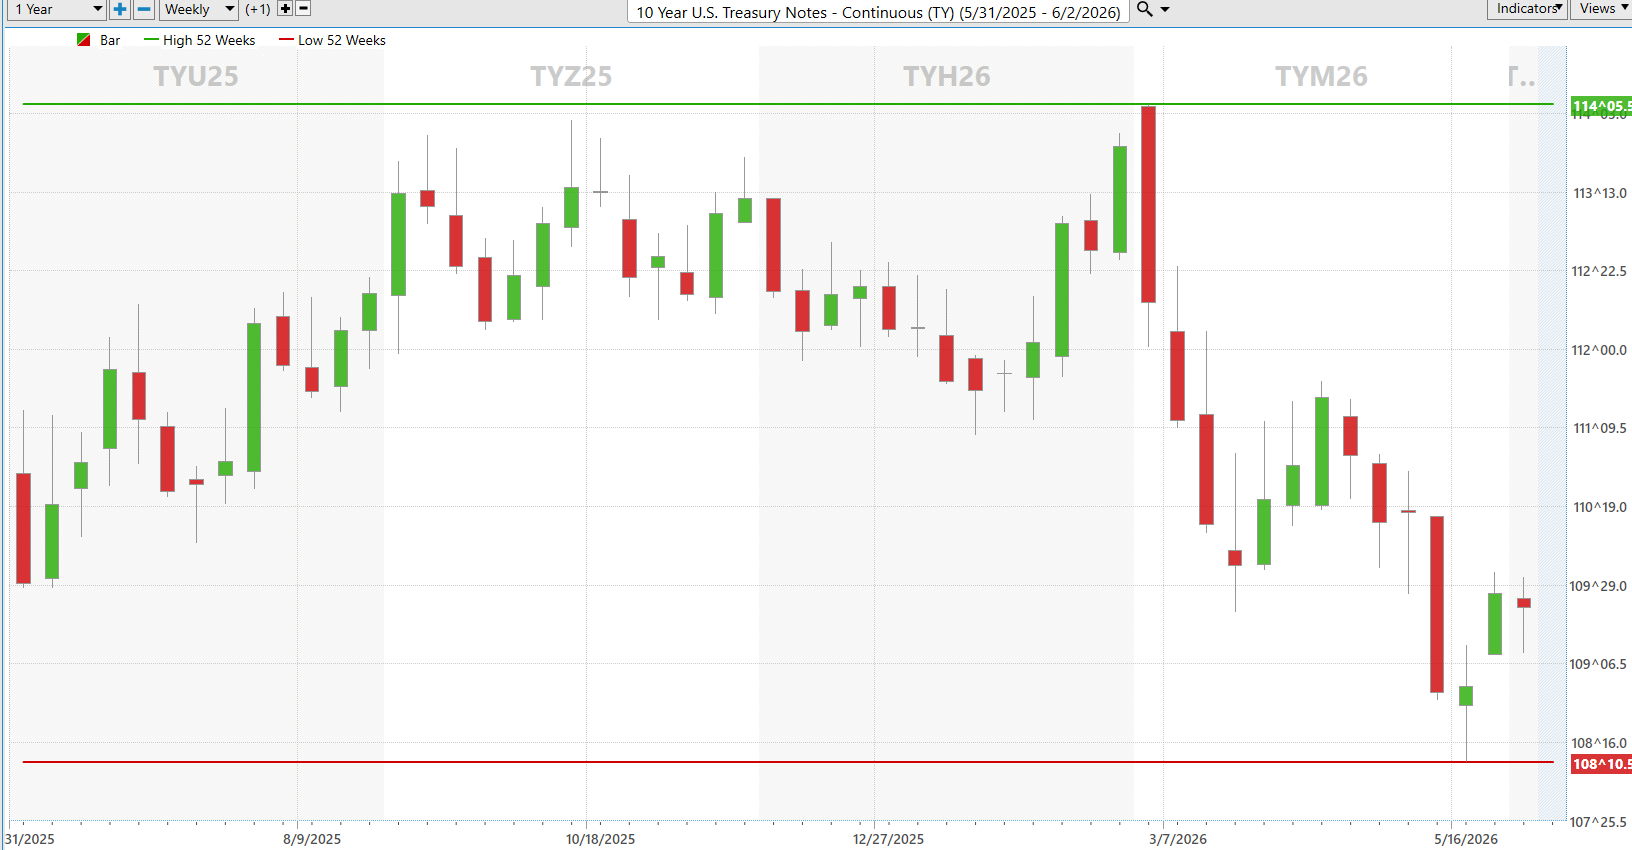
Many traders still begin their day by looking at stock futures. Increasingly, they may want to start with the bond market instead. Treasury yields influence mortgage rates, corporate borrowing costs, government financing expenses, equity valuations, and risk appetite simultaneously. In an economy increasingly dependent on refinancing, deficits, and debt issuance, Treasury auctions and yield movements may be sending stronger signals about future market conditions than headlines or earnings releases. The Treasury chart below just made a new 52-week low which means interest rates on the 10-year hit a new 52-week high.
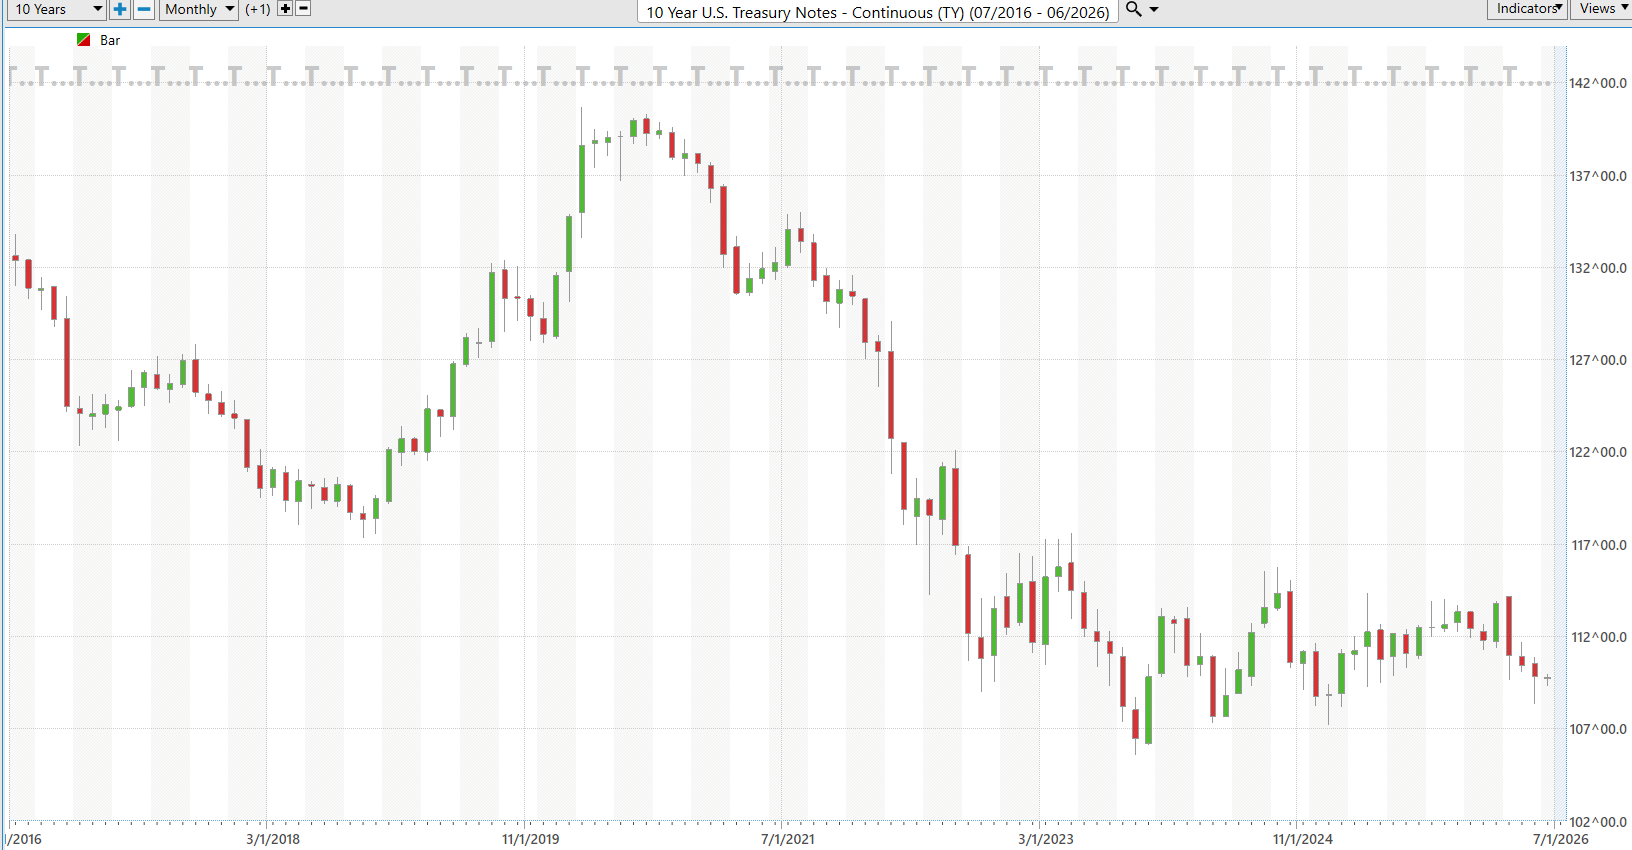
The 10-year monthly Treasury chart looks much heavier to me and is a clear signal that the government will be forced to print to support it.
Debt rarely becomes a market problem all at once. More often, it becomes a financing problem first. As government debt expands, larger amounts must be refinanced, rolled over, and absorbed by investors year after year. That creates an increasingly important question for markets: who buys the next trillion dollars of debt, and at what price?
Treasury markets sit at the center of that equation because Treasury yields influence nearly every major asset class. Higher yields increase borrowing costs for households, corporations, and governments. Mortgage rates rise. Corporate financing becomes more expensive. Equity valuations face pressure because future cash flows become less attractive when safer alternatives offer higher returns. What begins as a bond market adjustment rarely stays contained inside the bond market.
This dynamic becomes even more important in heavily indebted systems. Larger deficits require larger Treasury issuance. Larger issuance requires stronger demand. If demand weakens, yields often rise to attract buyers. Rising yields then increase government interest expenses, which can contribute to even larger deficits and additional borrowing needs. The cycle becomes increasingly self-reinforcing.
For traders, Treasury markets provide critical information about liquidity conditions and market regime shifts. Falling yields often signal easing financial conditions, expanding liquidity, and stronger appetite for risk assets. Rising yields can signal tighter conditions, higher financing costs, and greater sensitivity to valuation compression. Markets frequently debate earnings, politics, and economic forecasts while quietly responding to what the bond market already priced in.
The takeaway is straightforward: monitor Treasury markets as closely as earnings reports. In modern markets, bonds are no longer a side conversation. They are often the transmission mechanism through which debt, deficits, liquidity, and monetary policy ultimately influence nearly every other asset class.
Traders got served one of Wall Street’s favorite meals this week: two smart people staring at the same elephant and arguing whether it’s a rope or a tree. One camp says we’re reliving the dot-com bubble with better Wi-Fi. The other says the party may just be getting started and the punch bowl still has plenty left in it. Welcome to modern finance, where trillion-dollar decisions are made by people using different spreadsheets to explain the same madness.
The bears fired first. They point out that the S&P 500 is making record highs while most stocks are behaving like relatives avoiding eye contact at Thanksgiving dinner. Only a small group of mega-cap companies are doing the heavy lifting. AI startups are vacuuming up billions before they even have a cafeteria menu, much less profits. To them, this smells suspiciously like 1999, except now the buzzwords are “artificial intelligence” instead of “eyeballs” and “page views.”
Then came the bulls. Goldman CEO David Solomon essentially looked around the casino floor and said, “The chips are still flowing.” His point was simple: markets run on liquidity, greed has clearly beaten fear into submission, and bubbles have a nasty habit of lasting much longer than people betting against them can stay solvent. If AI fortunes create more spending, more investing, and more speculation, then the machine can feed itself for quite a while.
So, what should traders do with all this? Stop trying to predict when the music stops and start watching where the money is dancing. Markets do not collapse because journalists publish scary headlines. Markets break when liquidity dries up, credit tightens, or the leaders stop leading. Until then, your job is not to argue with the scoreboard. Your job is to read it.
That is why all eyes will be on Fed Chair Kevin Warsh’s first FOMC meeting and press conference.
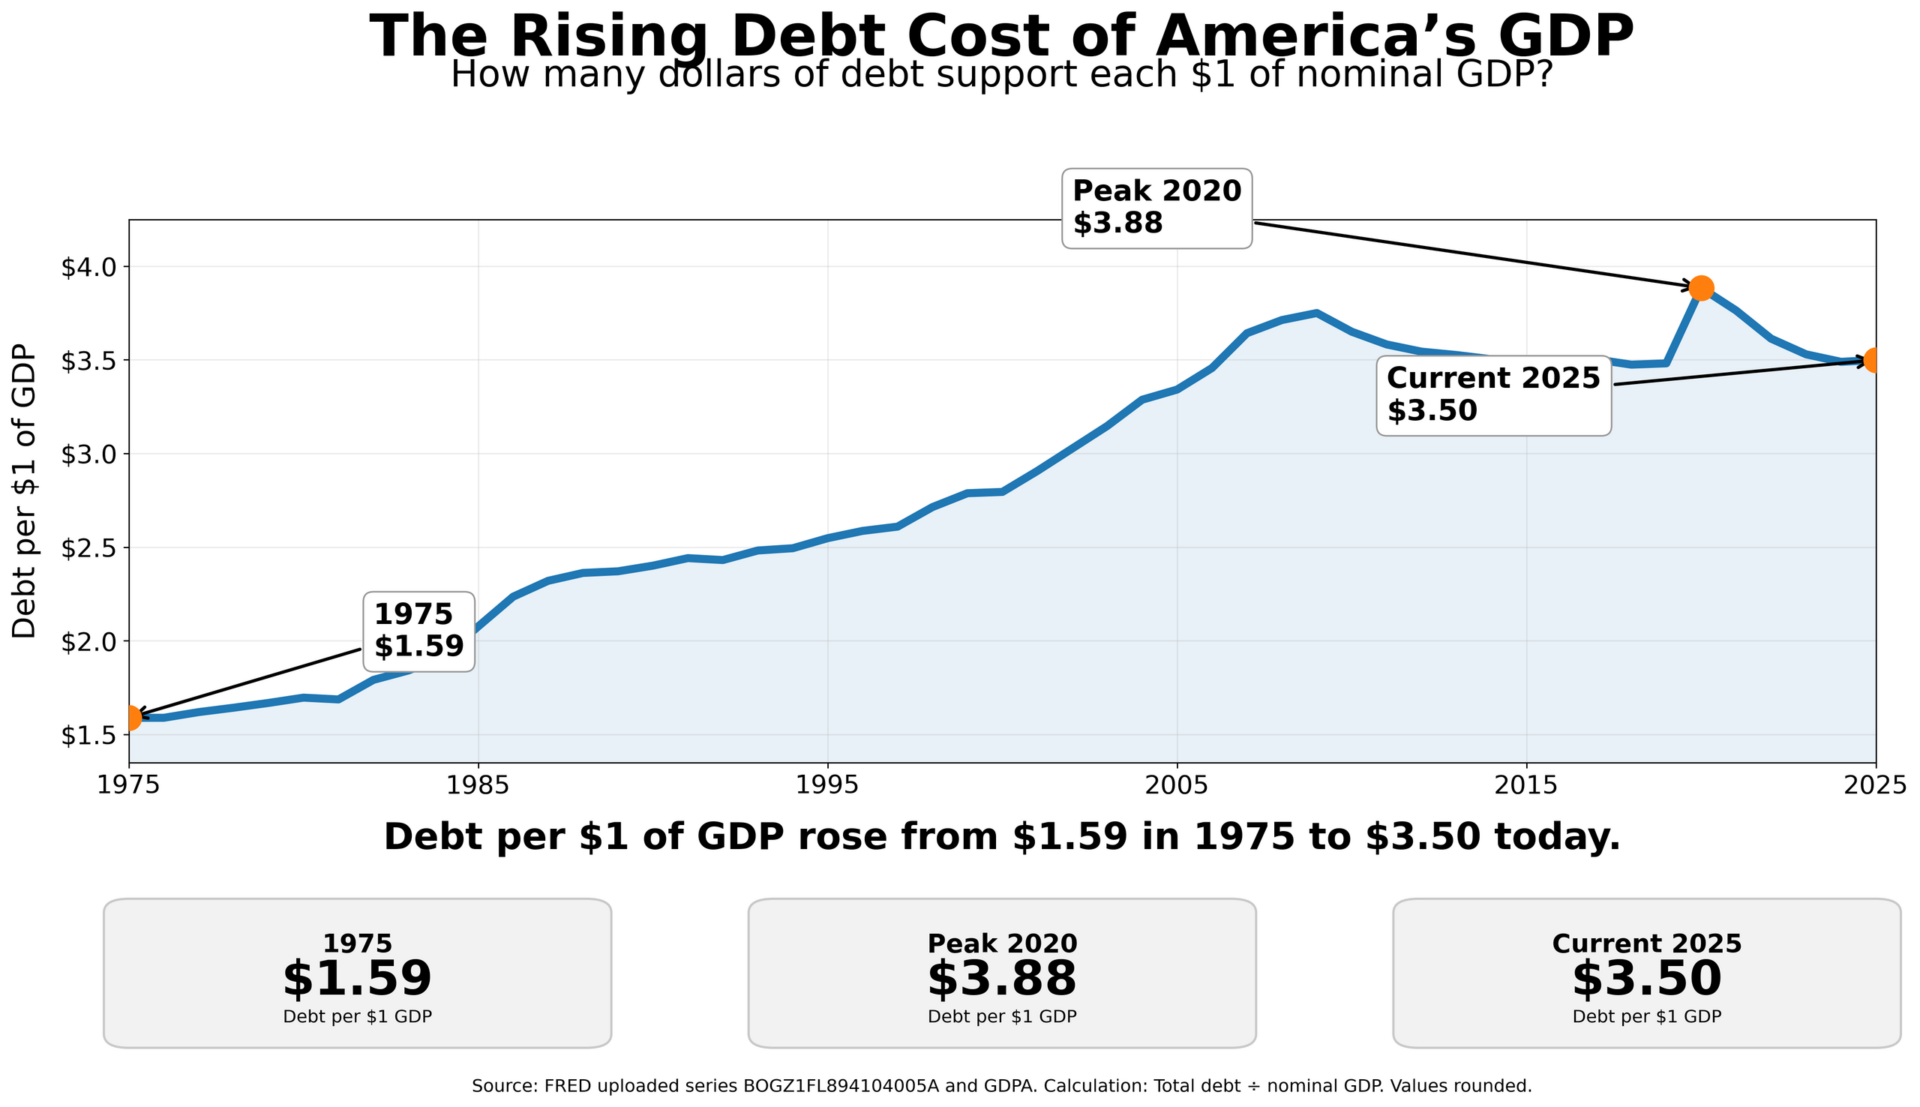
If this chart makes your head spin, congratulations. You are reacting appropriately. Because what it appears to show is that over time America has discovered a fascinating economic innovation: needing progressively more debt to produce the same dollar of economic output. In 1975, the system carried about $1.59 of debt for every $1.00 of GDP. Today that number is roughly $3.50. Imagine owning a lemonade stand where every year you had to borrow more money just to sell the same glass of lemonade. Your banker would stage an intervention.
The uncomfortable reality is that we increasingly resemble an economy powered by debt creation with the government gripping the steering wheel, one hand on the accelerator and the other reaching for another Treasury auction. In the private sector, no CEO walks into a board meeting and proudly announces, “Fantastic news everyone, we spent $3.50 to create $1.00 of productivity.” That CEO gets escorted to the parking lot carrying a cardboard box. Yet at the macro level, the system keeps operating because governments possess one superpower unavailable to households and businesses: access to borrowing markets, fiat currency, and monetary expansion.
What makes this even stranger is that the machine can keep working for longer than common sense would suggest. More debt creates liquidity. Liquidity finds assets. Assets rise. Then rising assets create confidence, which encourages more borrowing, which creates more liquidity. It is less like a finely tuned capitalist engine and more like a carnival ride held together with duct tape, cheap financing, and optimism. Traders ignore this feedback loop at their own peril.
And here is the part that makes traditional valuation purists uncomfortable: if more currency units continue chasing scarce assets, prices can keep rising even if the underlying arithmetic becomes increasingly absurd. Stocks rise. Houses rise. Gold rises. Commodities rise. Even mediocre assets sometimes rise simply because money itself becomes more abundant. When the measuring stick changes, everything measured by it tends to look larger.
So, the lesson for traders is not necessarily that markets must collapse tomorrow. It is recognizing the environment for what it appears to be: a system increasingly dependent on credit expansion where debt growth, liquidity flows, deficits, and monetary policy matter enormously. In other words, do not just watch earnings. Watch the fuel tank. Because in this market, liquidity may matter almost as much as productivity.
GDP itself is a very strange metric. Government spending is counted inside GDP, which means borrowing money, spending it, and then celebrating the spending can sometimes look suspiciously like prosperity. Strip away government expenditures and what you are left staring at is the private sector carrying much more of the economic energy than many people realize, and depending on the period you examine, the picture can start looking less like a Norman Rockwell painting and more like a late-night Hitchcock marathon where everyone already knows the shower scene is coming.
The uncomfortable truth is that none of the charts in this article suggest the system is becoming less dependent on debt, easier money, or larger liquidity injections. If anything, they suggest the opposite. Over the last fifty years, debt has grown much faster than the economy itself, more debt is required to support each dollar of GDP, and markets have become increasingly sensitive to interest rates, Treasury issuance, and central bank policy. You do not have to agree with every macro argument to recognize what traders are facing: a world where currency debasement, expanding deficits, and larger capital flows increasingly shape price behavior.
This creates an important shift in mindset. The question going forward is when exactly scarce assets matter and how capital rotates between them. Throughout history, periods of aggressive monetary expansion have often pushed capital toward assets that are difficult to create: productive companies, energy, commodities, precious metals, real assets, and increasingly digital scarcity. The challenge for traders is that these rotations rarely happen neatly. They happen fast. They happen emotionally. And they happen while headlines scream conflicting narratives every day.
This is exactly why VantagePoint’s artificial intelligence is becoming increasingly valuable to traders. Modern markets produce more information, more noise, more macro variables, and more cross-market relationships than any human can realistically process consistently. Artificial intelligence does not eliminate risk, but it can dramatically reduce analysis time, identify emerging trends earlier, monitor intermarket relationships, highlight changing market conditions, and help traders focus on probabilities instead of opinions. In a world dominated by liquidity flows and algorithmic decision-making, using better tools becomes less of an advantage and more of a necessity.
Risk management matters even more. Traders do not get paid for being right about macroeconomics. They get paid for positioning correctly. The goal is identifying stronger trends, avoiding weaker markets, defining risk, and adapting when conditions change. The traders who survive long cycles are usually not the smartest economists. They are often the most disciplined managers of risk and opportunity.
If you would like to see how traders are using VantagePoint AI trading software to identify stronger trends, forecast market direction, manage risk, and analyze global markets in minutes instead of hours, I would like to invite you to attend a free Learn How To Trade With VantagePoint AI Live Online Masterclass.
Markets have changed. The rules have changed. The speed has changed. Yet millions of traders are still using tools built for an era when information traveled slowly, central banks intervened less, and market cycles unfolded over years instead of hours. Today, traders are fighting inflation, debt expansion, algorithmic trading, geopolitical shocks, and nonstop information overload. More opinions will not solve that problem. Better tools will.
That is why VantagePoint AI was built. Instead of forcing traders to spend hours sorting through endless charts, conflicting headlines, and yesterday’s indicators, VantagePoint AI uses predictive forecasting, intermarket analysis, neural networks, machine learning, and artificial intelligence to help identify where probabilities may be shifting before they become obvious. The goal is simple: save time, reduce emotional decision making, improve risk management, and help traders focus on what matters most, finding stronger opportunities while avoiding weaker markets.
The next decade may reward adaptability more than intelligence. Currency debasement, expanding debt, rapid sector rotation, and increasing volatility are not problems traders can vote away. But they can prepare for them. That is why I would like to invite you to attend a FREE Live Online MasterClass and see how traders are using VantagePoint AI to forecast trends, manage risk, and navigate uncertainty with greater confidence. Bring your favorite tickers. Bring your toughest questions. And see what happens when you stop reacting to markets and start preparing for them. Because in modern markets, speed matters. Preparation matters. And probabilities matter.
You will see how traders are using predictive technology to cut through noise, isolate opportunity, and navigate a market environment where liquidity, debt, and capital flows increasingly drive outcomes. Because if currency debasement, expanding deficits, and rapid market rotation are here to stay, learning how to adapt may become one of the most valuable investments you make.
It’s not magic.
It’s machine learning.
THERE IS A SUBSTANTIAL RISK OF LOSS ASSOCIATED WITH TRADING. ONLY RISK CAPITAL SHOULD BE USED TO TRADE. TRADING STOCKS, FUTURES, OPTIONS, FOREX, AND ETFs IS NOT SUITABLE FOR EVERYONE.IMPORTANT NOTICE!
DISCLAIMER: STOCKS, FUTURES, OPTIONS, ETFs AND CURRENCY TRADING ALL HAVE LARGE POTENTIAL REWARDS, BUT THEY ALSO HAVE LARGE POTENTIAL RISK. YOU MUST BE AWARE OF THE RISKS AND BE WILLING TO ACCEPT THEM IN ORDER TO INVEST IN THESE MARKETS. DON’T TRADE WITH MONEY YOU CAN’T AFFORD TO LOSE. THIS ARTICLE AND WEBSITE IS NEITHER A SOLICITATION NOR AN OFFER TO BUY/SELL FUTURES, OPTIONS, STOCKS, OR CURRENCIES. NO REPRESENTATION IS BEING MADE THAT ANY ACCOUNT WILL OR IS LIKELY TO ACHIEVE PROFITS OR LOSSES SIMILAR TO THOSE DISCUSSED ON THIS ARTICLE OR WEBSITE. THE PAST PERFORMANCE OF ANY TRADING SYSTEM OR METHODOLOGY IS NOT NECESSARILY INDICATIVE OF FUTURE RESULTS. CFTC RULE 4.41 – HYPOTHETICAL OR SIMULATED PERFORMANCE RESULTS HAVE CERTAIN LIMITATIONS. UNLIKE AN ACTUAL PERFORMANCE RECORD, SIMULATED RESULTS DO NOT REPRESENT ACTUAL TRADING. ALSO, SINCE THE TRADES HAVE NOT BEEN EXECUTED, THE RESULTS MAY HAVE UNDER-OR-OVER COMPENSATED FOR THE IMPACT, IF ANY, OF CERTAIN MARKET FACTORS, SUCH AS LACK OF LIQUIDITY. SIMULATED TRADING PROGRAMS IN GENERAL ARE ALSO SUBJECT TO THE FACT THAT THEY ARE DESIGNED WITH THE BENEFIT OF HINDSIGHT. NO REPRESENTATION IS BEING MADE THAT ANY ACCOUNT WILL OR IS LIKELY TO ACHIEVE PROFIT OR LOSSES SIMILAR TO THOSE SHOWN.