




Register for a Free Live Training
The Hot Stocks Outlook uses VantagePoint’s market forecasts that are up to 87.4% accurate, demonstrating how traders can improve their timing and direction. In this week’s video, VantagePoint Software reviews forecasts for Amgen ($AMGN), Netflix ($NFLX), Enbridge ($ENB), Abbot ($ABBT), Boston Scientific ($BSX), NetApp ($NTAP)
Hello again traders and welcome back to the Hot Stocks Outlook for August 14th, 2026. I hope you all have had an excellent week out there in the financial markets. And as always, we are here to take a look at the most recent VantagePoint AI predictive forecast.
So, if you haven’t already, be sure to go ahead and click the link down in the description below and you can get yourself signed up for a live demonstration and you can learn all the specifics about how these predictive indicators and artificial intelligence technology is helping traders make much better trading decisions out in the marketplace.
Amgen ($AMGN)
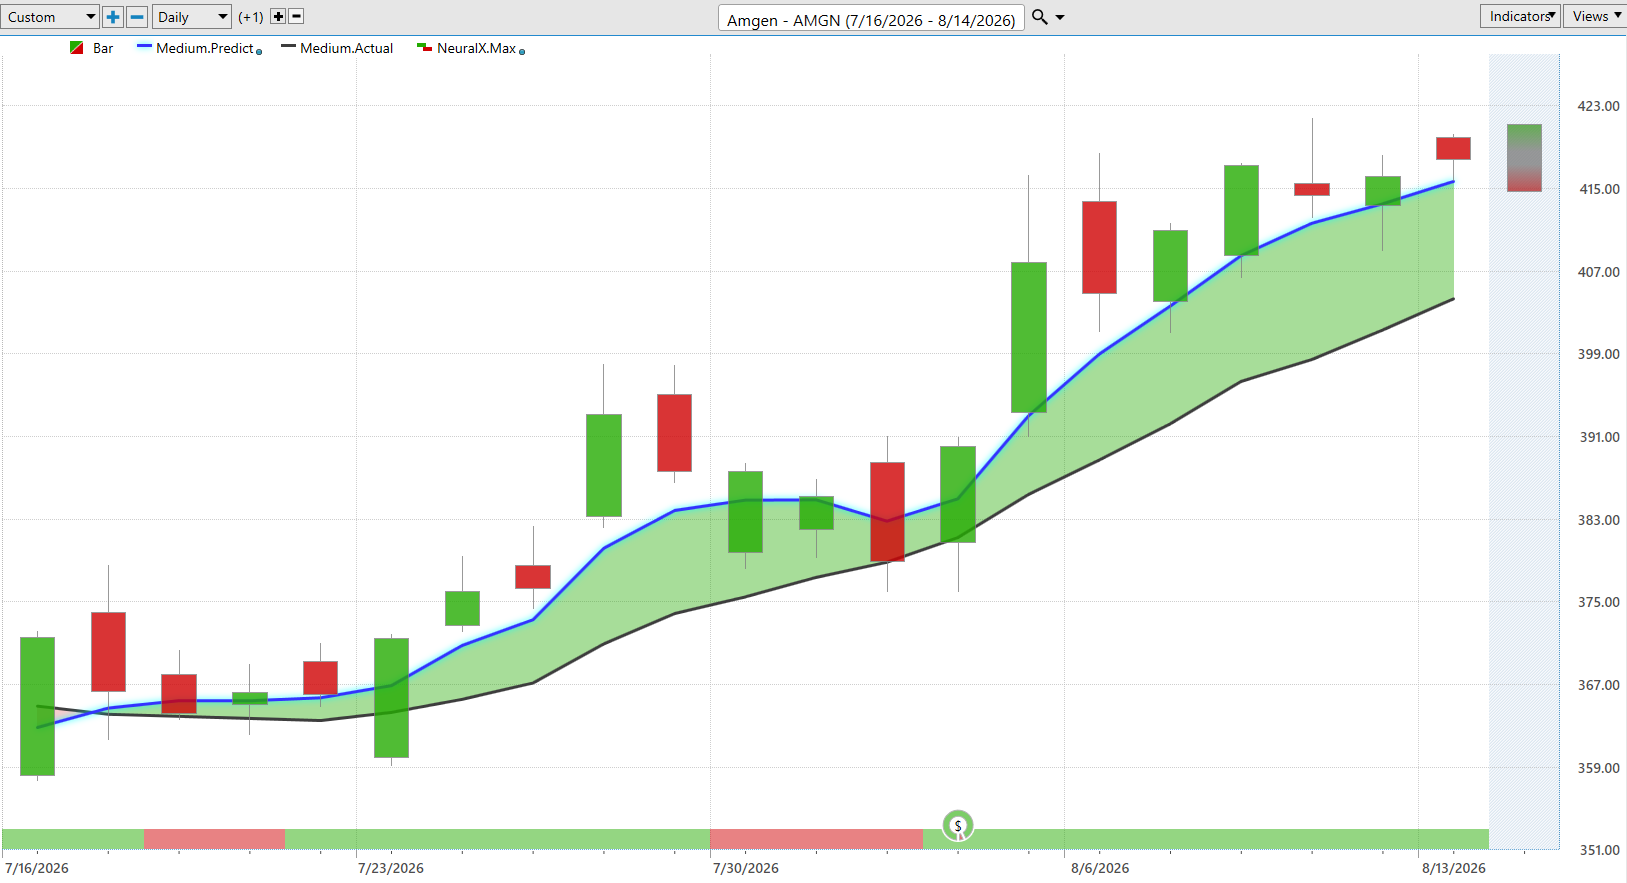
And so we have a really nice example of how all of these predictive tools work together on shares of Amgen. And once you understand one of the forecasts here for a single market, you can take that and apply that to any individual market you might want to trade.
And so what we’re looking at here is of course daily price action. So daily bars and candles. That means each one of those candles on the chart is going to represent a full and complete trading day. All of these predictive indicators work off of end-of-day data.
And so right up against all of those daily bars and candles, well, you’re going to notice that there is a black line and also a blue line value.
And so what that black line value is is actually a simple moving average. So this is a very common traditional technical analysis indicator. And what it does is it looks back at the previous 10 close prices, adds them all together and then divides by that number.
But obviously that simple mathematics is really just going to reconstruct things that have already occurred and therefore have no predictive capability on what is happening next.
And so what VantagePoint’s technology does is actually utilize a set of what’s called artificial neural networks to scan dozens of markets that are known to drive and influence future price.
So this can be things like individual stocks, ETF groups, things like the value of global currencies or global interest rates or even potentially global commodities where applicable.
And this is very important because all of this neural network information, all this data from all these intermarket relationships goes in to generate highly accurate predictive indicators. And that’s what you’re seeing with this blue line value on the chart here.
So whenever that blue line value, essentially a prediction of future prices, gets calculated and plotted on the chart, well this is telling us where prices are likely to move and we can really compare that to this lagging moving average and highlight some instances where we’re seeing a shift in the overall trend.
So whenever that blue line gets above the black line, well it’s suggesting that these average prices are going to start moving higher and traders could look to take a long or bullish position.
Now you see since that forecast came through, the market is up about 14% just over the past 20 trading days. But that’s not the entirety of these predictive tools and how traders can leverage this data and information.
Now, if you look at the very bottom of the chart here, you’re going to see this bar that can go from green to red and back to green. Well, this is what’s called the VantagePoint predictive neural index.
In the same way, it’s utilizing that intermarket data from all of those markets that are affecting and driving future prices, but this is tuned to solve a different problem, and that is just short-term strength over the next 48-hour window or a couple of candles as we look at the chart.
And so traders can really combine this information to understand not only the overall trend, but when there’s likely to be that short-term weakness within the uptrend.
Now you’ll notice that as the neural index goes bearish here, you see that you run sideways, actually get a gap down on the chart here, but overall that blue line is still above the black line, signaling that the overall trend is still bullish.
Even here, you see the neural index bullish and 48 hours later, that’s where we see that strength coming into the market. And that persistence of the neural index staying bullish, that’s where we see momentum.
And so traders can leverage this information to make better trading decisions and really be prepared for what’s likely to occur next in a particular market.
Now in this chart you see we have earnings right in the middle of the chart. But what VantagePoint also provides here is a predicted high and a predicted low. So we’re down to really intraday levels that the artificial neural networks are picking out and then forecasting before the next trading day.
So every evening at 6:00 p.m. you have these values available for that next trading day. And so when we look back and say, well, how accurate have all of those daily predictions been against the actual market data?
Well, you see here early on in the trend, it’s letting you know, hey, expect prices to trade down toward these predicted lows. You end up getting a gap down and immediately the market going higher again.
And here you see moving to predicted low the very next day even before any market trading had happened. It’s already telling you, look, expect the range to start moving lower here. And sure enough the market gaps down, closes right in the middle of that range, continually moves down towards these predicted lows.
But overall here the trend is very bullish. And you see about one, two, three, four, five, six, seven, eight opportunities or so within this uptrend to exploit this about 14 or 15% move just here over the month of August here. Just about a 14% rally over 19 trading days.
Netflix ($NFLX)
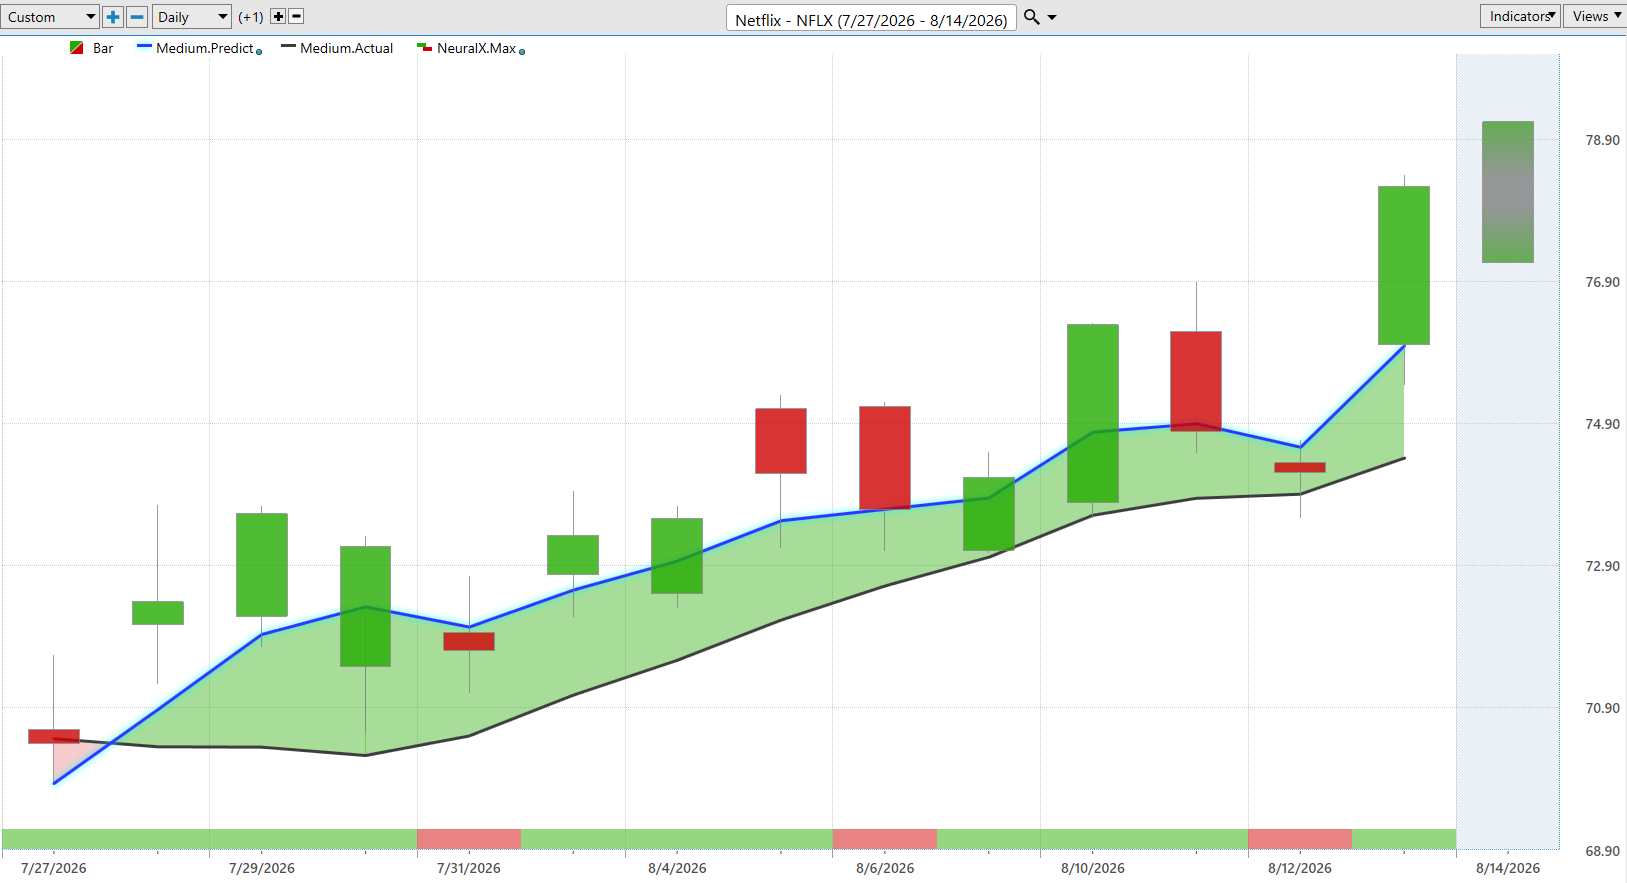
Now here’s shares of Netflix. Obviously a very popular stock and a very strong forecast here with that blue line getting above the black line.
And notice that there is a lot of separation here between that predicted moving average and the actual moving average. So that indicates that there is a strong trend forming here.
That information coming through really at the end of July going into August here. And of course, we have the benefit of those predicted highs and lows.
So as a trader who wants to say, okay, well, I want to buy Netflix. Where should I be looking to accumulate a position?
If you’re actually utilizing levels like these predicted lows, you’d actually would get filled at the open here on a gap down. And you see how this works out by just leveraging the information available.
There’s numerous entries here, about three, four, five, six, seven entries at the lower part of a weekly range before we start seeing the market break out and shares go higher.
Obviously here a lot of separation still between that predicted moving average and the actual. And so far seeing a pretty nice push here in prices about 9, almost 10%. We’ll see if that persists here going into Friday’s trading.
Enbridge ($ENB)
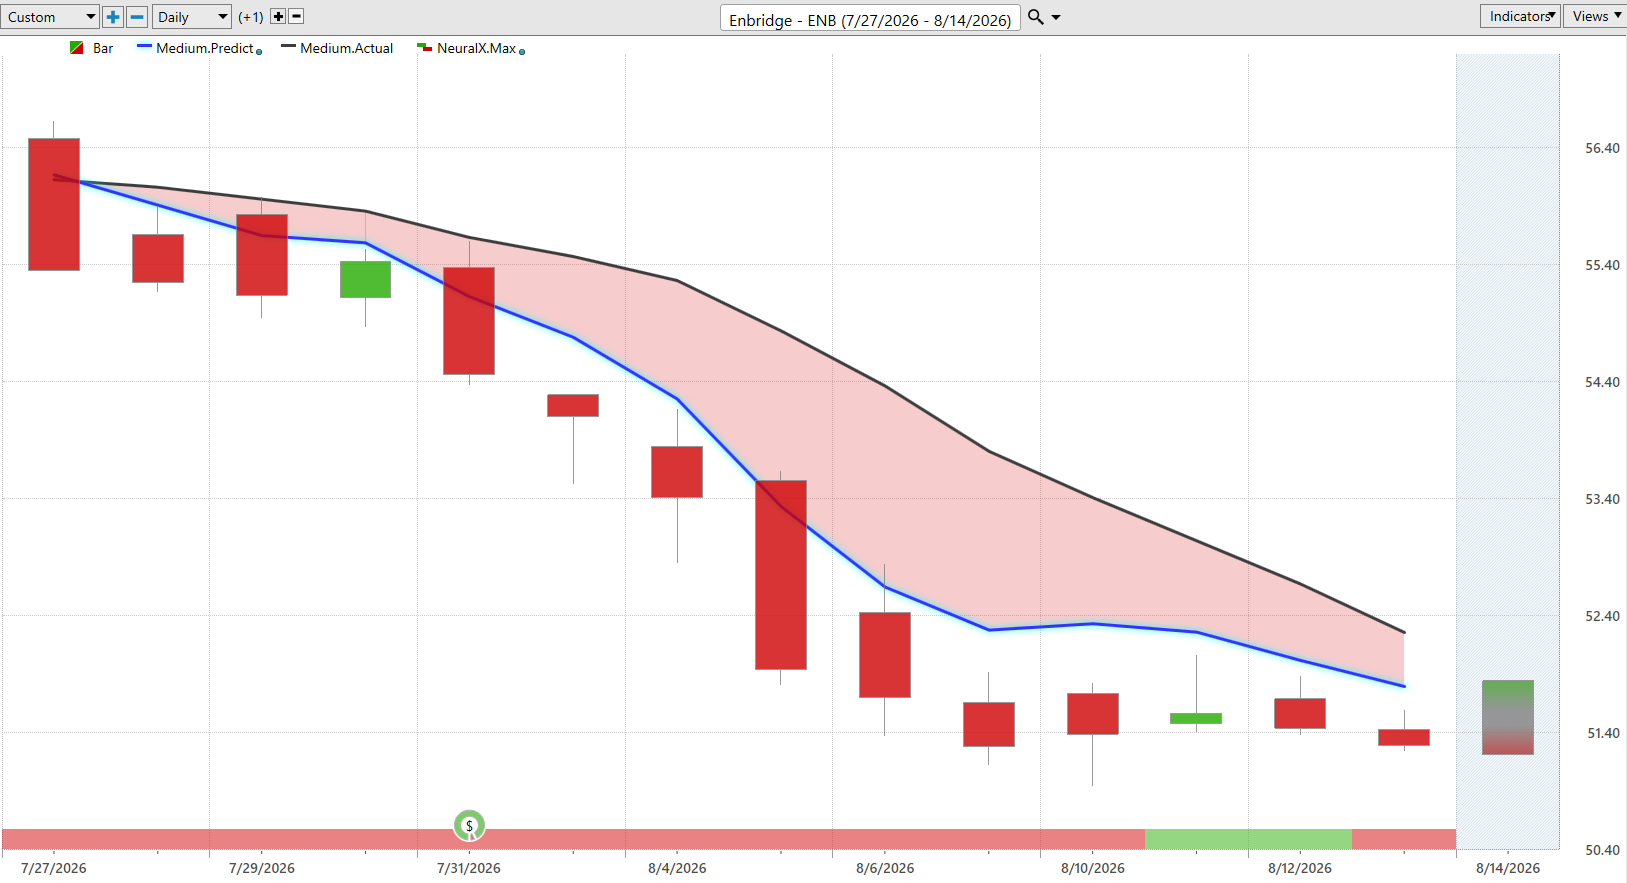
Now things aren’t always bullish, right? And this is where traders can really get ahead of weakness or essentially take profit on those long positions understanding when that uptrend is ending.
Here shares of Enbridge, you see this blue line below the black line leading into earnings here that just, you see the persistence and weakness of this trend.
But I wanted to highlight that as the neural index gets bullish here, notice that the price action settles out, right? So, where we had previously had a lot of bearish momentum, when that neural index gets bullish, well, it has a very high level of accuracy as far as you’re likely to see some short-term strength.
But very clearly here, the market is still in a very strong downtrend. So overall, you see the shares off about 8% so far.
But from day to day, you’re also getting those predicted levels that can assist traders in navigating a position. Really knowing where those prime entries are within the daily price action to exploit, in this case, the bearish movements in the market.
Abbot ($ABBT)
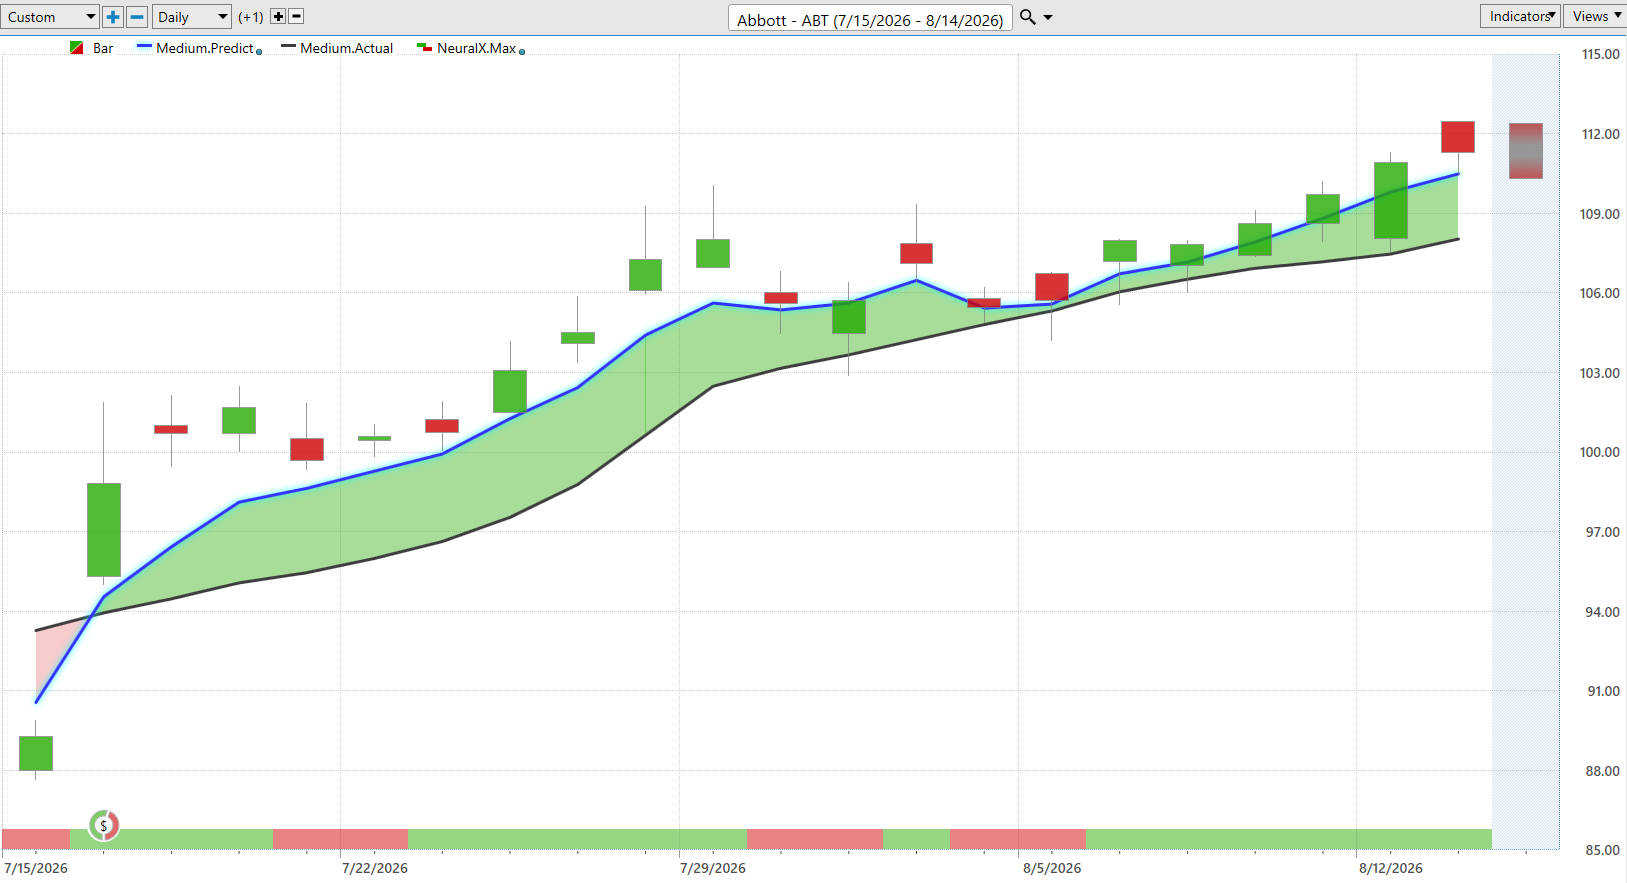
Now, here’s Abbott Labs. A lot of bullishness over in pharmaceutical space. Here’s Abbott with, or really after earnings here, right? The earnings really being the catalyst for this move higher.
And this is where VantagePoint has a huge edge in that every single evening, it’s taking in all of that information from those intermarkets that are affecting the future price action. And then it’s incorporating that into the subsequent forecast.
So it analyzes that, look, there’s been a big movement in price, there’s been a big gap up, it’s going to adjust all of these levels accordingly and then get those predicted ranges, those predicted highs and lows back on track for you as a trader so that you can keep managing that position.
So you see here even after this big move up in earnings what’s saying, look, couple days later that’s really that prime entry point down at the predicted low.
You see some days here moving down towards the predicted low and within that 48-hour period moving and consistently moving higher in this uptrend.
So even just this past week would have been a gap down here and then a gap up for about 4% just over a couple of trading days.
Boston Scientific ($BSX)
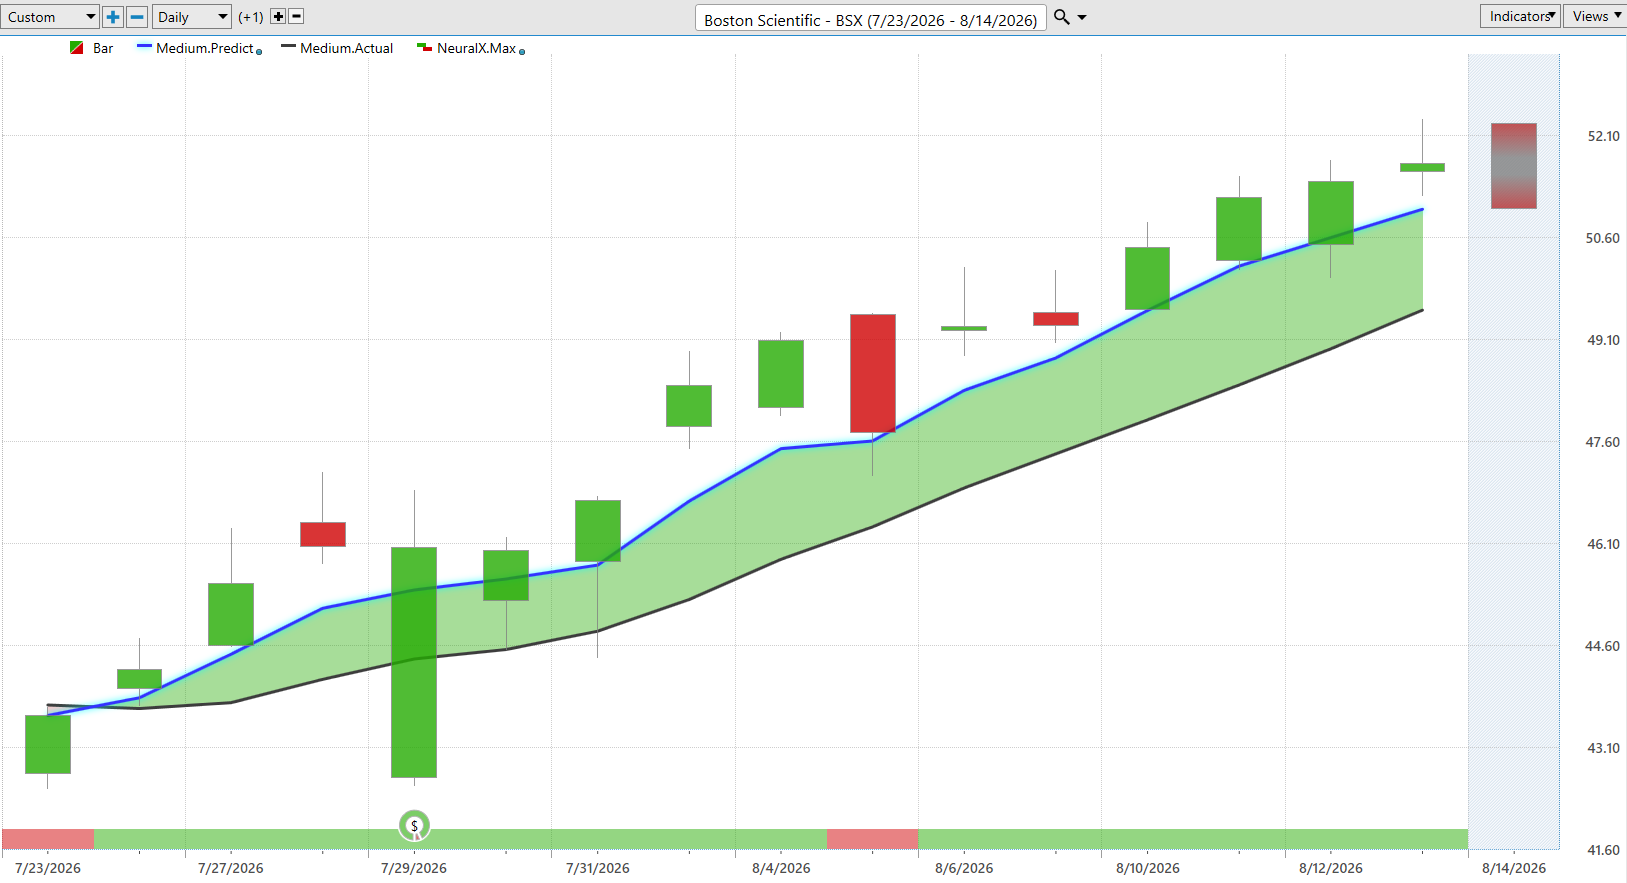
Here’s Boston Scientific. The same thing. A lot of noise here around earnings, but very clearly the blue line above the black line.
You’ll notice the neural index goes bearish here and the market just sort of runs sideways these next couple of trade days. Had a gap up, but there’s, you know, selling pressure in the market.
But as we look at the most recent neural index forecast, well, that 48-hour forecast is letting you know that expect some strength here. The trend is very bullish.
And of course, you have these predicted highs and predicted lows. So again here getting through that kind of ill liquidity around earnings. It’s something you want to really take note of is when those earnings reports are coming up.
But notice how quickly it lets you know, look, expect the range to expand here. Try to buy down towards these predicted lows and again numerous entries here week to week getting into the lower part of the range and exploiting that uptrend to the bullish side here.
So pretty nice trend here in shares of Boston Scientific, up about 17%.
NetApp ($NTAP)
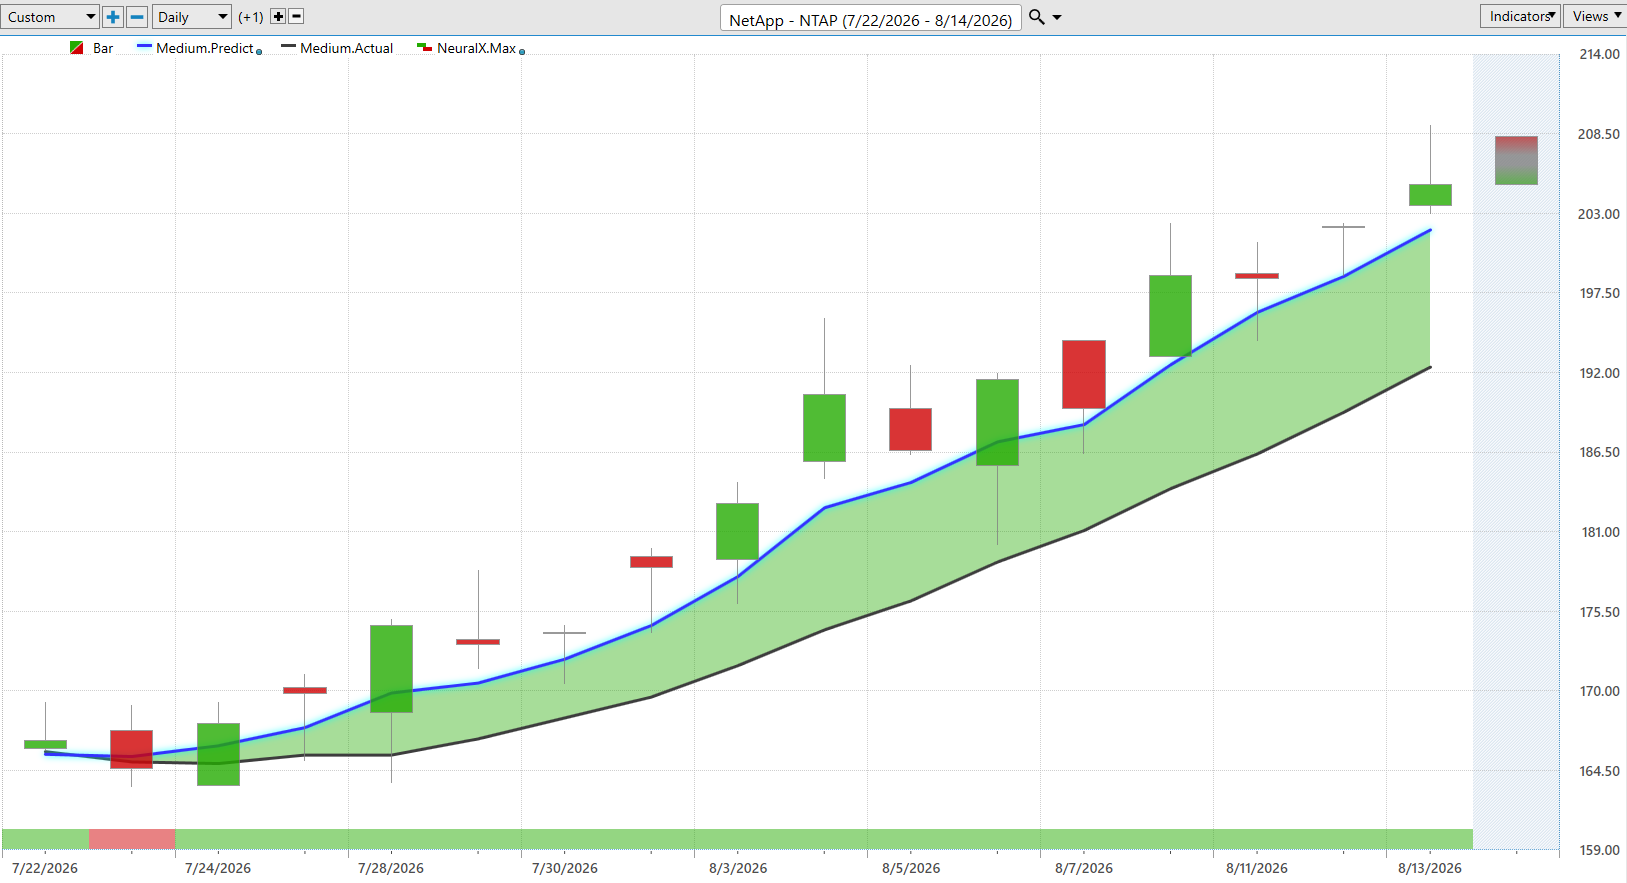
And lastly here we have NetApp, to the tech space. Seeing some names do fairly well here. Blue line above the black line.
And I actually wanted to bring this through because notice that neural index is bearish, right? So it’s letting you know expect weakness. You actually get a gap down the next trading day.
Notice these next couple of trading days over the next 48 hours. There’s certainly that selling pressure, right? So 48 hours later, you’re getting selling pressure, but by the end of the day, 48 hours after that neural index gets bullish, you see the trend resuming. The market going higher.
And of course every single day being provided those predicted highs and lows before the next trading day.
So this is very important to understand is what’s going to happen here is we’re going to get the actual price action filling in but those predictions will stay static.
And so this is why we can look back and say, well, how accurate are all of these levels before the actual trading day here?
And you see again how this makes adjustments day-to-day, letting you know where market prices are likely to trade so that as a trader, you can make those more intelligent decisions based off of predictive indicators.
Not just traditional technical analysis. It’s constantly going to lag behind the market and really have no highly accurate predictive edge here.
So, about a 24% rally in 16 trading days. Really exciting stuff in many areas of the stock market.
So, we’ll go ahead and leave it there for today, but once again, this has been the Hot Stocks Outlook for August 14th, 2026.
Thank you all for watching. Best of luck out there, and bye for now.