


In the dynamic world of financial markets, volatility reigns supreme, dictating the ebb and flow of prices with a force that can exhilarate or intimidate even the most seasoned traders. At the heart of understanding this mercurial force lies the $VIX or Volatility Index, a powerful index often referred to as the “fear gauge” of Wall Street. For new traders stepping into this arena, grasping the nuances of volatility and its relationship with the $VIX is akin to unlocking the secrets of a formidable puzzle. In this article, we embark on a journey of discovery, decoding the essential concepts surrounding volatility and unraveling the mysteries of the $VIX, providing insights that will empower traders in navigating the tumultuous waters of the financial markets.
Understanding the VIX is essential for new traders as it provides insight into market sentiment and potential price movements. This introduction aims to demystify the VIX and emphasize the importance of understanding volatility for traders.
In the realm of volatility assessment, we encounter two primary methodologies. The first method hinges on historical volatility, wherein statistical analyses are conducted on past prices within a defined timeframe. This entails crunching numbers to derive statistical parameters such as mean (or average), variance, and ultimately, the standard deviation across historical price datasets.
Now, the second approach, which the VIX capitalizes on, takes a different route by gauging its value through implied volatility inferred from options prices. Options, my friends, are derivative instruments whose valuation is contingent upon the likelihood of a stock’s current price making a significant move to hit a specific level, dubbed the strike price or exercise price. It’s a fascinating dance of probabilities intertwined with market sentiment, offering traders unique insights into potential future movements.
The VIX Index was introduced by the Chicago Board Options Exchange (CBOE) in 1993. It measures the stock market’s expectation of volatility based on options prices of the S&P 500 index for the next 30 days. The index is calculated in real-time and is a vital indicator of investor sentiment and market volatility.
What exactly does the VIX measure? In essence, it reflects the market’s forecast of near-term volatility, derived from the price inputs of S&P 500 index options. It’s a forward-looking tool, calculated in real-time throughout the trading day, projecting a 30-day forward projection of volatility. By analyzing the range of price movements implied by these options, the VIX provides a quantifiable expectation of volatility that is immediately actionable for financial strategies.
Understanding the VIX is not just about knowing its current value; it’s about interpreting what that value implies about broader market conditions. A high VIX reading, typically above 30, signals increased investor anxiety, suggesting that significant market swings are expected. On the other hand, a low VIX, usually under 20, indicates a period of relative calm, with less expected movement in the S&P 500 index. These readings are vital for formulating both short-term trading and long-term investment strategies, as they directly reflect the pulse of market sentiment.
Moreover, the development and ongoing refinement of the VIX have paved the way for the creation of various financial products, including futures and options based on the VIX itself, allowing investors to hedge against volatility or to speculate on future changes in market conditions directly. These instruments have become fundamental components of modern financial portfolios, utilized extensively by institutional investors and hedge funds for risk management and speculative purposes.
The $VIX is expressed in percentage points and, unlike most traditional indices that measure price levels, the VIX measures the market’s expectation of future volatility. When the VIX value rises, it indicates that traders expect the S&P 500 Index to fluctuate more sharply in the near term, suggesting uncertainty and risk. Conversely, a lower VIX value signals confidence and a stable market expectation.
What is crucial to understand is that LOW VOLATILITY BEGETS HIGH VOLATILITY and vice versa. HIGH VOLATILTY BEGETS LOW VOLATILITY.
A weather analogy is in order. Imagine you live in a sunny area, and it is 120 degrees outside. The all-time record high temperature is 121 degrees. Even though it is crazy hot outside, the probabilities indicate that with temperatures testing all time highs, it should start getting cooler however gradual it might occur.
The VIX is significant because it is one of the best measures of overall market volatility. Traders and investors watch the VIX closely to help manage their portfolios and to gauge when to enter or exit trades. It acts as a barometer for risk, stress, and fear in the market. For example, during periods of high volatility, such as a financial crisis or geopolitical uncertainty, the VIX tends to spike.
This index is also pivotal for derivative and risk management. Options traders rely on the VIX to help set prices on options contracts. It is also utilized in the creation of various volatility-based financial instruments, including futures and options on the VIX itself, which are traded to hedge against volatility or to take speculative positions based on predicted changes in market conditions.
For new traders, understanding volatility is fundamental to developing effective trading strategies. Volatility can affect asset prices, portfolio returns, and the risks associated with different investment options. By understanding and monitoring the VIX, traders can get a sense of the likely volatility in the market and adjust their trading strategies accordingly.
The $VIX is used as a gauge to assist in the following areas:
**Risk Management**: Knowing the level of expected volatility helps traders manage their risk more effectively. Higher volatility means higher risk, which can affect decisions on position sizing and stop-loss settings.
**Strategic Entries and Exits**: Volatility can provide opportunities for quick profits as well as significant losses. Traders can use volatility indicators like the VIX to time their entry and exit from the market, aiming to maximize gains and minimize losses.
**Portfolio Diversification**: Understanding market volatility helps in constructing a diversified portfolio that can withstand unexpected market movements. A keen awareness of volatility can guide new traders in selecting the right mix of assets to balance risk and return.
**Sentiment Analysis**: The VIX also offers insights into market sentiment. A rising VIX could indicate fear and a potential sell-off, while a declining VIX suggests confidence and a bullish market trend. Traders can use these cues to gauge general market trends and align their trades with market sentiment.
Real world application lies in understanding what the $VIX is saying. For example, currently the $VIX is 14.10%. This implies that the expected annualized volatility of the S&P 500 index is 14.10%. This means that over the next 30 days, the market expects the S&P 500 to move (up or down) by about 14.15% implied volatility over the course of a year, if the level of volatility remains constant. The calculation is based on a standard deviation measure, which reflects the dispersion or variability of returns around the mean, giving investors an expectation of the range within which the index is likely to operate within the specified time frame.
Statistics help us make sense of data by organizing, analyzing, and interpreting it, allowing us to uncover patterns, trends, and relationships within the information. Ultimately, statistics enable us to make informed decisions, predictions, and conclusions based on empirical evidence.
Imagine you have a class full of students, and you’re curious about their heights. Now, if you graphed all their heights on a chart, you’d probably notice something interesting: most students are about average height, right in the middle. That’s what we call the “mean.” Now, if you looked at all the heights on the graph, you’d see a pattern that looks like a bell, with most of the students’ heights clustered around the mean. Here’s where it gets cool: if you measure how far away most students’ heights are from the average, you’ll find that about 68% of them fall within one standard measurement on either side of the mean. This is referred to as the standard deviation.
If you go two standard measurements out, you’ll capture around 95% of the students’ heights, and if you stretch it to three standard measurements, you’ll cover about 99.7% of the heights. So, this “bell curve” helps us understand how things are spread out around the average, with most of them being close, and only a few outliers being really tall or really short. It’s like nature’s way of keeping things organized!
Let’s illustrate with the S&P 500 at a hypothetical price of $100 and a VIX reading of 15%.
With a VIX of 15%, the expected annualized volatility is 15%. This implies that over the next year, the price of the S&P 500 is expected to fluctuate within a range of plus or minus 15% from its current level with a 68% probability, under normal market conditions.
– **One Standard Deviation (68% Probability) **
– Upper Range: (100 + 15% times 100 = $115)
– Lower Range: (100 – 15% times 100 = $85)
So, with a 68% probability, the price of the S&P 500 would be expected to be between $85 and $115 over the next year. It is always important to understand and remember that the $VIX does not measure trend direction. Instead, it measures anticipated motion of the range. Traditionally when the $VIX is low it is conducive toward optimistic and rising trends. Also, when the $VIX is high the prevailing tendency is that anxiety exists, and it affects the trend negatively.
Extending To Two Standard Deviations (95% Probability): the expected trading range over the next 12 months should be confined to $130 on the upside and $70 on the downside. This assumes a starting point of $100.
– Upper Range: (100 + 30% times 100 = $130)
– Lower Range: (100 – 30% times 100 = $70)
Extending to Three Standard Deviations (99.7% Probability) the expected trading range over the next 12 months should be confined to $145 on the upside and $55 on the downside.
– Upper Range: (100 + 45% times 100 = $145)
– Lower Range: (100 – 45% times 100 = $55)
These ranges illustrate where the price could potentially lie over the next year based on different levels of probability, as implied by the current VIX level. It’s important to remember that these are not forecasts of where the price will be, but rather an estimation of volatility and potential range of movement based on current option pricing.
The implications of VIX values can vary over different time scales:
Daily: On a day-to-day basis, a sudden spike in the VIX indicates a rise in trader anxiety, often triggered by unexpected news or events affecting the financial markets.

Weekly: Over a week, changes in the VIX can indicate shifts in market sentiment, possibly reflecting broader economic or political news.
When we look at the $VIX on a weekly basis this is what the chart looks like:
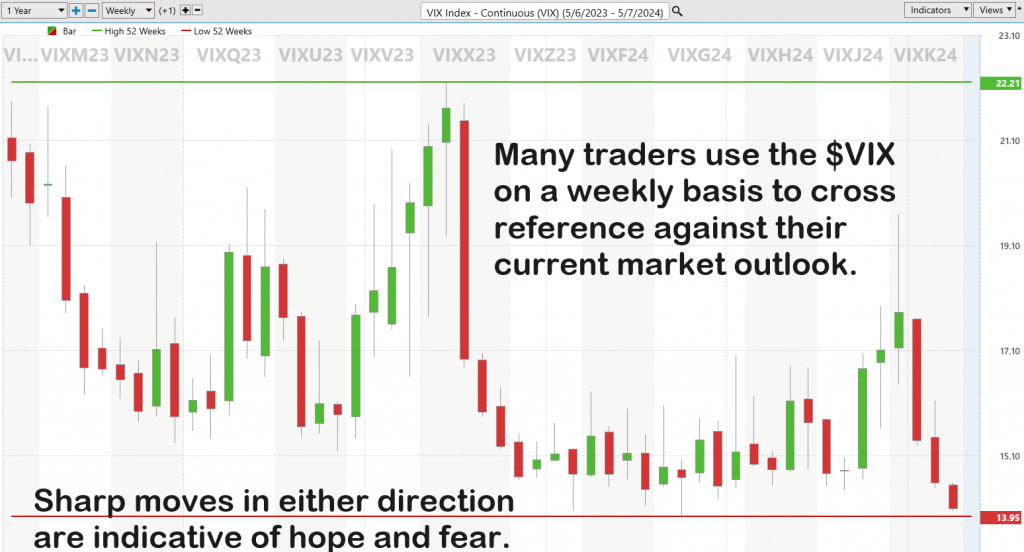
Monthly: On a monthly view, a consistently high VIX could suggest ongoing uncertainty or instability in the markets, whereas a low VIX suggests stability and less concern about large market moves.
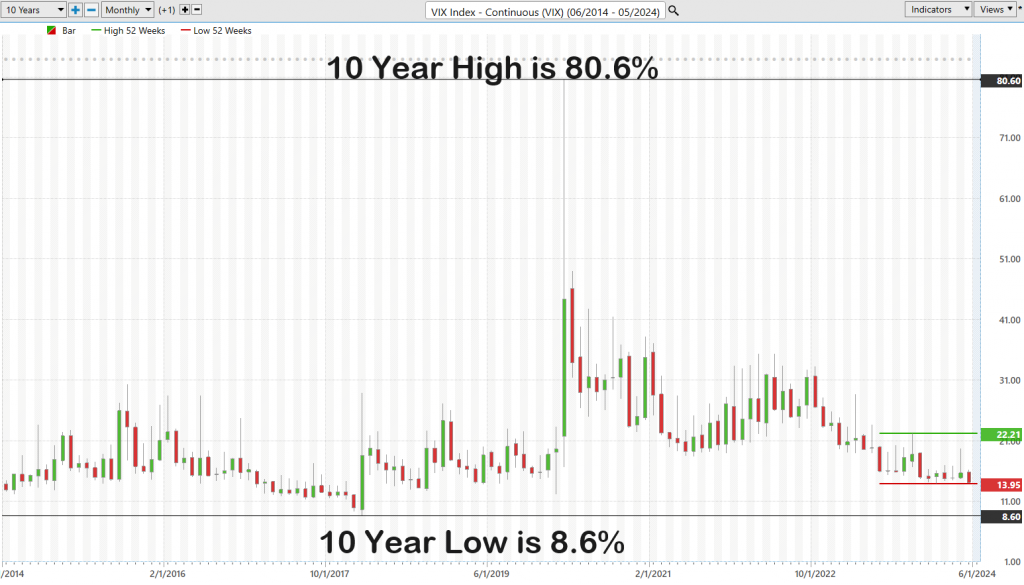
Over longer periods like a year, the average level of the VIX can reflect the overall climate of market volatility. For instance, periods of prolonged low VIX values have often coincided with bullish market trends, while higher averages are linked to bearish or turbulent times.
The reason you want to pay attention to the VIX as a trader is that it helps us better understand what the word “normal” means in the financial markets. Normal is always a moving target and to accurately define it we need to appreciate historic context.
Volatility is a key factor that influences the pricing of stock and index options, especially impacting the cost of premiums. For those new to trading, understanding the Volatility Index ($VIX) is crucial. Essentially, it helps predict how wild or calm the markets might be.
When the VIX is high, it indicates that traders expect significant market movements. This uncertainty drives up the cost of options, making premiums more expensive. On the flip side, when the VIX is low, it suggests a more stable market outlook, leading to lower prices for options and cheaper premiums. This direct relationship between the VIX and option pricing is vital for traders to grasp as it significantly affects investment strategies.
In simpler terms, think of the trading environment as a seesaw. In calm periods, when market volatility is low, buying options is generally cheaper. This situation favors option buyers because they can secure rights to buy or sell stocks at potentially profitable prices without spending a lot. However, when the market starts expecting bigger swings (a high VIX), the cost to buy these options goes up.
For those holding options to sell (option sellers), a high VIX is good news. It means they can charge more for the options they sell, capitalizing on the fear and uncertainty of others. Essentially, high volatility increases the price others are willing to pay to protect themselves against unexpected market movements.
This back-and-forth dynamic is crucial for new traders to understand. It highlights how market sentiment, reflected through the VIX, can shift the balance between buying and selling options. As you monitor the VIX and learn from market trends, you’ll better understand when it might be advantageous to buy or sell options based on expected market volatility.
Currently the $VIX level of 14.10% indicates that this is testing its 52-week lows. Meaning option premium is less expensive than it has been historically.
The VIX Rule of 16, applied to the $VIX and the S&P 500, rests on the premise that volatility, as measured by the $VIX, inversely correlates with the stability of the S&P 500. The rationale is rooted in statistical principles: with 252 trading days in a year, the square root of 252 is approximately 16. Thus, dividing the current $VIX level by 16 provides an estimate of the expected daily percentage move of the S&P 500. For instance, if the $VIX stands at 20, dividing it by 16 suggests a projected daily trading range of around 1.25% in the S&P 500.
Traders often leverage this theory to inform their decision-making process, particularly when trading zero-day credit spread options expirations in the S&P 500 Index. In this strategy, traders sell options contracts with a very short time until expiration, aiming to profit from time decay and stable market conditions. By utilizing the $VIX Rule of 16, traders gauge the expected magnitude of daily price fluctuations in the S&P 500, helping them assess the potential risk and reward of their options positions.
For example, if a trader expects the S&P 500 to remain relatively stable based on a low $VIX reading, they might choose to sell credit spreads with strike prices positioned outside of the expected daily range calculated using the Rule of 16. This allows them to collect premium from the options sold, banking on the likelihood that the underlying index will not breach the chosen strike prices before expiration. However, traders must exercise caution and consider other market factors beyond just the $VIX, as unexpected events or shifts in sentiment can lead to deviations from the expected range and impact the profitability of their options positions.
It is always important to remember that the $VIX does not forecast trend direction, it simply measures motion, and its value communicates the anticipation of future motion.
Low VIX Levels (VIX below 15)
A low VIX indicates low expected volatility, suggesting stability and complacency in the market. Historically, when the VIX is below 15, it reflects a bullish sentiment where investors are generally optimistic and risk tolerance is high. Markets may continue to trend upwards or remain stable during such periods.
Moderate VIX Levels (VIX between 15 and 20)
Moderate VIX readings suggest a normal market condition with average volatility. This level is often seen during periods of balanced market sentiment where there is neither too much optimism nor excessive pessimism. Traders might expect regular market fluctuations without significant surprises.
Elevated VIX Levels (VIX between 20 and 30)
When the VIX rises above 20 but stays below 30, it indicates increased uncertainty or mild fear among investors. This could be triggered by specific economic events, political instability, or upcoming financial data that might impact the markets. It suggests that traders are expecting bigger swings in market prices and might start taking protective measures.
High VIX Levels (VIX above 30)
A VIX level above 30 is considered high and usually signals significant market fear and volatility. Such spikes often occur around major economic crises, global events, or financial crashes. High VIX levels indicate that investors are very nervous, leading to potentially rapid and large market moves.
The Chicago Board Options Exchange (CBOE) transformed volatility into a tradable commodity with the inception of VIX-linked derivatives, launching the first exchange-traded futures based on the VIX in March 2004 and expanding into options in February 2006. These instruments offer investors direct exposure to volatility, thereby establishing a novel asset class.
Active traders, large institutional entities, and hedge funds utilize these VIX-linked securities to diversify portfolios. Historical trends have consistently shown a strong inverse relationship between market returns and volatility—typically, as stock returns diminish, volatility ascends, and conversely.
Unlike typical indices, direct investment in the VIX isn’t possible. Investors looking to engage with the VIX do so through derivatives like futures and options, or via VIX-related exchange-traded products (ETPs). Notable examples include the ProShares VIX Short-Term Futures ETF (VIXY) and the iPath Series B S&P 500 VIX Short-Term Futures ETN (VXXB), both of which track variants of the VIX index and engage in corresponding futures contracts.
Building on the VIX’s success, the CBOE has since rolled out a variety of volatility measures tailored to different market conditions and time frames. This includes the CBOE Short-Term Volatility Index (VIX9D), which forecasts the nine-day expected volatility of the S&P 500, as well as the three-month (VIX3M) and six-month (VIX6M) variants. Furthermore, volatility indices for other major benchmarks such as the Nasdaq-100 Volatility Index (VXN), the CBOE DJIA Volatility Index (VXD), and the CBOE Russell 2000 Volatility Index (RVX) cater to a diverse range of market participants looking to hedge, speculate, or simply gain insights into different segments of the market.
For new traders, the VIX is more than just a number—it is a guide to understanding market dynamics and managing investment risk. By grasping the significance of the VIX and the role of volatility in financial markets, traders can enhance their decision-making processes, improve their risk management, and potentially increase their profitability in the ever-changing landscape of the financial markets. As you continue your journey in trading, keep a close eye on the VIX, for it holds the key to navigating the complexities of market volatility. In summary, the VIX is more than just a barometer of fear and complacency; it is a sophisticated analytical tool that captures the essence of market sentiment and helps investors navigate through the tumultuous seas of stock market volatility. As we look toward an increasingly uncertain future, understanding the signals conveyed by the VIX is more crucial than ever.
In summary, a rising Volatility Index (VIX) generally signals increasing investor anxiety, suggesting expectations of higher volatility in the S&P 500. Typically, this rise correlates with a bearish outlook for the stock market, as a higher VIX often precedes declines in the S&P 500, reflecting the market’s anticipation of riskier trading conditions ahead.
Conversely, when the VIX falls, it usually indicates a calmer, more stable market environment, which tends to align with bullish sentiment in the S&P 500. This lower VIX suggests that investors are expecting less volatility, often accompanying periods of rising stock prices. Thus, the relationship between the VIX and the S&P 500 is inversely related, with the VIX acting as a fear gauge for the broader market.
Traders who overlook the Volatility Index (VIX) and its indications expose themselves to significant risks, potentially missing critical signals about prevailing market conditions. The VIX, often referred to as the market’s “fear gauge,” offers vital insights into expected volatility and investor sentiment. Ignoring its movements can lead to misjudging the market’s mood and volatility levels, resulting in ill-timed trades that are out of sync with broader market dynamics. It is worthwhile noting that historically the average $VIX reading is around 21.
For instance, a rising VIX signals heightened market anxiety and could forewarn of a potential downturn, suggesting that traders might need to adopt more defensive strategies, such as hedging or reducing position sizes. Conversely, a low VIX indicates stability and confidence, conditions under which traders might more safely pursue aggressive growth strategies. By not monitoring these fluctuations, traders may either take on excessive risk during turbulent times or miss out on growth opportunities during calmer periods.
Ultimately, the consequence of ignoring the VIX is trading based on incomplete information, leading to decisions that may not adequately reflect the market’s risk-reward profile. This can result in greater losses during market volatility and missed opportunities when the market is poised for growth. Thus, understanding and integrating VIX readings into trading strategies is essential for aligning with market realities and enhancing overall trading performance.
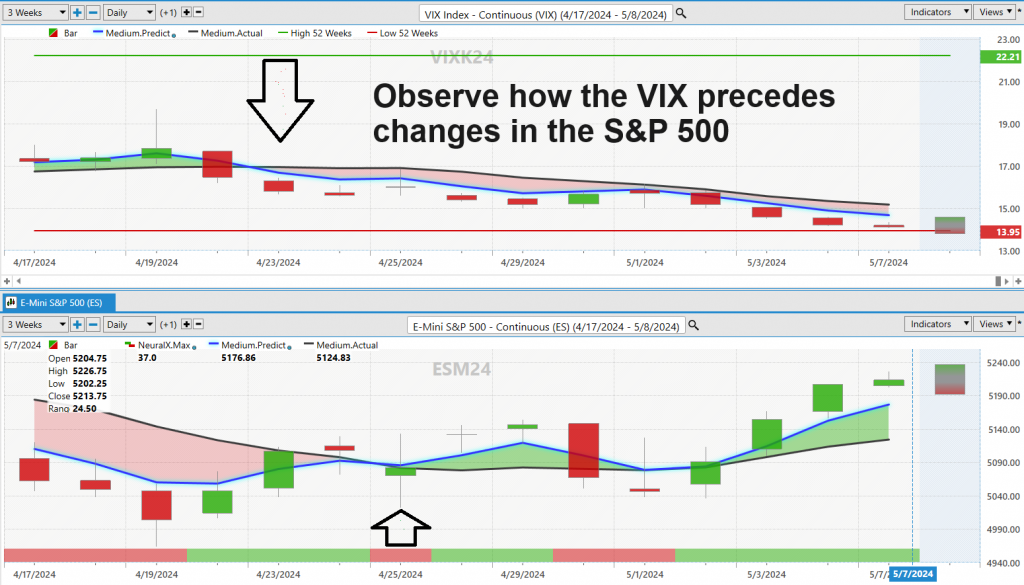
The good news is that this is where the VantagePoint A.I. software shines. Look at the chart below of the VIX transposed above the $S&P 500 over the past few weeks. Observe how the $VIX turned lower indicating greater optimism. Since that trend change the S&P 500 has rallied as much as 2.37%.
The adage “When the VIX is high, it’s time to buy. When the VIX is low, look out below!” encapsulates a fundamental strategy for investors navigating the volatility of the stock market.
This mantra underscores the counterintuitive approach of seeing high volatility, often associated with market fear and uncertainty, as a potential buying opportunity—suggesting that the market may be undervalued or nearing a bottom. Conversely, a low VIX, which might indicate complacency among investors, often signals overvaluation and the potential for a market pullback.
VantagePoint A.I. Power Traders are very aware of the dangers of a low $VIX value. Study the long-term charts of the $VIX and you will appreciate the saying that LOW VOLATILITY BEGETS HIGH VOLATILITY and VICE VERSA.
By internalizing this wisdom, investors are reminded of the importance of remaining vigilant and responsive to shifts in market sentiment as signaled by the VIX. This approach not only helps in capitalizing on volatility but also in safeguarding investments by anticipating and reacting to potential market downturns before they unfold.
Imagine a future where you not only survive economic turbulence but thrive through it. This is not just a dream—it’s a real possibility with the aid of our cutting-edge Artificial Intelligence (A.I.) trading software. Crafted with exacting precision, our AI trading software is designed with a singular focus: to position you advantageously in the market, enabling the most informed, timely, and profitable trading decisions. After all the purpose of artificial intelligence in trading is to always keep you on the right side, of the right trend at the right time.
This transformative technology is now within your reach, ready to empower you to seize control of your financial destiny. In times of inflation and economic uncertainty, don’t let your hard-earned savings dwindle. Join the ranks of savvy investors who are harnessing the power of A.I. to achieve superior financial returns.
Embrace the power of A.I. to improve your market selection, timing and profitability with a technology that learns continuously from its past performance to not only avoid repeating mistakes but also to refine and perfect its strategies moving forward. This isn’t merely about dodging pitfalls; it’s about proactively discovering and executing the most effective trading strategies in real time.
Intrigued? You should be. A.I. trading software is revolutionizing the world of trading, much like it has already transformed competitive fields such as Poker, Chess, Jeopardy, and Go. If A.I. can outsmart humans in these complex games, just imagine the edge it can give your trading strategies.
You are cordially invited to an exclusive online Master Class: “Learn How To Trade With Artificial Intelligence.” This groundbreaking session is lead by experts in ai trading and will show you how A.I. can become your most trusted ally in understanding market trends and minimizing risk.
Step into a new era of trading with the sophisticated analysis only A.I. can offer. With A.I., you gain access to a higher realm of probability and more informed trading decisions—decisions based on actionable intelligence that can fundamentally redefine your approach to finance. Don’t just wait for the economic landscape to shift in your favor. Take command now with A.I.-driven trading tools.
Join us for a FREE Live Training.
It’s Machine Learning.
Let’s Be Careful Out There!
THERE IS A SUBSTANTIAL RISK OF LOSS ASSOCIATED WITH TRADING. ONLY RISK CAPITAL SHOULD BE USED TO TRADE. TRADING STOCKS, FUTURES, OPTIONS, FOREX, AND ETFs IS NOT SUITABLE FOR EVERYONE.IMPORTANT NOTICE!
DISCLAIMER: STOCKS, FUTURES, OPTIONS, ETFs AND CURRENCY TRADING ALL HAVE LARGE POTENTIAL REWARDS, BUT THEY ALSO HAVE LARGE POTENTIAL RISK. YOU MUST BE AWARE OF THE RISKS AND BE WILLING TO ACCEPT THEM IN ORDER TO INVEST IN THESE MARKETS. DON’T TRADE WITH MONEY YOU CAN’T AFFORD TO LOSE. THIS ARTICLE AND WEBSITE IS NEITHER A SOLICITATION NOR AN OFFER TO BUY/SELL FUTURES, OPTIONS, STOCKS, OR CURRENCIES. NO REPRESENTATION IS BEING MADE THAT ANY ACCOUNT WILL OR IS LIKELY TO ACHIEVE PROFITS OR LOSSES SIMILAR TO THOSE DISCUSSED ON THIS ARTICLE OR WEBSITE. THE PAST PERFORMANCE OF ANY TRADING SYSTEM OR METHODOLOGY IS NOT NECESSARILY INDICATIVE OF FUTURE RESULTS. CFTC RULE 4.41 – HYPOTHETICAL OR SIMULATED PERFORMANCE RESULTS HAVE CERTAIN LIMITATIONS. UNLIKE AN ACTUAL PERFORMANCE RECORD, SIMULATED RESULTS DO NOT REPRESENT ACTUAL TRADING. ALSO, SINCE THE TRADES HAVE NOT BEEN EXECUTED, THE RESULTS MAY HAVE UNDER-OR-OVER COMPENSATED FOR THE IMPACT, IF ANY, OF CERTAIN MARKET FACTORS, SUCH AS LACK OF LIQUIDITY. SIMULATED TRADING PROGRAMS IN GENERAL ARE ALSO SUBJECT TO THE FACT THAT THEY ARE DESIGNED WITH THE BENEFIT OF HINDSIGHT. NO REPRESENTATION IS BEING MADE THAT ANY ACCOUNT WILL OR IS LIKELY TO ACHIEVE PROFIT OR LOSSES SIMILAR TO THOSE SHOWN.


