



Over the past month, American Express ($AXP) has gained 7% while the S&P 500 has advanced just 1%. That’s a 6% performance advantage in only one month. Moves like that don’t guarantee anything, but they do earn a stock a place on the watchlist. Relative strength has a way of revealing where institutional money is quietly accumulating before the broader market notices.
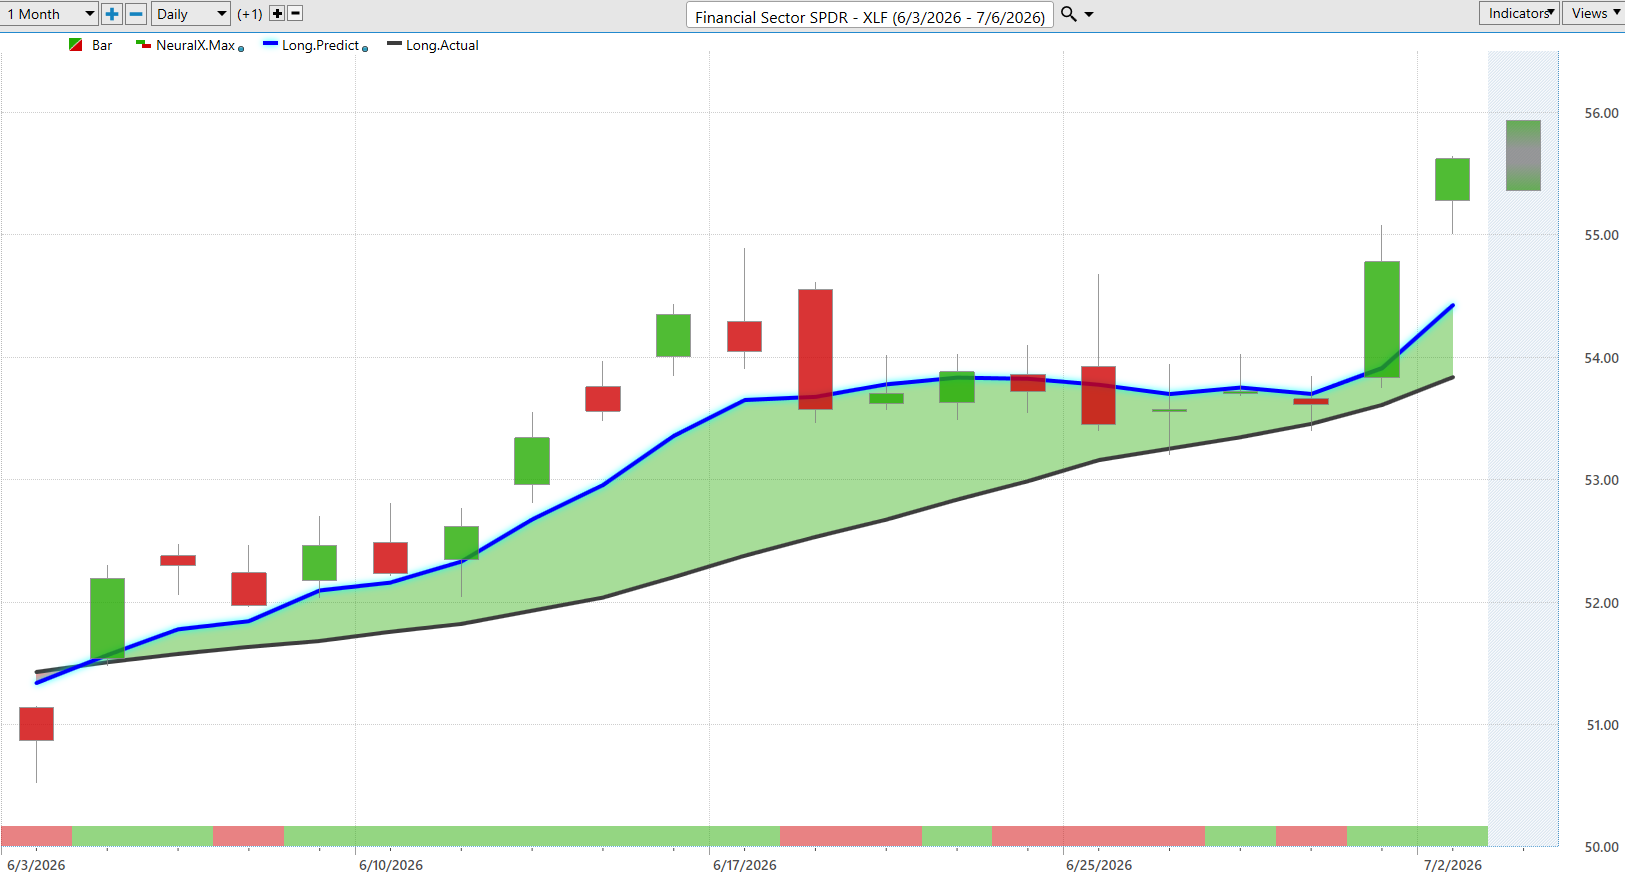
The backdrop makes the story even more compelling. While AXP has lagged many of the major indexes over longer time frames, something important has changed beneath the surface. The Financial sector itself has regained leadership, with XLF trending steadily higher throughout the past month, supported by rising predictive indicators and strengthening price action. When the sector is attracting capital and one of its premier companies begins outperforming its peers, professional traders pay attention.
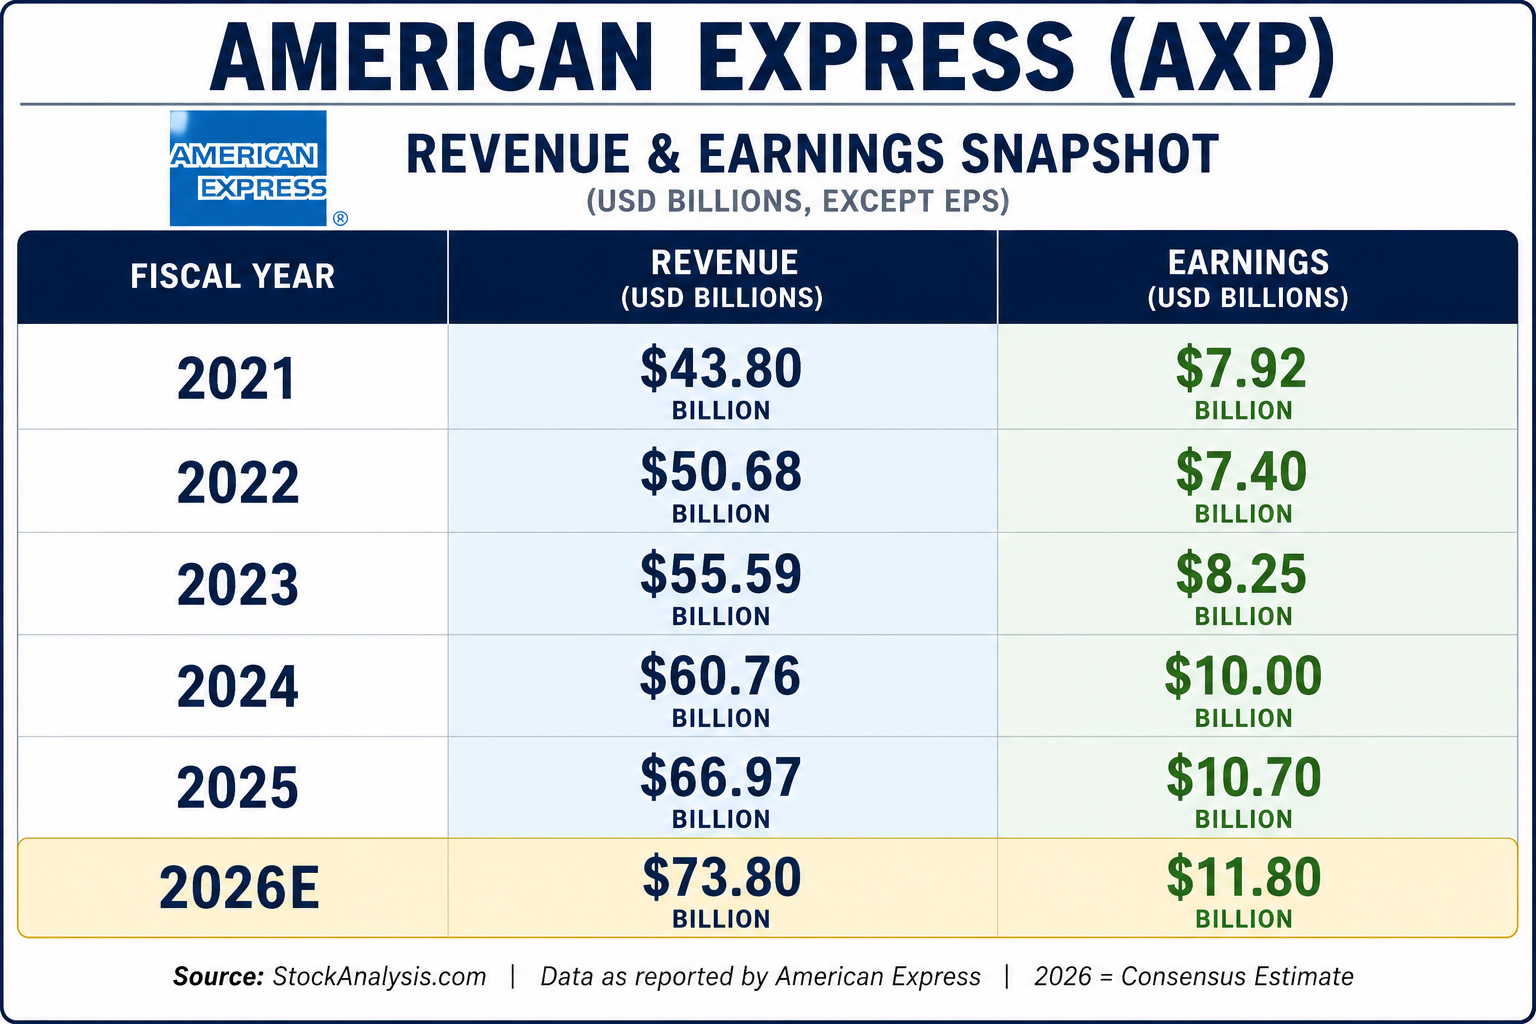
American Express continues to demonstrate the kind of steady execution investors value most. Revenue has grown from $43.8 billion in 2021 to $66.97 billion in 2025, while earnings have increased from $7.92 billion to $10.70 billion, reflecting consistent growth despite higher interest rates and economic uncertainty. Serving an affluent customer base that spends more and remains highly engaged has enabled the company to expand both sales and profitability, and Wall Street expects that momentum to continue into 2026. For traders, these strengthening fundamentals provide confidence that the stock’s recent price gains are supported by improving business performance rather than short-term market enthusiasm.
The reason is straightforward. American Express isn’t simply a credit card company. It operates one of the world’s premier closed-loop payment networks, serving affluent consumers and corporate clients who historically spend more, travel more, and default less than the average borrower. Merchant fees, premium card memberships, travel services, and lending all contribute to a diversified stream of cash flow that has proven remarkably resilient through multiple economic cycles.
The comparison table reveals a tale of two time frames. Over the past year, American Express has gained 9.1%, trailing the S&P 500, Nasdaq, Dow Jones Industrial Average, and Russell 2000. Six-month and year-to-date performance also remain below the broader market averages, indicating that AXP has spent much of the past year playing catch-up while other sectors attracted the bulk of institutional capital.

The picture changes dramatically when attention shifts to recent performance. During the past month, American Express surged roughly 7%, while the S&P 500 advanced only about 1%. That six-percentage-point performance advantage is precisely the type of relative strength professional traders look for because leadership often changes before the headlines recognize it. The stock has also outperformed during the most recent week, suggesting momentum continues to build.
Relative strength rarely improves by accident. Capital typically rotates toward companies where investors believe future earnings, cash flow, or business conditions are improving. Although the longer-term scorecard still favors the broader indexes, the recent acceleration suggests American Express may be entering a new phase where institutional money is beginning to return. That shift is exactly why AXP deserves a place on an active trader’s watch list.
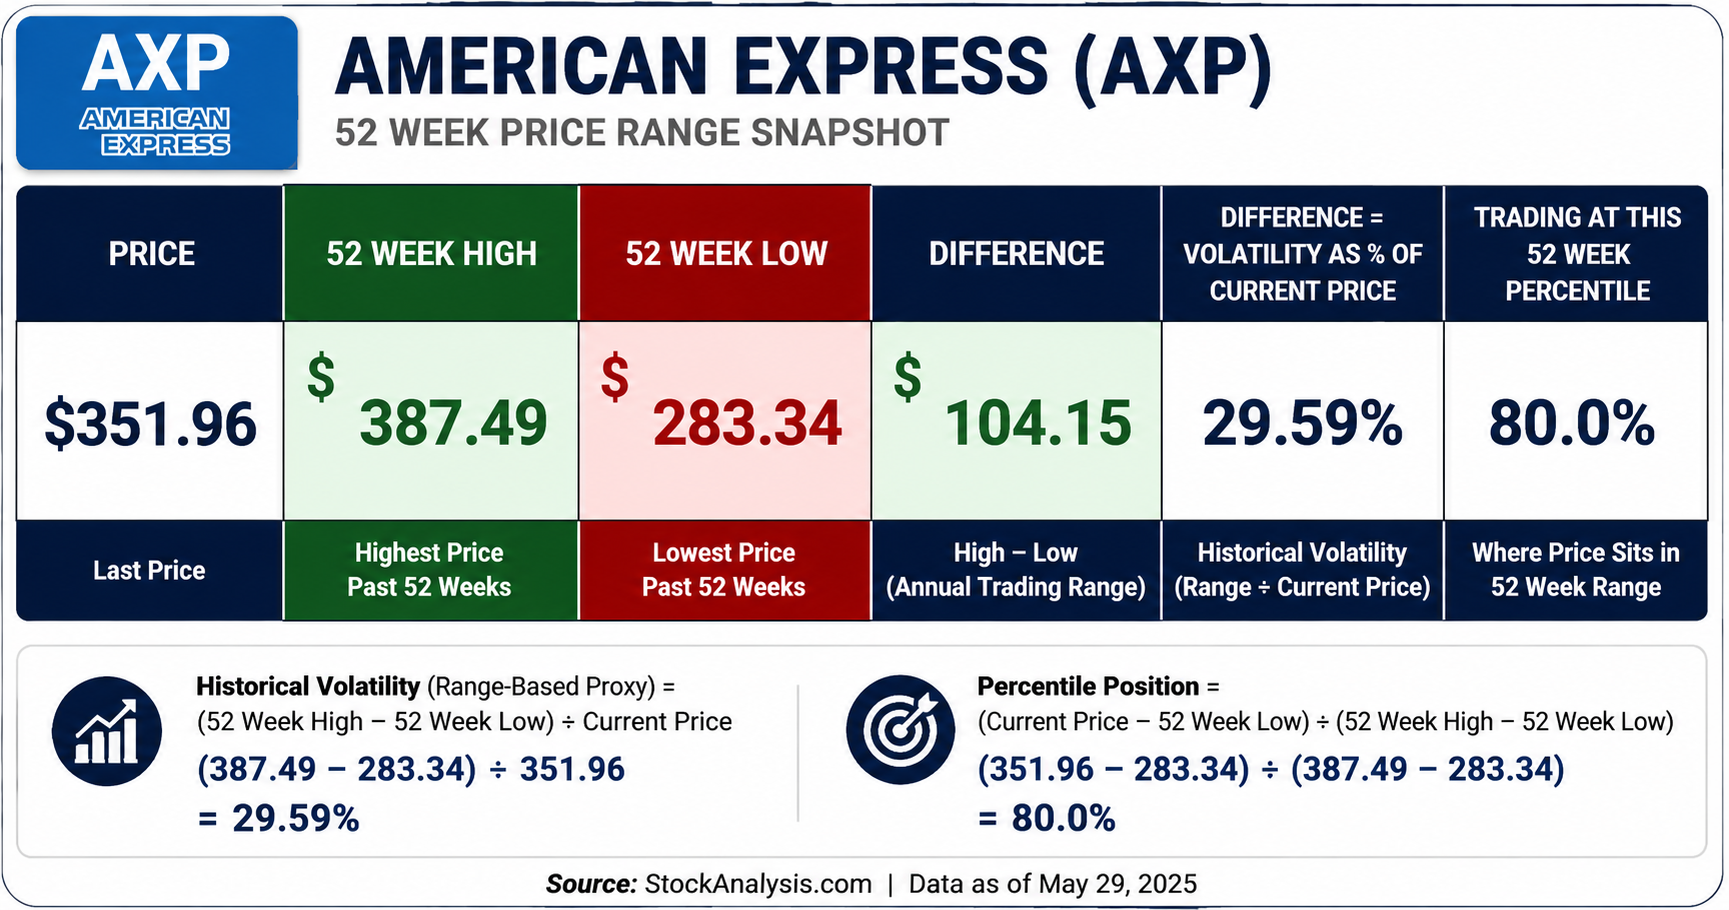
The 52-week picture tells a similar story. AXP recently traded at $351.96, only about 9% below its 52-week high of $387.49 while remaining comfortably above its 52-week low of $283.34. The annual trading range has been approximately $104, representing roughly 29.6% of the current share price. More importantly, the stock is trading near the 80th percentile of its annual range, placing it much closer to new highs than new lows. Strong stocks generally spend their time near the top of their ranges, not the bottom.
Best-Case/Worst-Case Analysis
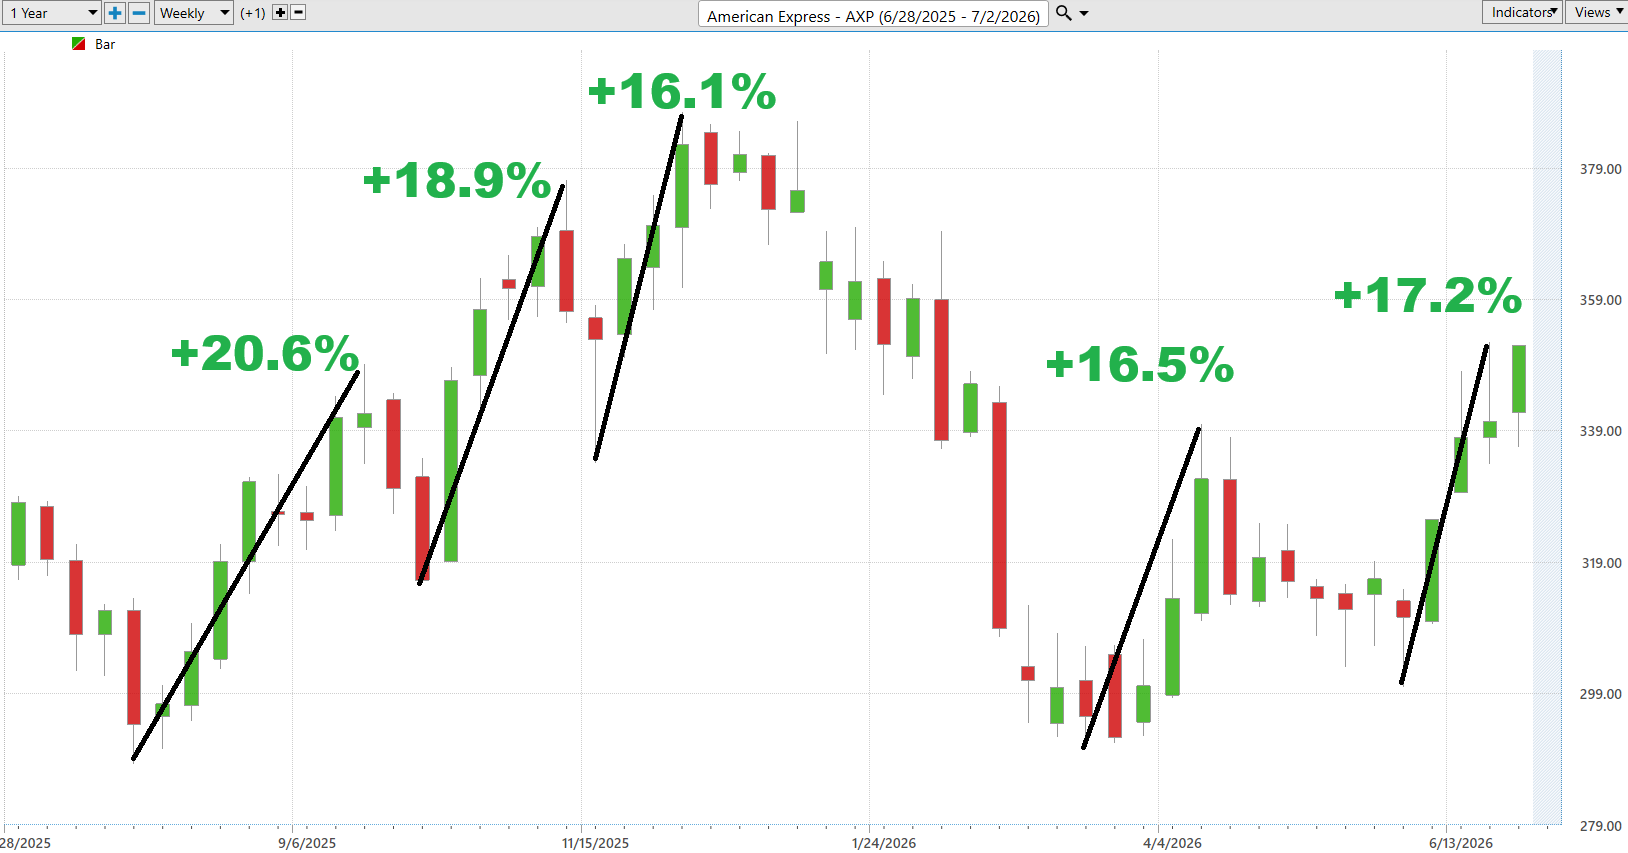
One of the best ways to understand a stock is to study how it has behaved during both periods of optimism and periods of fear. During the past year, American Express has delivered uninterrupted rallies of approximately 20.6%, 18.9%, 16.1%, 16.5%, and most recently 17.2%. Those repeated advances demonstrate the stock’s ability to generate sustained momentum once buyers regain control.
The declines tell an equally valuable story. Pullbacks of 12.3%, 9.3%, 11.1%, 24.4%, and 11.5% remind traders that even fundamentally strong companies experience meaningful corrections. The largest decline exceeded 24%, illustrating why emotional decision making can become expensive for investors who mistake temporary weakness for permanent deterioration.
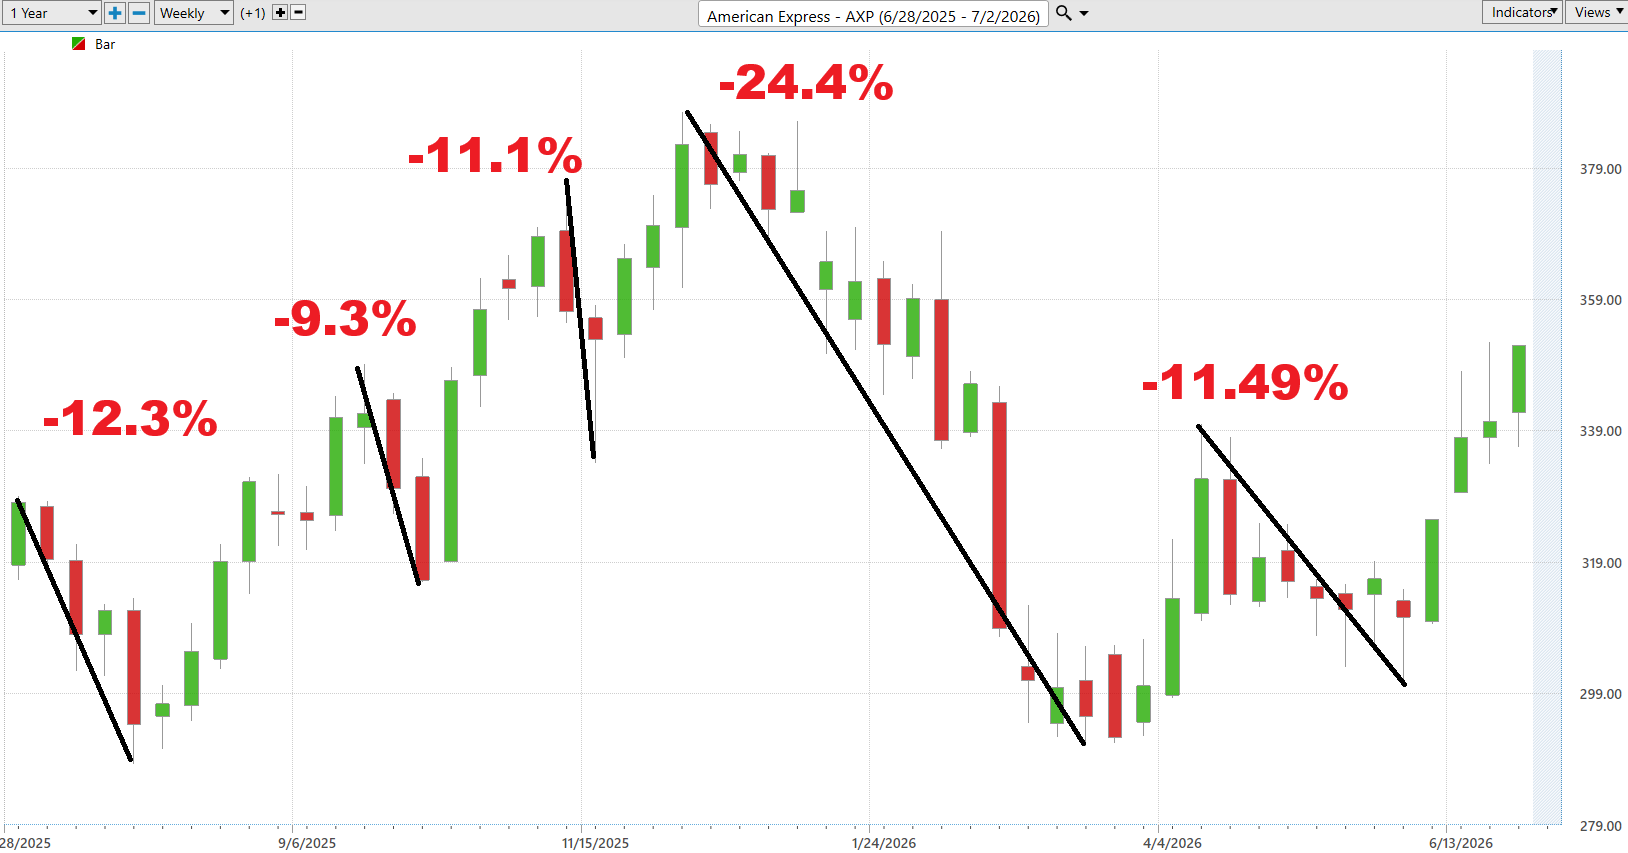
Viewed together, these historical swings establish realistic expectations. American Express is not a straight-line investment. It has repeatedly rewarded patient traders while simultaneously testing their discipline with sharp corrections. Understanding those historical moves helps traders size positions appropriately and place protective stops in locations that respect the stock’s normal volatility rather than reacting emotionally to every short-term fluctuation.
VantagePoint AI Predictive Blue Line
The Predictive Blue Line has continued to trend higher and remains comfortably above the longer-term moving average, indicating that momentum continues to strengthen rather than weaken. Equally important, the distance between the predictive forecast and the longer-term trend has widened during the recent rally. That widening spread suggests buyers are becoming increasingly aggressive rather than simply maintaining the existing trend.
The broader Financial sector tells a similar story. The sector ETF has been climbing steadily with predictive indicators also pointing higher, reinforcing the idea that American Express is benefiting from improving conditions across the industry rather than advancing in isolation. When sector leadership and individual stock leadership align, trends often become more sustainable.
For traders, the message is straightforward. The predictive trend remains positive, institutional momentum appears supportive, and the probability currently favors continuation until the evidence changes.
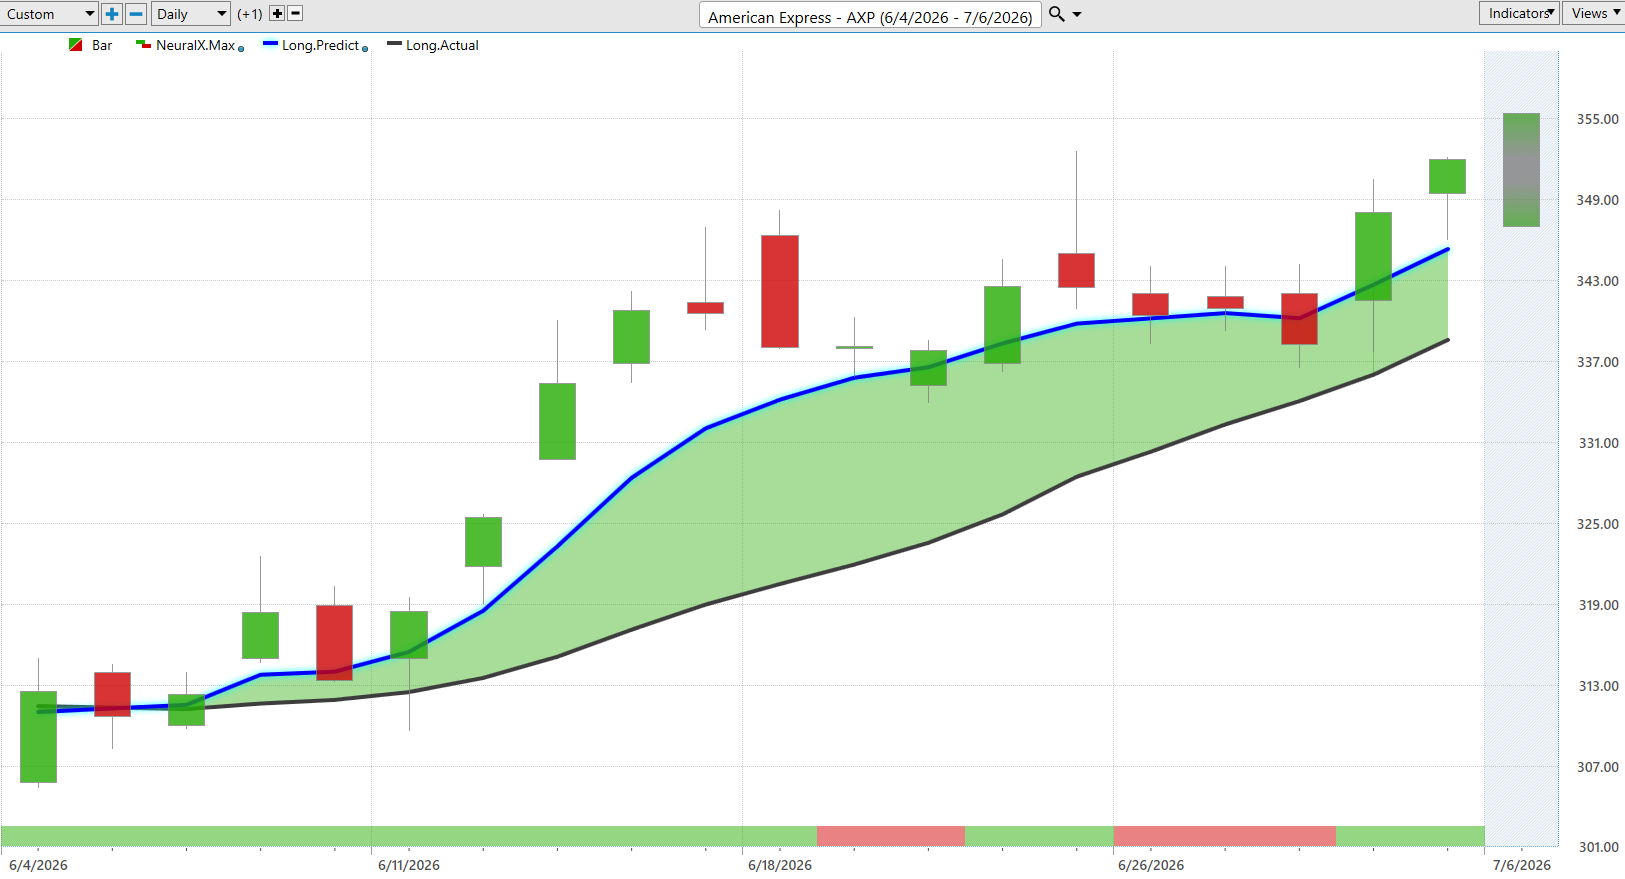
The Neural Index has shifted back into positive territory following a brief period of hesitation, indicating that short-term market conditions have become increasingly favorable. Instead of forecasting weakness, the indicator is confirming that buying pressure has regained control during the recent advance.
That confirmation matters because trends tend to be strongest when multiple independent indicators point in the same direction. Price has been rising, the Predictive Blue Line has continued to improve, and the Neural Index has moved back into alignment with the prevailing trend. While no indicator guarantees future performance, this combination provides traders with additional confidence that the recent breakout is supported by improving momentum rather than short-lived enthusiasm.
VantagePoint AI Daily Range Forecast
The Daily Range Forecast continues to project higher expected trading ranges while recent price action has remained well aligned with those forecasts. Rather than chasing extended moves after they occur, traders can use these projected ranges to identify logical entry opportunities during intraday pullbacks and establish realistic profit objectives before emotions begin influencing decisions.
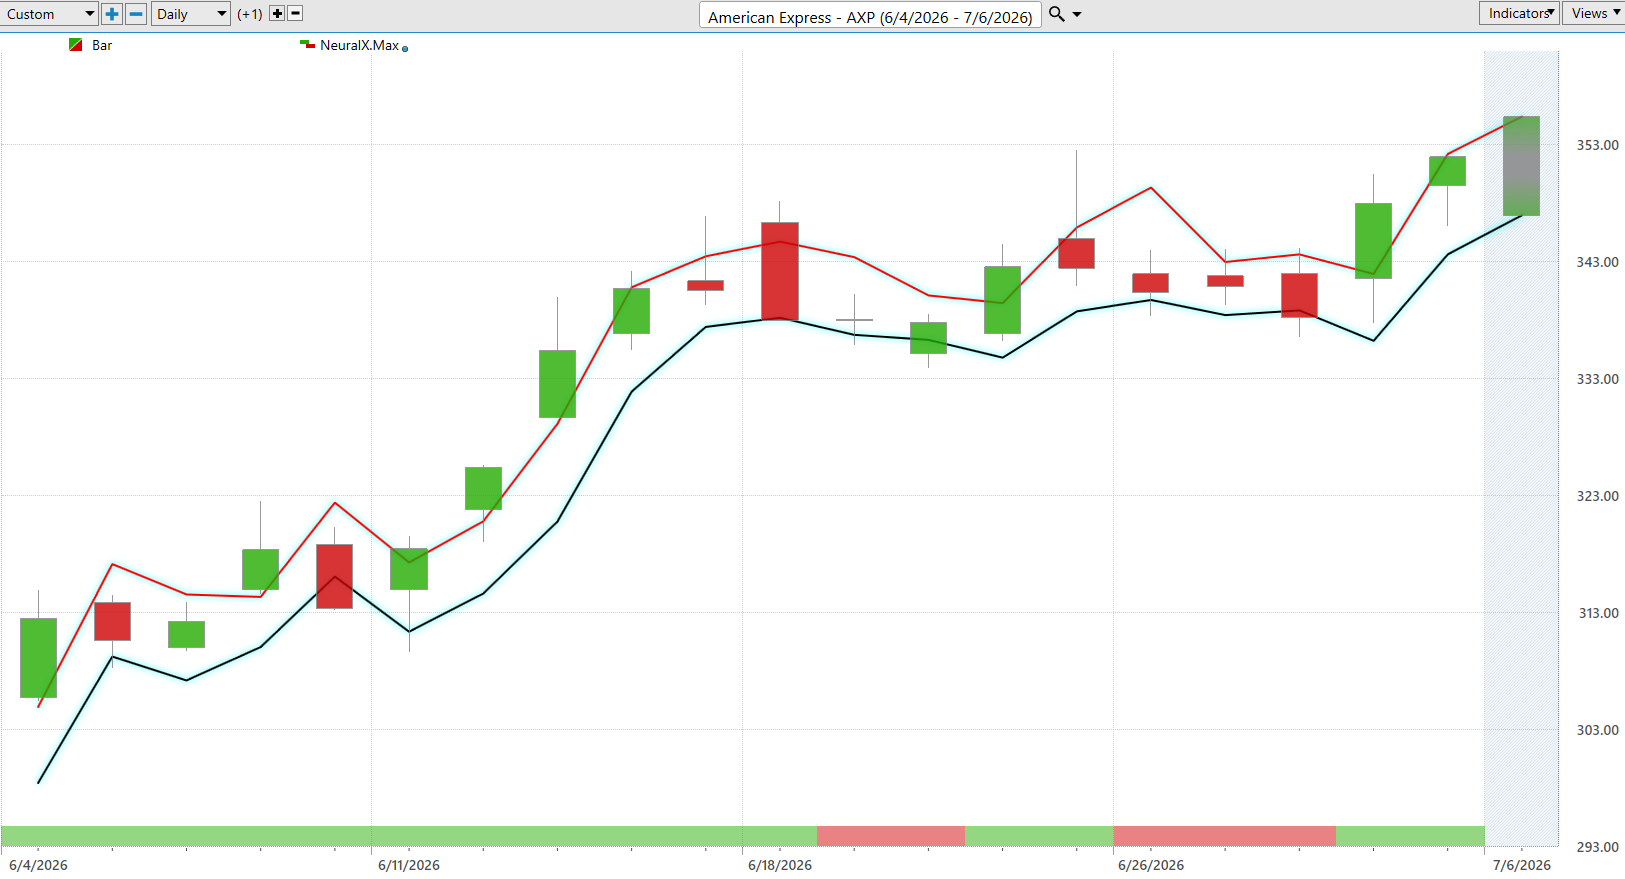
Risk management remains the priority. Forecasted ranges are planning tools rather than guarantees, allowing traders to define both reward potential and downside risk before entering a position. Combined with the strengthening predictive indicators and improving relative strength, the Daily Range Forecast provides another piece of evidence suggesting that buyers currently maintain the upper hand, while reminding traders to remain disciplined if market conditions begin to change.
Risk management remains essential. Every advance eventually pauses, and strong stocks are no exception. The historical pullbacks over the past year remind traders that volatility is the admission price for participating in larger trends. Position sizing, disciplined stop placement, and patience remain just as important as identifying the right opportunity.
The bigger picture is what matters most. Capital is rotating back into Financials. American Express is beginning to outperform the broader market. Revenue and earnings continue to reach new highs. The stock sits in the upper portion of its 52-week range while predictive indicators continue to improve. Those pieces don’t guarantee higher prices tomorrow, but together they create a combination that deserves close attention.
Sometimes the market whispers before it shouts.
This may be one of those moments.
Watch the Financial Sector ETF – $XLF as long as it continues to outperform the S&P 500 Index American Express looks like ti can continue to move higher.
Use the VantagePoint Daily Range Forecast to isolate short term trading opportunities.
Practice great money management on all of your trades.
Ready to learn more about forecasting stocks and options days before anyone else with up to 87.4% proven accuracy? Attend a FREE LIVE CLASS.
Let’s Be Careful Out There.
It’s not magic.
It’s machine learning.
THERE IS A SUBSTANTIAL RISK OF LOSS ASSOCIATED WITH TRADING. ONLY RISK CAPITAL SHOULD BE USED TO TRADE. TRADING STOCKS, FUTURES, OPTIONS, FOREX, AND ETFs IS NOT SUITABLE FOR EVERYONE.IMPORTANT NOTICE!
DISCLAIMER: STOCKS, FUTURES, OPTIONS, ETFs AND CURRENCY TRADING ALL HAVE LARGE POTENTIAL REWARDS, BUT THEY ALSO HAVE LARGE POTENTIAL RISK. YOU MUST BE AWARE OF THE RISKS AND BE WILLING TO ACCEPT THEM IN ORDER TO INVEST IN THESE MARKETS. DON’T TRADE WITH MONEY YOU CAN’T AFFORD TO LOSE. THIS ARTICLE AND WEBSITE IS NEITHER A SOLICITATION NOR AN OFFER TO BUY/SELL FUTURES, OPTIONS, STOCKS, OR CURRENCIES. NO REPRESENTATION IS BEING MADE THAT ANY ACCOUNT WILL OR IS LIKELY TO ACHIEVE PROFITS OR LOSSES SIMILAR TO THOSE DISCUSSED ON THIS ARTICLE OR WEBSITE. THE PAST PERFORMANCE OF ANY TRADING SYSTEM OR METHODOLOGY IS NOT NECESSARILY INDICATIVE OF FUTURE RESULTS. CFTC RULE 4.41 – HYPOTHETICAL OR SIMULATED PERFORMANCE RESULTS HAVE CERTAIN LIMITATIONS. UNLIKE AN ACTUAL PERFORMANCE RECORD, SIMULATED RESULTS DO NOT REPRESENT ACTUAL TRADING. ALSO, SINCE THE TRADES HAVE NOT BEEN EXECUTED, THE RESULTS MAY HAVE UNDER-OR-OVER COMPENSATED FOR THE IMPACT, IF ANY, OF CERTAIN MARKET FACTORS, SUCH AS LACK OF LIQUIDITY. SIMULATED TRADING PROGRAMS IN GENERAL ARE ALSO SUBJECT TO THE FACT THAT THEY ARE DESIGNED WITH THE BENEFIT OF HINDSIGHT. NO REPRESENTATION IS BEING MADE THAT ANY ACCOUNT WILL OR IS LIKELY TO ACHIEVE PROFIT OR LOSSES SIMILAR TO THOSE SHOWN.