





Hot Stock Snapshot: DoorDash ($DASH)
Company Profile
DoorDash has become much more than a restaurant-delivery company. It now describes itself as a global local-commerce platform spanning restaurants, grocery, retail and merchant services, with operations extending internationally through businesses including Wolt and Deliveroo. The fundamental story is increasingly about scale, diversification and converting growth into profitability.
DoorDash ($DASH) began in 2013, when Stanford students Tony Xu, Stanley Tang, Andy Fang and Evan Moore started a small delivery service originally called Palo Alto Delivery. In those early days, the founders themselves made the deliveries, operating out of Stanford student housing with little more than a website, their cars and phones. Thirteen years later, DoorDash has evolved into one of the world’s largest local-commerce platforms, operating across more than 40 countries through businesses that now include DoorDash, Wolt and Deliveroo.
The business model is straightforward: DoorDash makes money whenever commerce moves through its network. Merchants generally pay commissions based on the value of orders; consumers pay delivery and service fees; subscribers pay for programs such as DashPass, Wolt+ and Deliveroo Plus; advertisers pay to reach customers on its marketplaces; and businesses pay DoorDash for services through its Commerce Platform, including white-label delivery and online-ordering infrastructure. Restaurants remain important, but DoorDash increasingly connects consumers with grocery stores, convenience stores, retailers and other local businesses. In other words, DoorDash is trying to become less of a food-delivery app and more of the digital toll road connecting local merchants, consumers and delivery logistics.
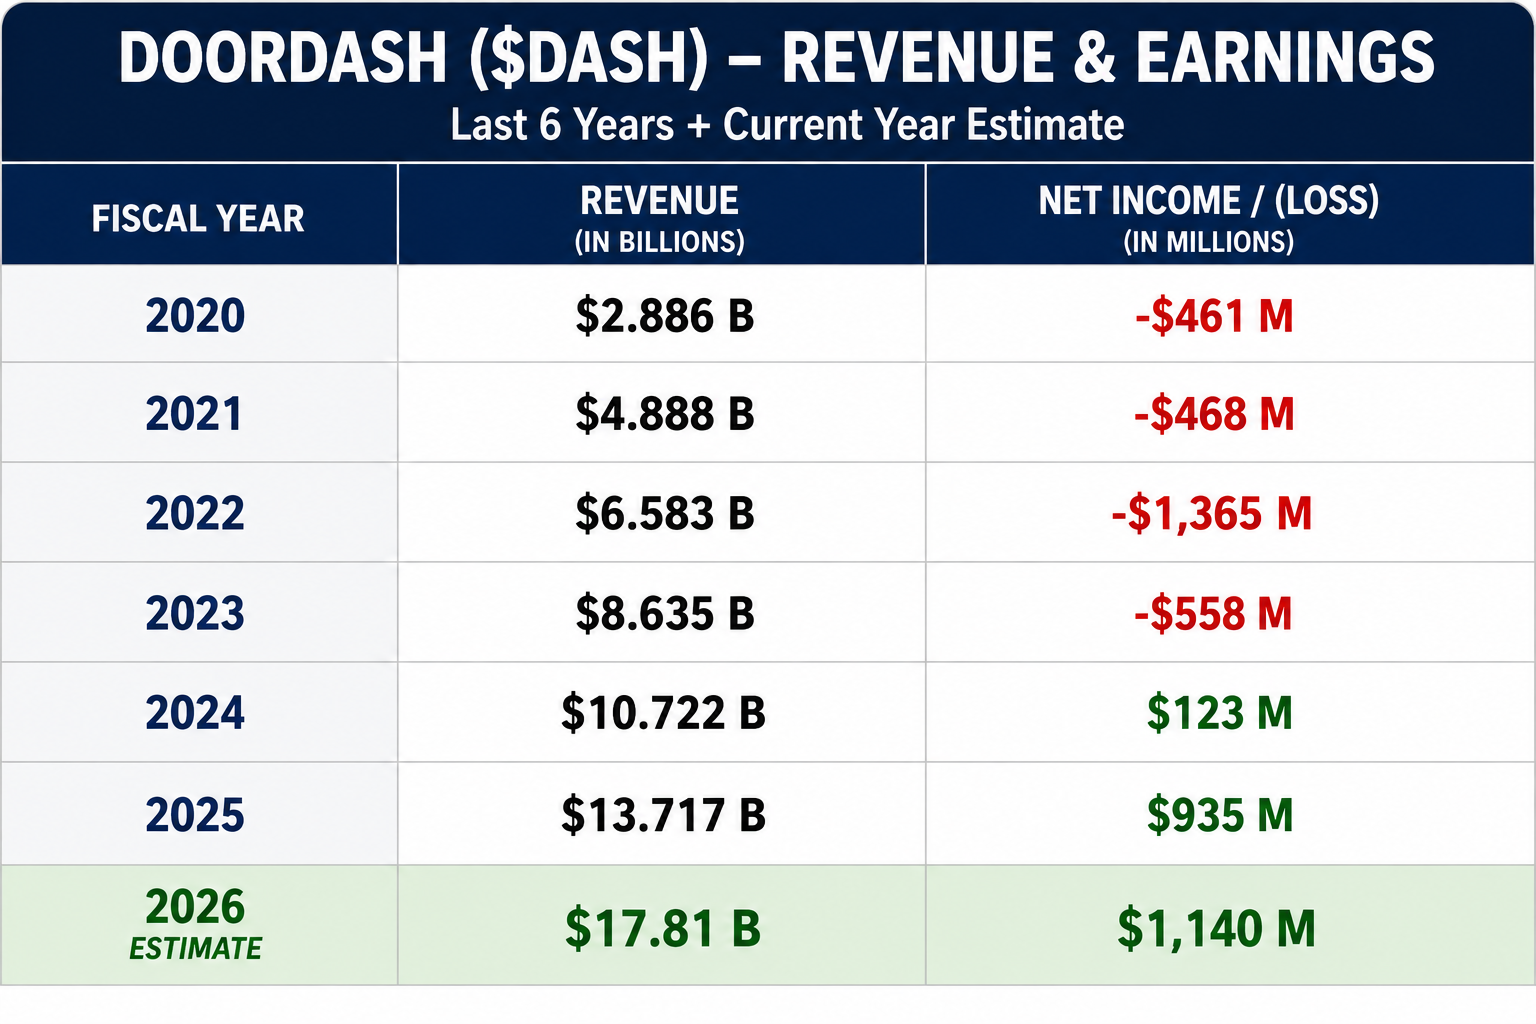
The revenue and earnings table shows the transformation clearly. Revenue increased from $2.886 billion in 2020 to $13.717 billion in 2025, while net income moved from a $461 million loss in 2020 to a $935 million profit in 2025. The supplied analyst estimate calls for $17.81 billion of 2026 revenue and $1.14 billion of net income.
The latest quarter reinforces the growth story. Big time.
52-Week Range Analysis
Using the supplied values, DASH closed at $216, versus a 52-week high of $285.50 and a 52-week low of $143.30. That’s an enormous $142.20 trading range. Dividing that range by the closing price produces 52-week volatility of 65.8%, while $216 places DASH at approximately the 51.1 percentile of its annual range.
That last number is important. Despite the strength of the recent rally, DASH is nowhere near its old high. The stock has recovered substantially from its lows but remains almost exactly halfway between its annual extremes. The recovery has been powerful; the old damage has not been completely repaired.
Best-Case Analysis
The best-case chart demonstrates why DoorDash ($DASH) can be attractive to momentum traders. Across the major advances highlighted during the past year, DASH’s rallies have generally been substantial, with the average major advance approximately 30%. The strongest moves have reached the mid-30% range, showing that once momentum takes hold, DASH can cover considerable ground in a relatively short period.
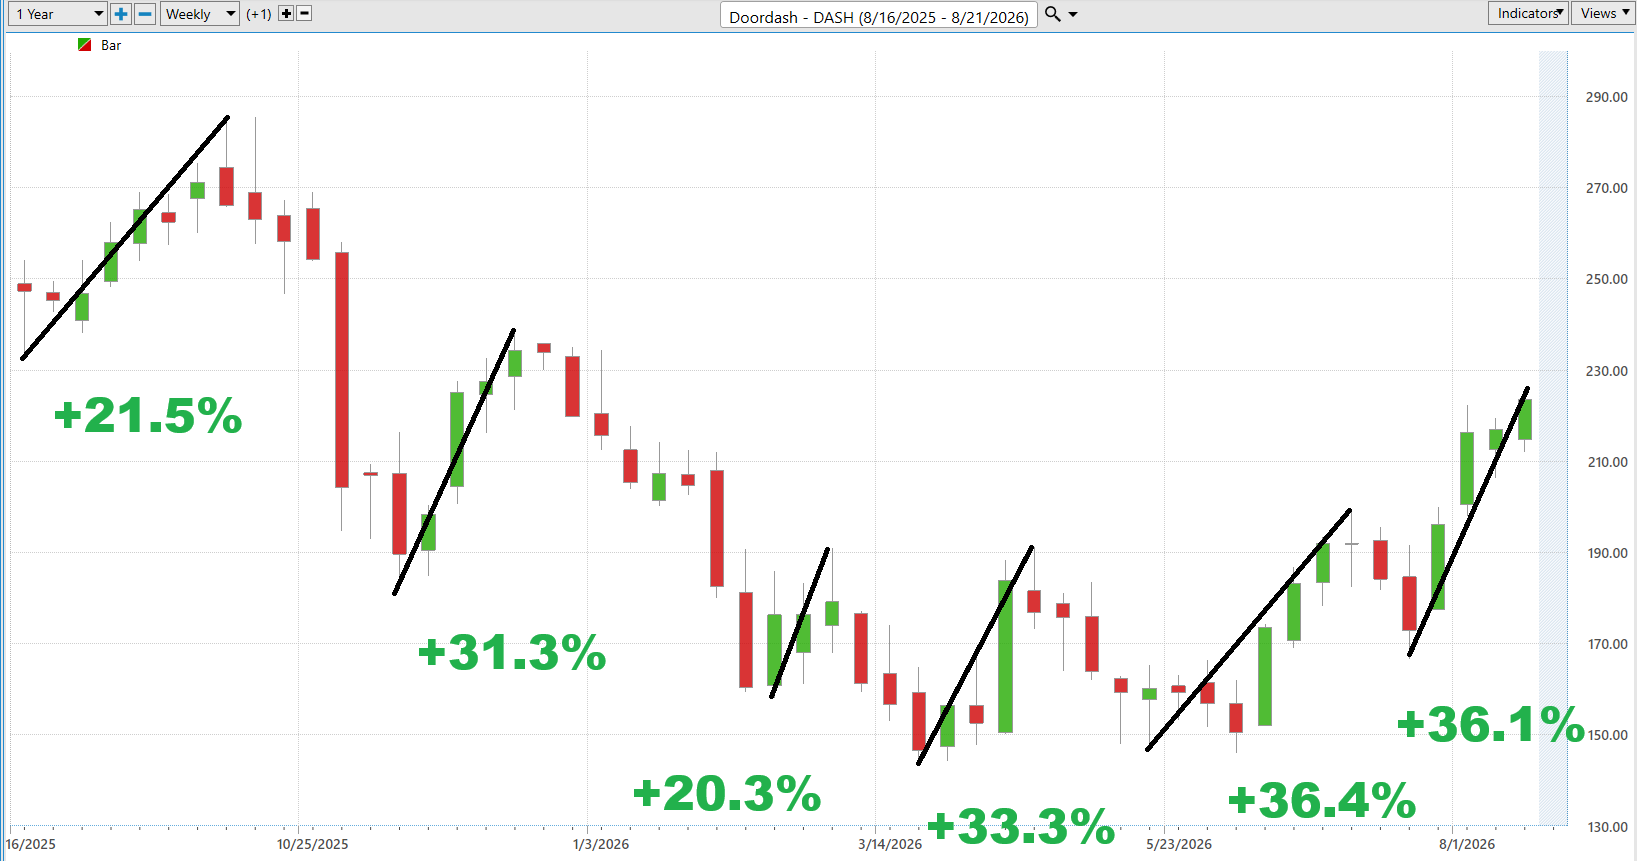
The current advance is consistent with that historical personality. DASH has rallied strongly from its summer low and is again displaying the kind of upside momentum seen during its better trading cycles. The lesson is not that another 30% gain should be expected. Rather, DASH has demonstrated that sustained bullish trends can produce unusually large trading opportunities. The best-case chart establishes the stock’s upside potential; the current trend determines whether that potential is actually being realized.
Worst-Case Analysis
The worst-case chart provides the necessary counterweight. DASH’s major declines during the past year have averaged approximately 27%, with the most severe drawdowns exceeding 30%. In other words, this is not a stock where traders can casually ignore a deteriorating trend and assume that a small pullback will remain small.
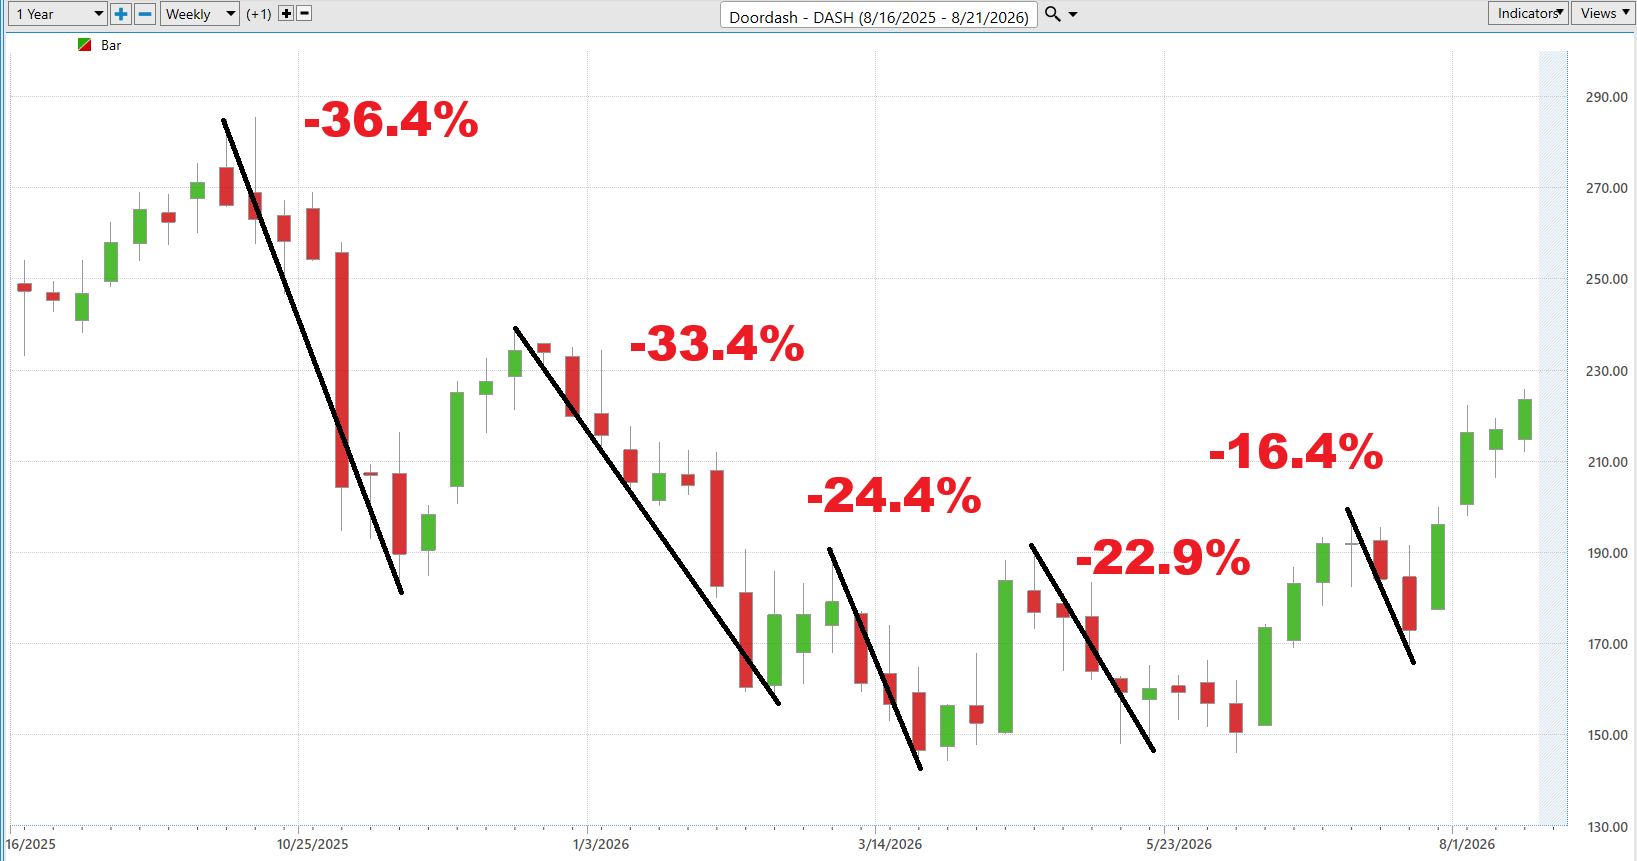
Taken together, the two charts reveal the defining characteristic of DASH: large opportunity comes with large risk. Its major advances have averaged roughly 30%, while its major declines have averaged roughly 27%. That symmetry matters. DASH can reward traders handsomely when they are aligned with the trend, but being wrong and remaining wrong can become expensive very quickly. The objective is therefore not to predict how far DASH will travel. It is to identify the prevailing trend, participate while the evidence remains favorable, and respond quickly when that evidence changes.
Comparison Metrics
This may be the most revealing part of the entire Hot Stock Snapshot. $DASH has unperformed meaningfully across the longer term time frames but it has massively outperformed over the short term and medium term time frames.

The annual numbers say DASH has been a laggard: -8.88% versus +19.18% for the S&P 500. Even YTD, DASH’s +1.68% badly trails the S&P’s +11.90%. But when you switch you focus to the shorter term time frames $DASH over the past few months has been explosive.
Over six months, DASH gained 35.96% versus 11.38% for the S&P. Over one month, the gap exploded to +29.25% versus +3.54%. And most strikingly, during the latest week DASH advanced 3.47% while every major benchmark in the table declined.
The story isn’t simply that DASH is strong. It’s that a former laggard has recently become a relative-strength leader. For traders, changes in character like that deserve attention.
Predictive Blue Line
The VantagePoint Predictive Blue Line uses predictive calculations and intermarket relationships to anticipate trend direction rather than simply measuring where price has already been.
The chart is bullish. Since late July, the Predictive Blue Line has risen substantially, with the predictive line remaining above the actual line through most of the advance. Price has simultaneously moved from roughly the $180 area toward $220.
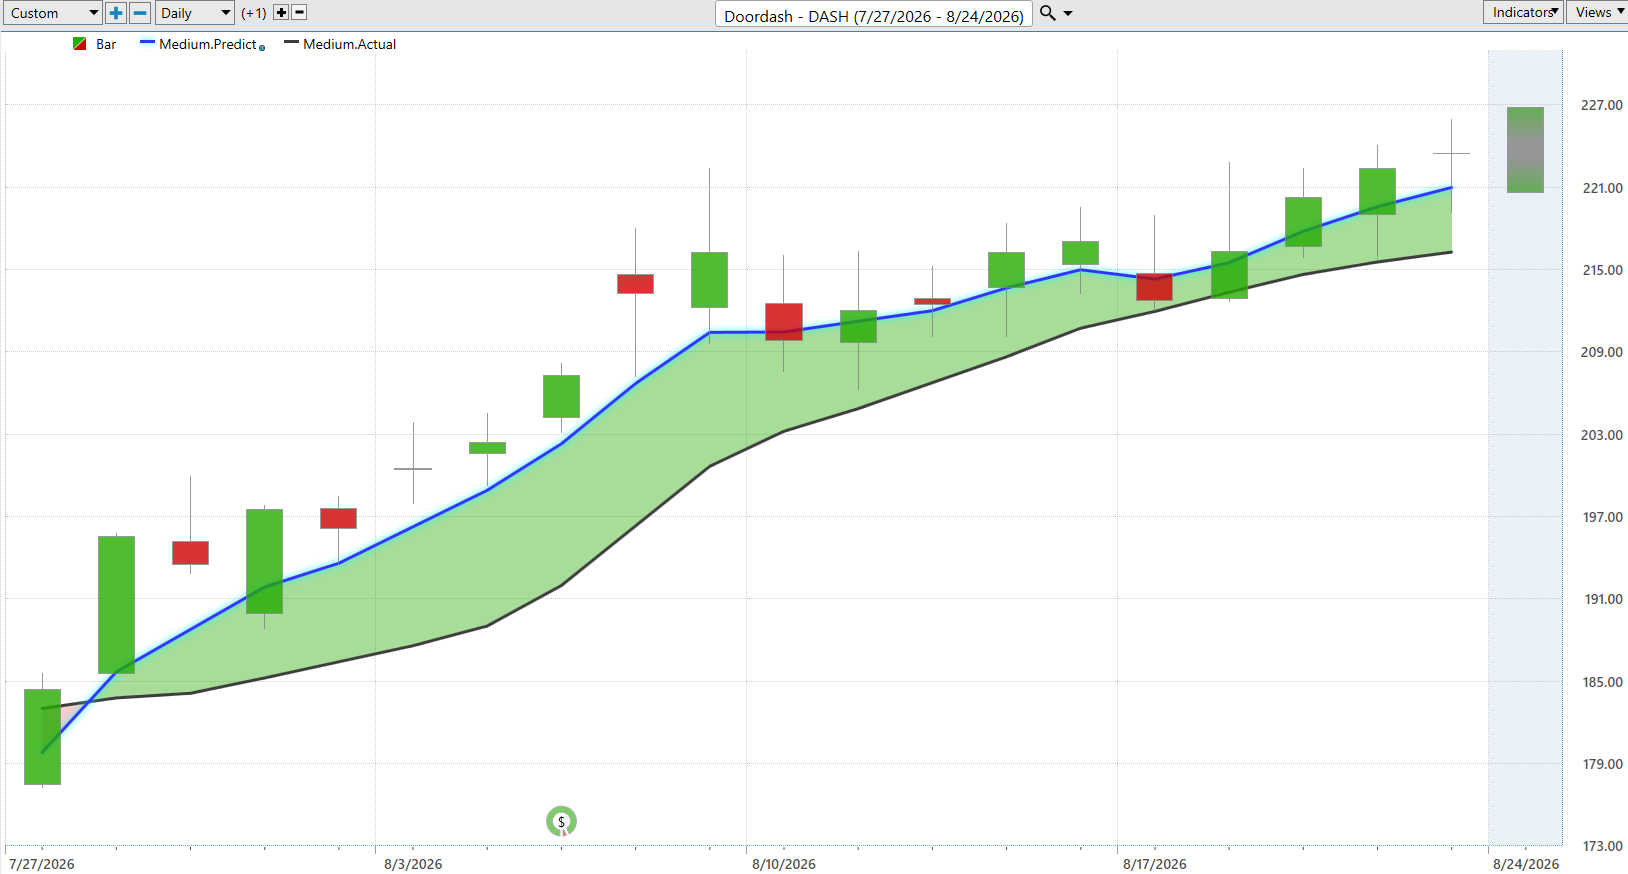
What confirms the signal? Continued upward slope in the Blue Line, price holding above it, and the predictive/actual relationship remaining positive. What contradicts it? A flattening and downturn in the Blue Line followed by price losing the predictive trend.
Neural Index
The Neural Index looks approximately 48–72 hours ahead for expected short-term strength or weakness. Its greatest value comes from combining it with the longer trend signal rather than trading it independently.
The chart is predominantly green, interrupted by brief bearish readings around August 10 and August 17. Those warnings did not develop into sustained reversals. Instead, the bullish Neural Index returned while the Predictive Blue Line continued rising.
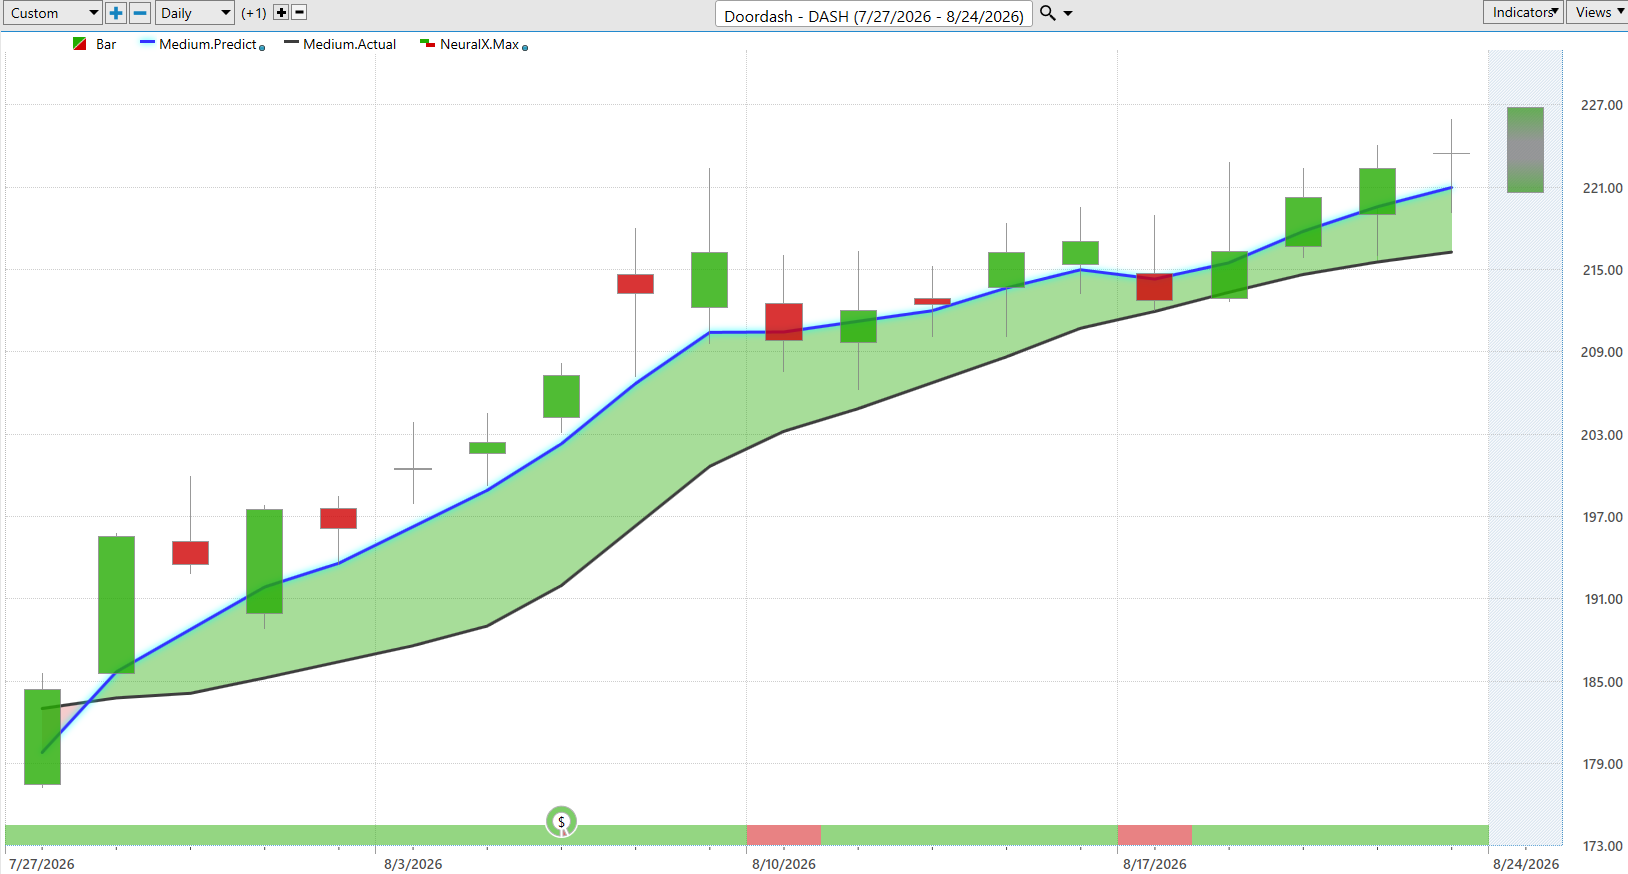
That creates the condition traders want to see: double confirmation — bullish Predictive Blue Line plus bullish Neural Index. If the Neural Index turns persistently red while the Blue Line begins flattening, that would be an early reason to become more defensive.
Daily Range Forecast
The Daily Range Forecast addresses a different question. The Blue Line helps determine direction; the Daily Range Forecast helps determine location.
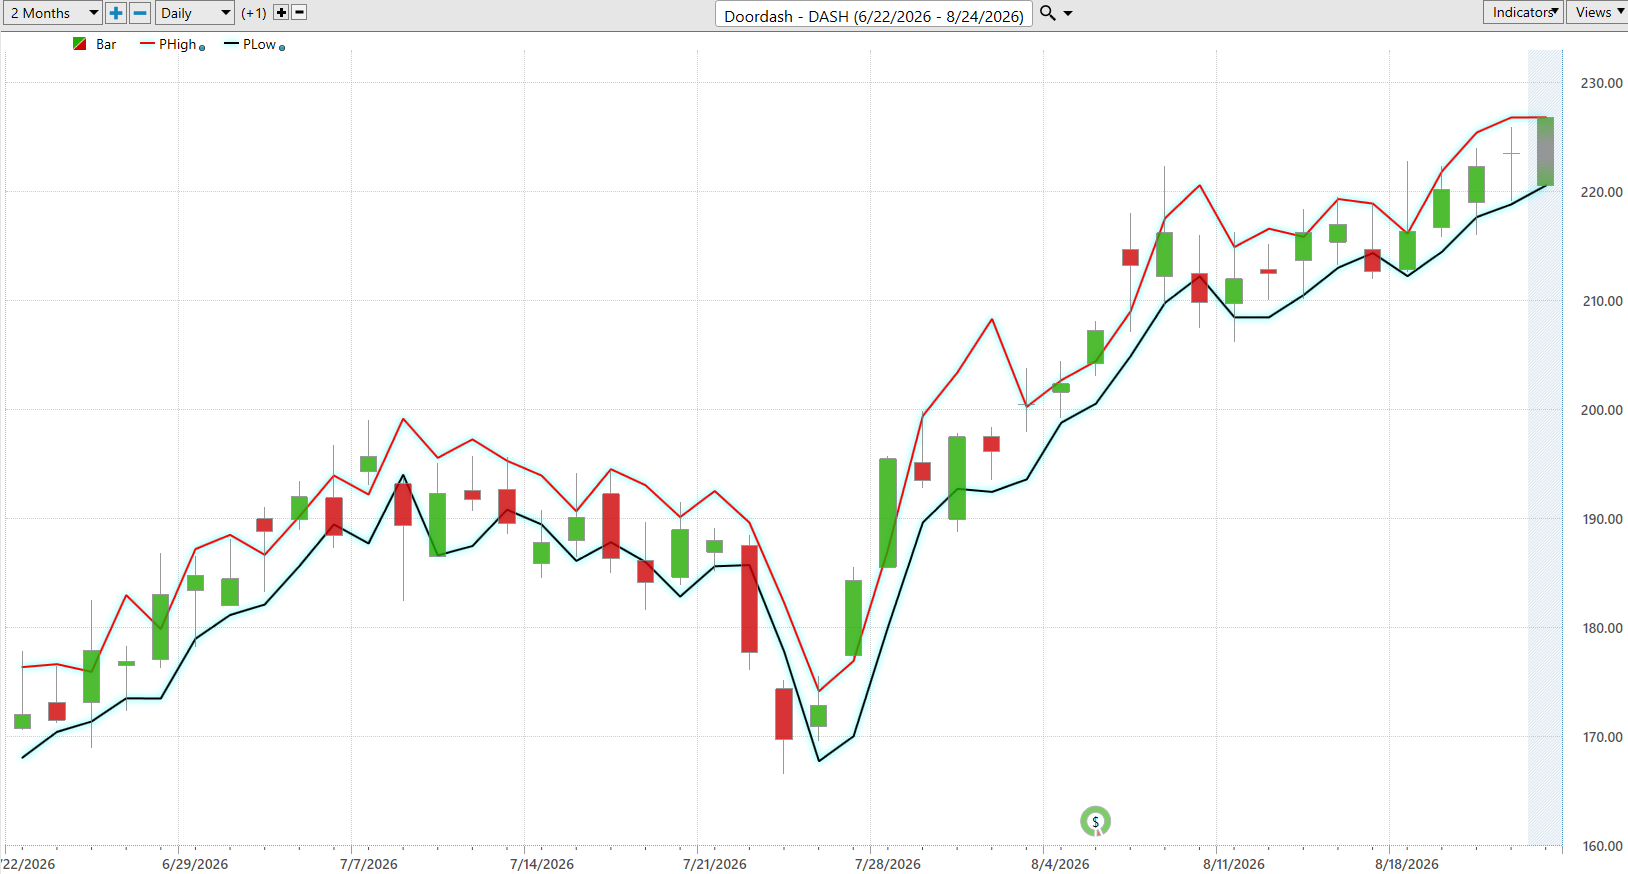
The chart shows the predicted high and predicted low climbing substantially during the recent advance, consistent with the broader bullish trend. Rather than chasing DASH after a strong move toward the upper forecast boundary, traders can use the lower portion of the predicted range to identify potential value zones and entries,.
These levels are not guarantees. Their purpose is to help traders answer a much more practical question: If the trend is bullish, where can I participate by paying as little as possible simply because the stock is moving?
Our Suggestion
DoorDash presents traders with an intriguing contradiction. The long-term performance remains unimpressive, but the short-term evidence has changed dramatically. DASH is still down 8.88% over the annual comparison period, yet it has gained 35.96% over six months and 29.25% over the latest month. Most importantly, it gained 3.47% during a week when all four major indexes in the supplied comparison declined.
The fundamentals provide support. Q2 revenue grew 36%, orders increased 27%, Marketplace GOV increased 36%. Meanwhile, the Predictive Blue Line is rising and the Neural Index is predominantly bullish.
The thesis is bullish while those conditions remain intact. Confirmation would come from continued relative outperformance, a rising Predictive Blue Line, bullish Neural Index readings and price continuing to establish higher highs and higher lows. Invalidation would begin with persistent Neural Index weakness, deterioration in the Blue Line and a breakdown of the recent higher-low structure.
The important distinction is between being bullish and being careless. DASH’s 52-week history contains rallies exceeding 30% and declines exceeding 30%. That’s why the Daily Range Forecast matters: follow the trend, look for value, and define the risk before entering the trade.
The objective isn’t to predict every turn. It’s to remain on the right side of the right trend—and change when the evidence changes.
It’s not magic.
It’s machine learning.
THERE IS A SUBSTANTIAL RISK OF LOSS ASSOCIATED WITH TRADING. ONLY RISK CAPITAL SHOULD BE USED TO TRADE. TRADING STOCKS, FUTURES, OPTIONS, FOREX, AND ETFs IS NOT SUITABLE FOR EVERYONE.IMPORTANT NOTICE!
DISCLAIMER: STOCKS, FUTURES, OPTIONS, ETFs AND CURRENCY TRADING ALL HAVE LARGE POTENTIAL REWARDS, BUT THEY ALSO HAVE LARGE POTENTIAL RISK. YOU MUST BE AWARE OF THE RISKS AND BE WILLING TO ACCEPT THEM IN ORDER TO INVEST IN THESE MARKETS. DON’T TRADE WITH MONEY YOU CAN’T AFFORD TO LOSE. THIS ARTICLE AND WEBSITE IS NEITHER A SOLICITATION NOR AN OFFER TO BUY/SELL FUTURES, OPTIONS, STOCKS, OR CURRENCIES. NO REPRESENTATION IS BEING MADE THAT ANY ACCOUNT WILL OR IS LIKELY TO ACHIEVE PROFITS OR LOSSES SIMILAR TO THOSE DISCUSSED ON THIS ARTICLE OR WEBSITE. THE PAST PERFORMANCE OF ANY TRADING SYSTEM OR METHODOLOGY IS NOT NECESSARILY INDICATIVE OF FUTURE RESULTS. CFTC RULE 4.41 – HYPOTHETICAL OR SIMULATED PERFORMANCE RESULTS HAVE CERTAIN LIMITATIONS. UNLIKE AN ACTUAL PERFORMANCE RECORD, SIMULATED RESULTS DO NOT REPRESENT ACTUAL TRADING. ALSO, SINCE THE TRADES HAVE NOT BEEN EXECUTED, THE RESULTS MAY HAVE UNDER-OR-OVER COMPENSATED FOR THE IMPACT, IF ANY, OF CERTAIN MARKET FACTORS, SUCH AS LACK OF LIQUIDITY. SIMULATED TRADING PROGRAMS IN GENERAL ARE ALSO SUBJECT TO THE FACT THAT THEY ARE DESIGNED WITH THE BENEFIT OF HINDSIGHT. NO REPRESENTATION IS BEING MADE THAT ANY ACCOUNT WILL OR IS LIKELY TO ACHIEVE PROFIT OR LOSSES SIMILAR TO THOSE SHOWN.