





Jack Henry & Associates operates in the Technology Sector, specifically within the Financial Technology (FinTech) and Financial Software industry. The company develops mission-critical software, payment processing systems, and technology services for banks, credit unions, and other financial institutions. Unlike consumer-facing fintech companies chasing rapid user growth, Jack Henry focuses on the infrastructure that powers thousands of community and regional financial institutions. That makes the company a classic “picks and shovels” business serving the banking industry.
The company’s business is built around long-term customer relationships. Once a bank installs a core processing platform, replacing it becomes an expensive and disruptive undertaking. Switching costs are extremely high, implementation can take years, and regulatory considerations create additional friction. Those characteristics create unusually sticky customer relationships and recurring revenue streams.
Jack Henry operates through several major business lines, including Core Processing, Payments, Complementary Solutions, and Corporate Services. Core Processing provides the central operating systems used by financial institutions. Payments has become one of the company’s fastest-growing businesses as digital transactions continue expanding. Complementary Solutions include fraud prevention, lending software, digital banking, cybersecurity, and compliance products that deepen customer relationships over time. The result is a layered ecosystem where each additional service increases customer dependence on the platform. Community research frequently highlights the company’s strong customer retention, recurring revenue base, and competitive position alongside larger rivals such as Fiserv and FIS.
One of Jack Henry’s greatest competitive advantages is predictability. More than 80% of revenue comes from recurring software, cloud hosting, and payment processing activities rather than one-time software sales. This creates highly visible cash flows and allows management to invest consistently through economic cycles. Banks continue investing in digital transformation regardless of short-term market volatility because their technology infrastructure is essential to daily operations.
Growth opportunities remain attractive. Community banks continue modernizing legacy systems while payment volumes expand each year. Artificial intelligence, fraud detection, cloud migration, and digital banking services represent additional long-term opportunities. Meanwhile, the regulatory complexity of banking creates barriers to entry for new competitors.
The primary risks involve slower bank technology spending during economic downturns, competition from larger financial technology firms, and valuation. Because Jack Henry has historically traded at premium multiples, investor expectations can occasionally outrun operating performance. Even so, the underlying business has demonstrated remarkable consistency through multiple economic cycles.
For traders, Jack Henry represents something different from many technology stocks. It is not driven by hype or speculative narratives. Instead, it is a high-quality compounder whose fortunes are tied to the modernization of the financial system. Traders should monitor both the company and the broader Financial Technology sector because institutional money often rotates into these durable software businesses when investors seek stable earnings growth.
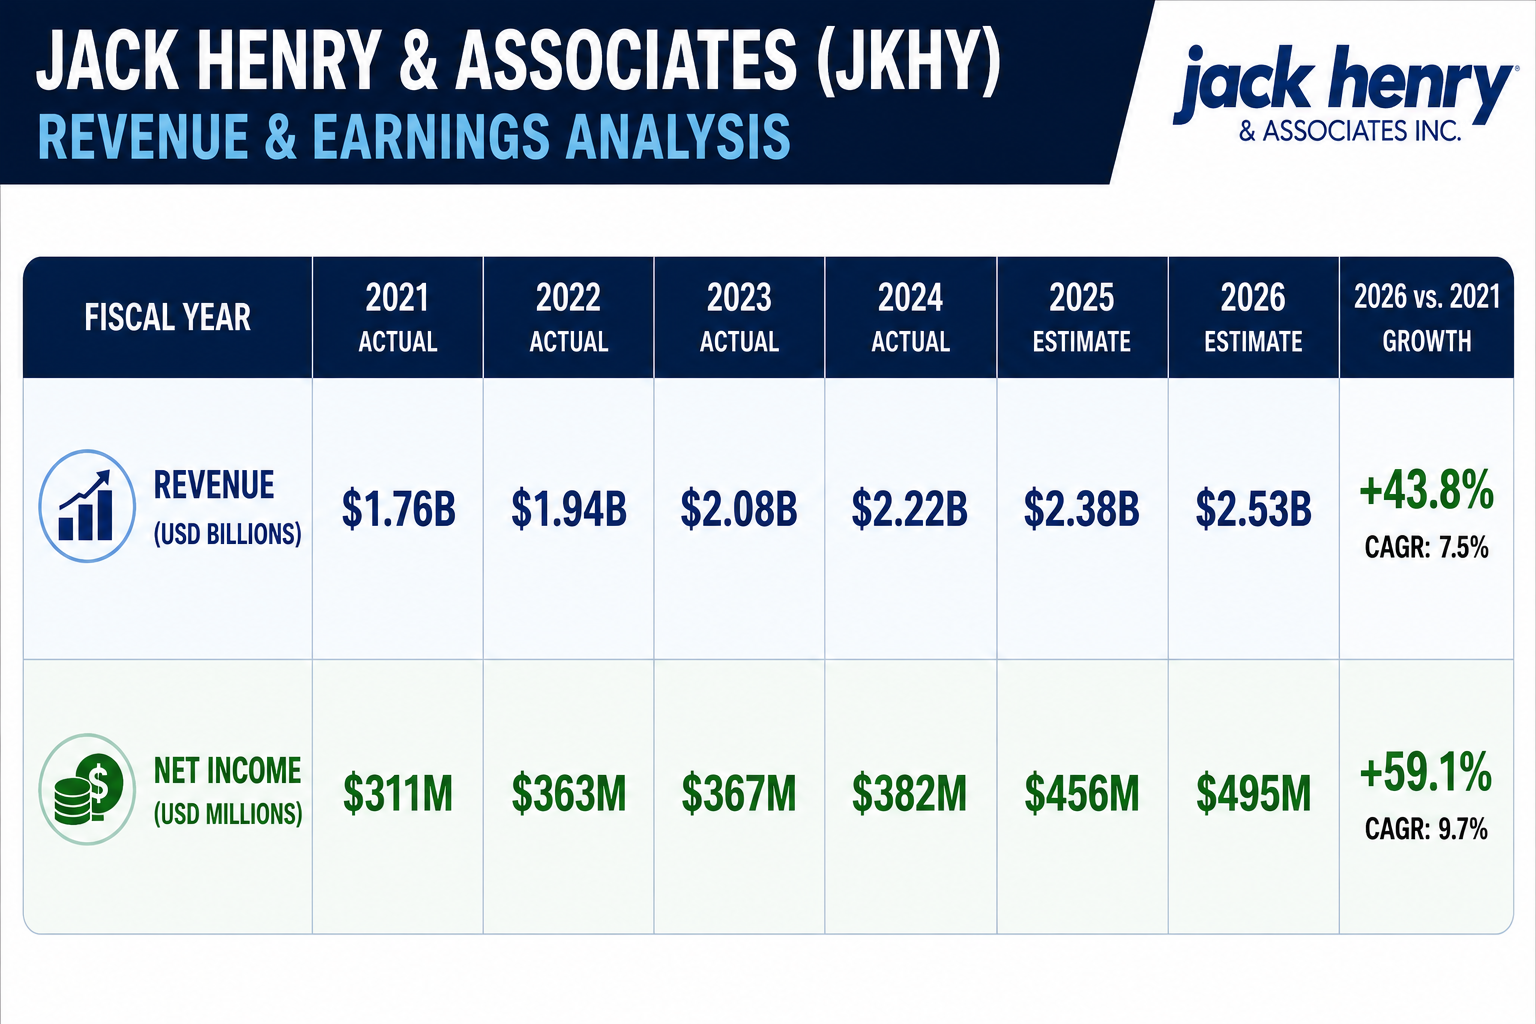
The first thing that stands out is consistency. Revenue has increased every year from $1.76 billion to an expected $2.53 billion in fiscal 2026. This is not the profile of a cyclical technology company. It is the profile of a business steadily expanding its customer relationships while generating dependable recurring revenue.
Earnings tell an even stronger story. Net income has climbed from approximately $311 million in 2021 to an estimated $495 million in 2026. Gross margins have gradually improved while operating income continues to expand, suggesting management is converting revenue growth into higher profitability rather than simply growing for growth’s sake.
For traders, these numbers matter because sustained earnings growth often supports sustained stock appreciation over longer time horizons. Wall Street currently expects another year of mid-single-digit revenue growth combined with double-digit EPS growth, indicating analysts believe management’s execution remains intact.
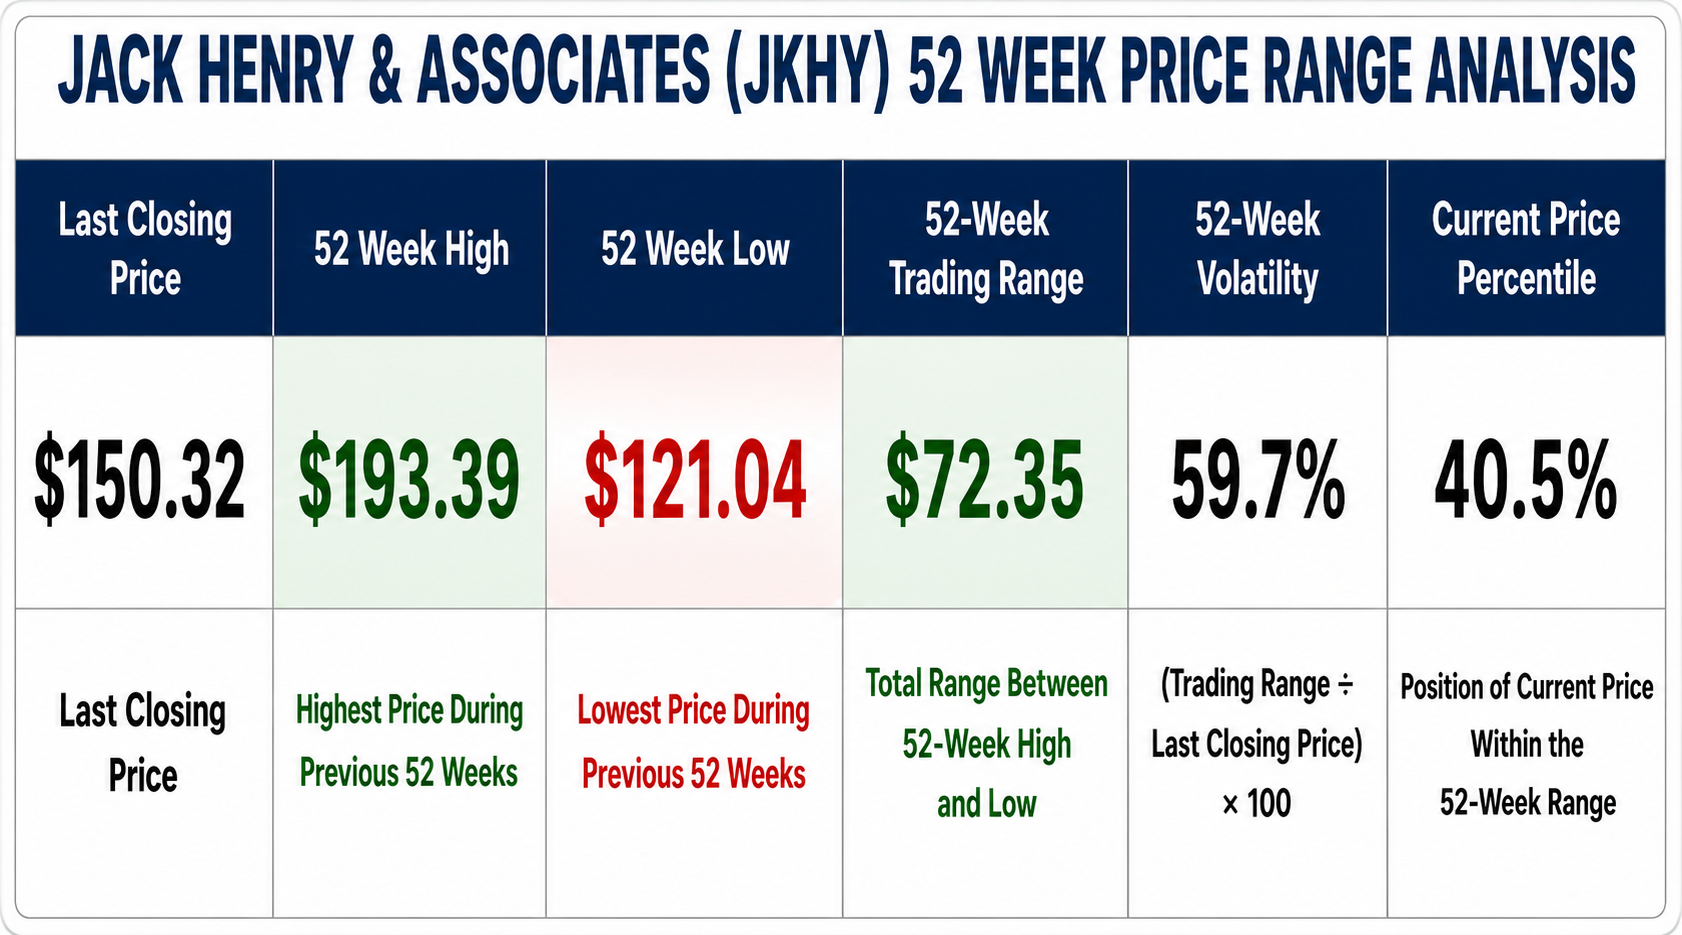
The first thing traders should notice is that JKHY is still trading well below its 52-week high despite a very strong rally over the past month. The stock has recovered dramatically from its June lows, but it remains nearly $43 below last year’s peak. That tells us this is a recovery story rather than a momentum stock making new highs.
The recent advance has been impressive. During the past several weeks the stock has rallied more than 25% from its June lows, one of the strongest short-term advances it has experienced over the past year. Looking at the one-year chart, every prior rally eventually encountered profit taking after gains ranging from roughly 10% to 30%. The current advance is approaching the upper end of that historical range, making the next several weeks particularly important.
The 40.5% percentile also provides useful perspective. Although the recent rally feels substantial, the stock is still trading in the lower half of its annual trading range. From a longer-term standpoint, buyers have repaired significant technical damage but have not yet regained full control of the larger trend.
Psychologically, this creates an interesting setup. Investors who purchased near last year’s highs are still underwater, meaning potential selling pressure could emerge as the stock continues recovering. Conversely, traders who recognized the June reversal are sitting on meaningful gains and may begin locking in profits after such a rapid advance. Those competing forces often produce periods of increased volatility before the next major directional move develops.
Best Case / Worst Case Analysis
The market is never obligated to continue doing what it has done recently. Every sustained advance eventually pauses, consolidates, or reverses. Likewise, sharp declines eventually exhaust themselves as selling pressure fades. The objective is not predicting the future with certainty, but understanding the range of probable outcomes so traders can manage risk intelligently.
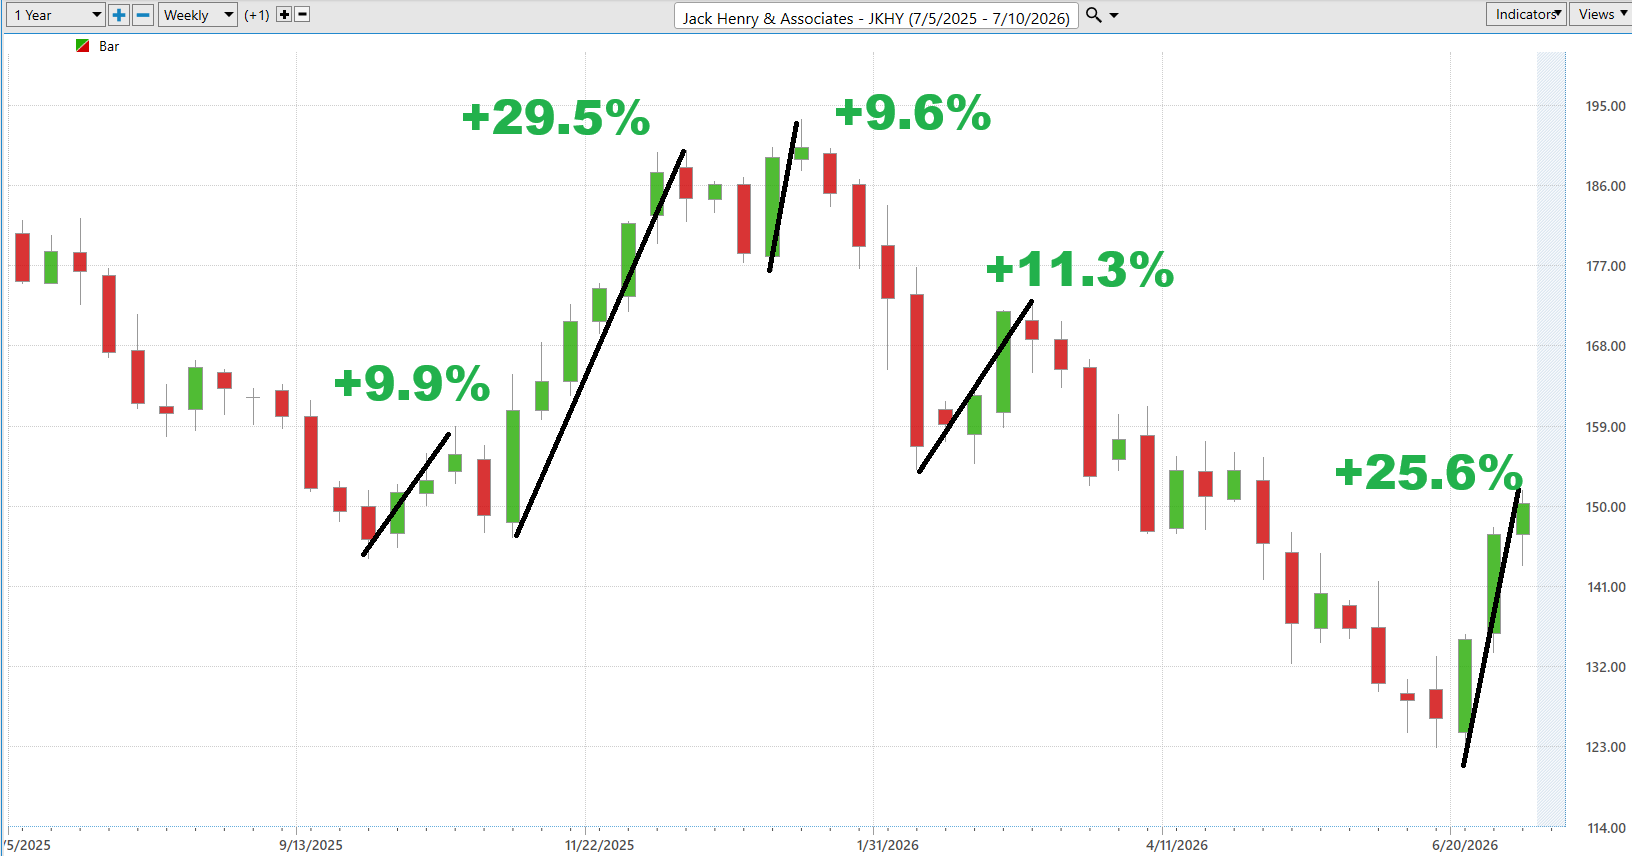
The best-case scenario is that the recent 25% advance represents the beginning of a much larger trend reversal rather than simply a sharp relief rally. Improving earnings expectations, strong recurring revenue, and continued demand for banking technology could encourage institutions to continue accumulating shares. A decisive move above the recent consolidation would likely attract additional momentum buyers while increasing the probability of an eventual challenge of the 52-week high near $193.
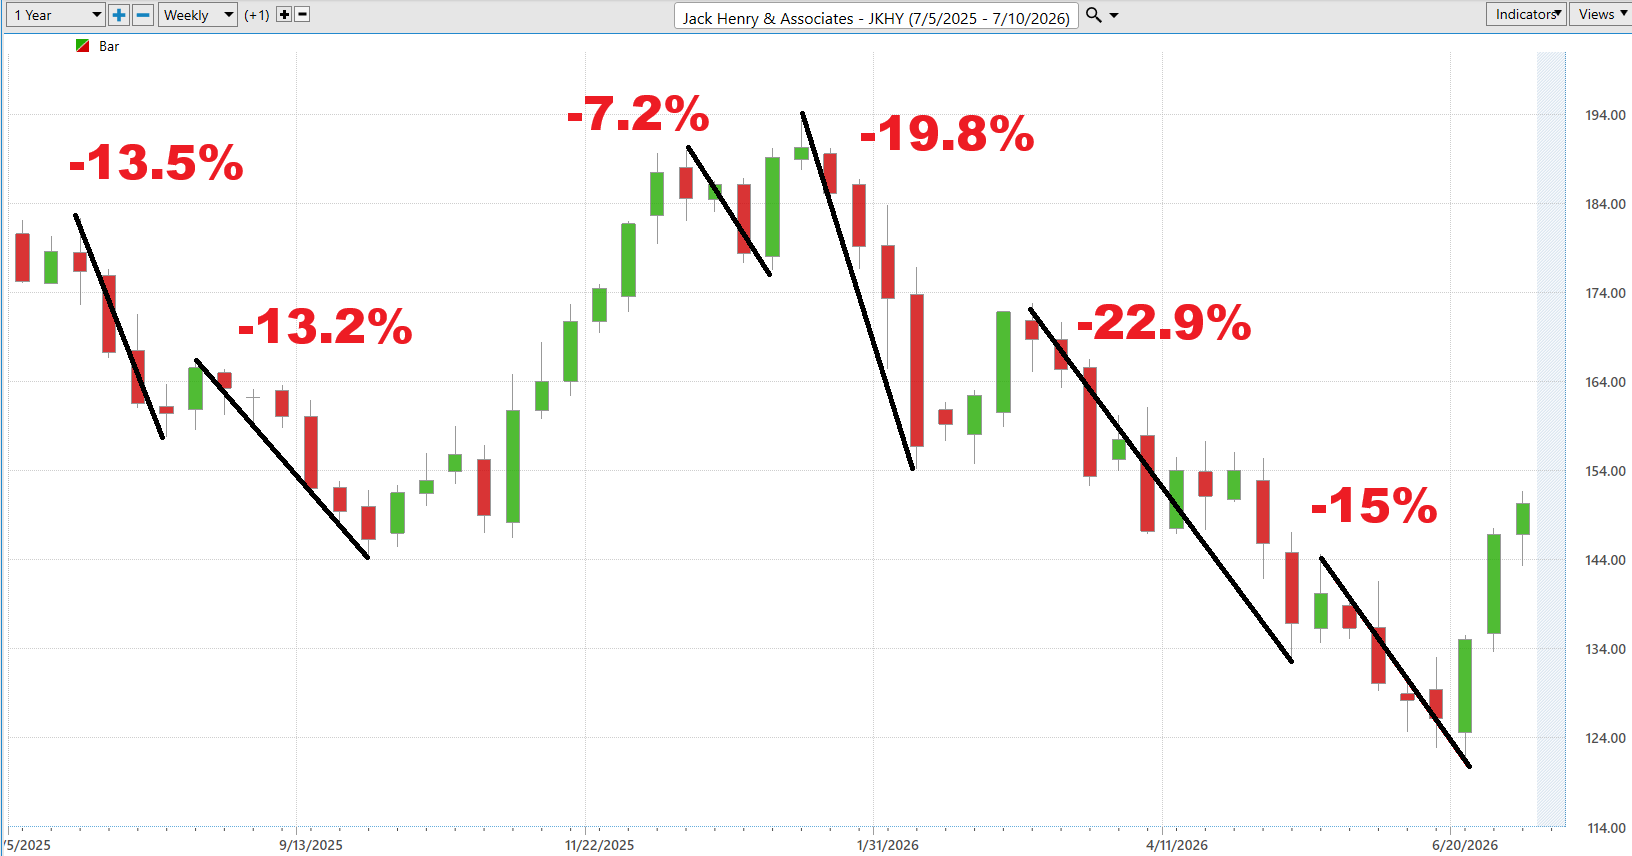
The worst-case scenario is that the recent rally proves to be an oversold bounce within a broader corrective trend. After such a rapid advance, profit taking would be entirely normal. Failure to hold recent gains could encourage sellers to test lower support levels before buyers regain confidence. This would not necessarily change the company’s long-term fundamentals, but it would remind traders that even high-quality businesses experience significant corrections.
The base case lies somewhere between those two extremes. The company continues producing consistent financial results, while the stock attempts to rebuild longer-term institutional sponsorship. A period of consolidation following such a strong advance would actually be healthy, allowing buyers and sellers to establish a new equilibrium before the next sustained move develops.
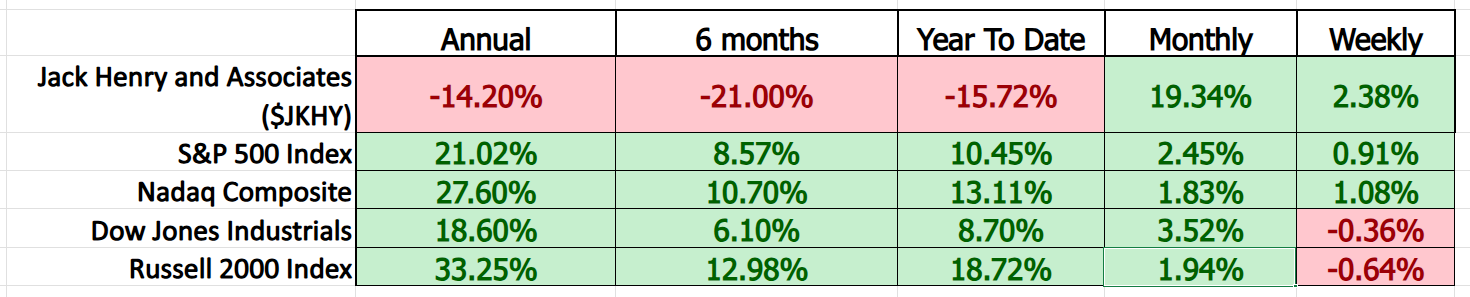
The comparison metrics tell two very different stories depending on the time horizon. Over the past month, Jack Henry has dramatically outperformed every major U.S. index. The stock has gained 19.34%, while the S&P 500 advanced just 2.45%, the Nasdaq gained 1.83%, and the Russell 2000 rose 1.94%. That is exactly the type of relative strength institutional traders look for when identifying emerging leadership.
The longer-term picture is considerably different. JKHY remains down 15.72% year to date, 21.0% over the past six months, and 14.2% over the past year, while every major index has posted positive returns. This tells us institutions have only recently begun rotating back into the stock after an extended period of underperformance.
This is often where important trend changes begin. Leadership rarely appears all at once. It usually starts with improving short-term relative strength while longer-term performance remains weak. If the monthly outperformance continues over the next several months, today’s laggard could gradually become tomorrow’s market leader. That is precisely why experienced traders monitor improving relative performance long before new 52-week highs are established.
VantagePoint AI Predictive Blue Line
The Predictive Blue Line is one of the clearest indicators of the market’s intermediate trend. Rather than reacting to yesterday’s price movement, it attempts to identify where trend direction is likely heading over the coming days. When the Predictive Blue Line is rising, it suggests buyers are gradually gaining control. When it begins falling, it often signals that institutional momentum is weakening.
Your VantagePoint chart currently shows a strongly rising Predictive Blue Line, confirming that the recent rally is more than a short-lived bounce. The slope has accelerated noticeably during the past several weeks, indicating that buying pressure has been persistent rather than sporadic. This is exactly what traders like to see during the early stages of a developing trend.
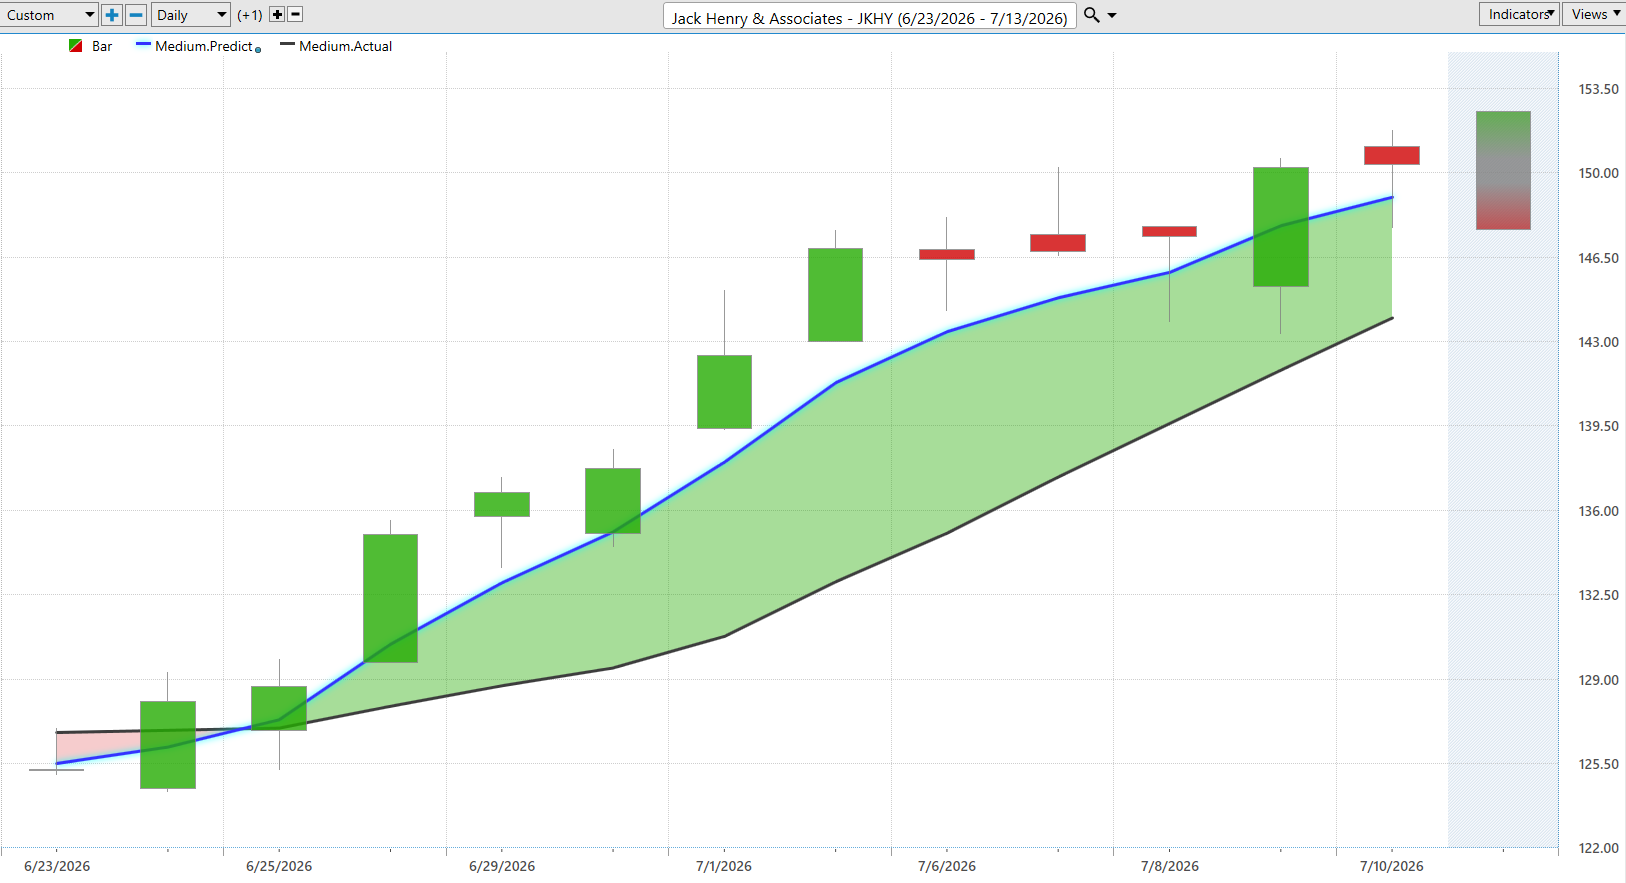
The most important takeaway is not simply that the Blue Line is moving higher. It is that price and the Predictive Blue Line are moving together, reinforcing one another. When predictive indicators confirm price action instead of diverging from it, the probability of trend continuation generally improves.
Going forward, traders should watch whether the Blue Line continues making higher highs and higher lows. As long as that pattern remains intact, the intermediate trend continues favoring buyers. A flattening or rollover in the Blue Line would be one of the earliest signs that momentum may be slowing.
VantagePoint AI Neural Index
The Neural Index measures short-term market probabilities over approximately the next 48 to 72 hours. Think of it as a weather forecast rather than a guarantee. It does not predict the size of a move. Instead, it estimates whether market conditions currently favor higher or lower prices.
The current Neural Index remains bullish, confirming the positive momentum reflected by the Predictive Blue Line. When both indicators point in the same direction, traders often refer to this as double confirmation. Rather than relying on a single indicator, multiple independent forecasts are reinforcing the same conclusion.
That does not mean every trading day will be positive. Short-term pullbacks are normal even within strong trends. What matters is that the underlying probabilities continue favoring buyers until the Neural Index begins consistently shifting negative.
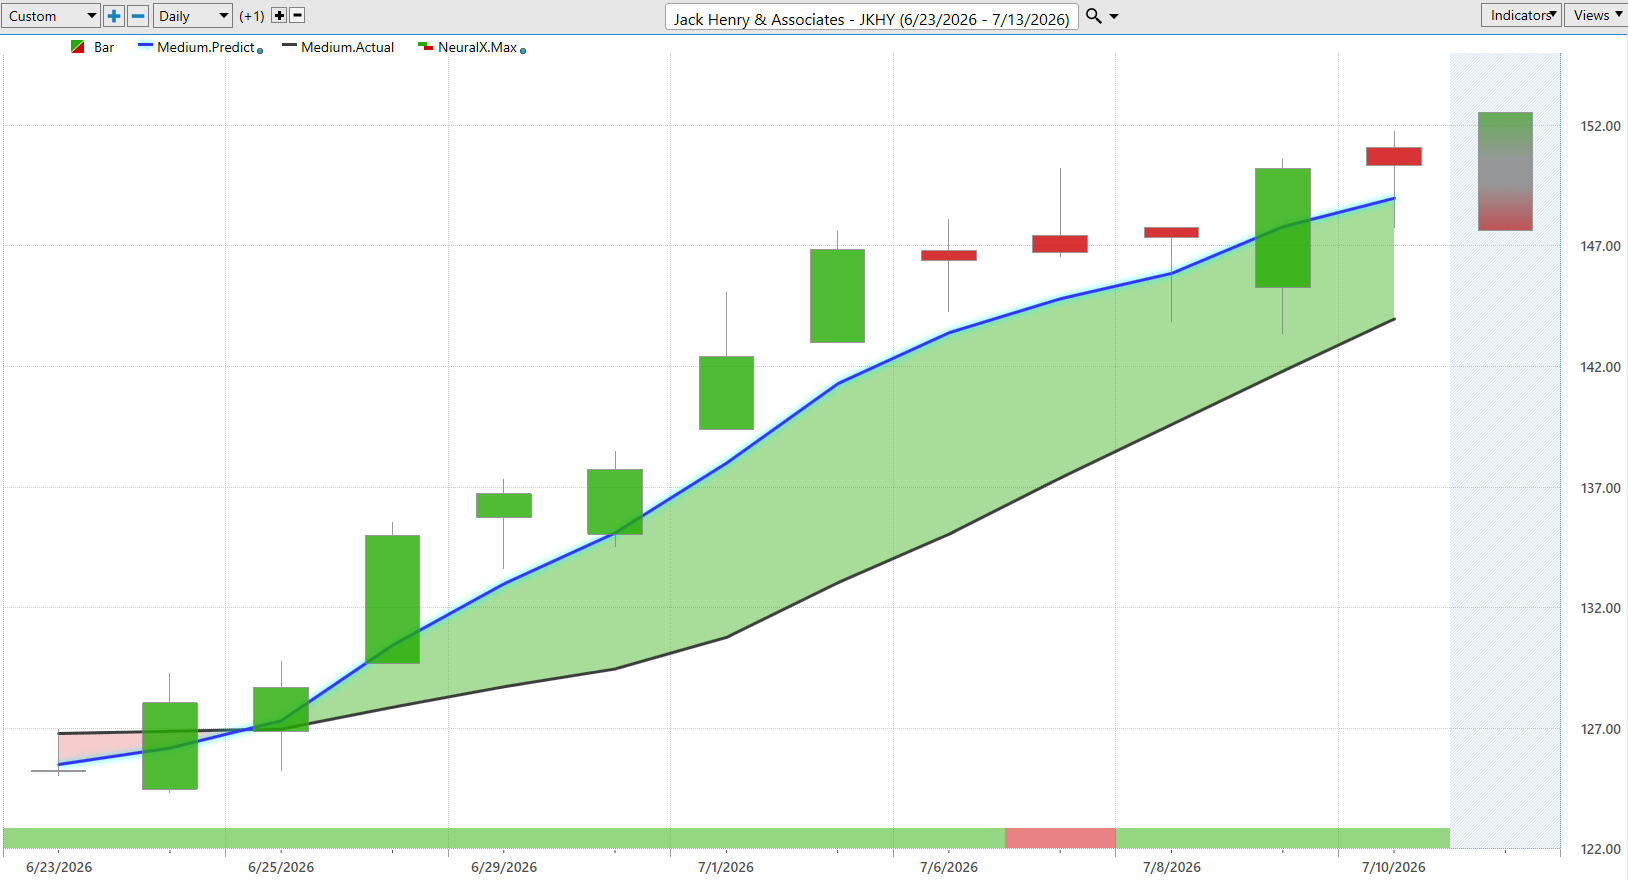
For active traders, this combination is significant. A rising Predictive Blue Line establishes the intermediate trend, while a positive Neural Index suggests that short-term momentum continues supporting that larger directional bias. Together they indicate that buyers currently retain the advantage.
VantagePoint AI Daily Range Forecast
The Daily Range Forecast measures expected trading volatility rather than direction. It provides traders with a forecasted daily ranges for each trading session. Understanding this expected range helps traders position themselves appropriately and avoid placing stops so close that normal market noise forces premature exits.
Jack Henry currently exhibits moderate daily volatility, reflecting its reputation as a high-quality institutional technology stock rather than a speculative momentum name. Daily price swings are large enough to create trading opportunities but generally remain well below the volatility seen in smaller technology companies.
One of the biggest mistakes traders make is focusing exclusively on direction while ignoring volatility. Position size, stop placement, and profit objectives should always reflect the stock’s normal trading behavior. A position that is too large can make even routine daily fluctuations feel emotionally overwhelming, often causing traders to exit winning trades prematurely.
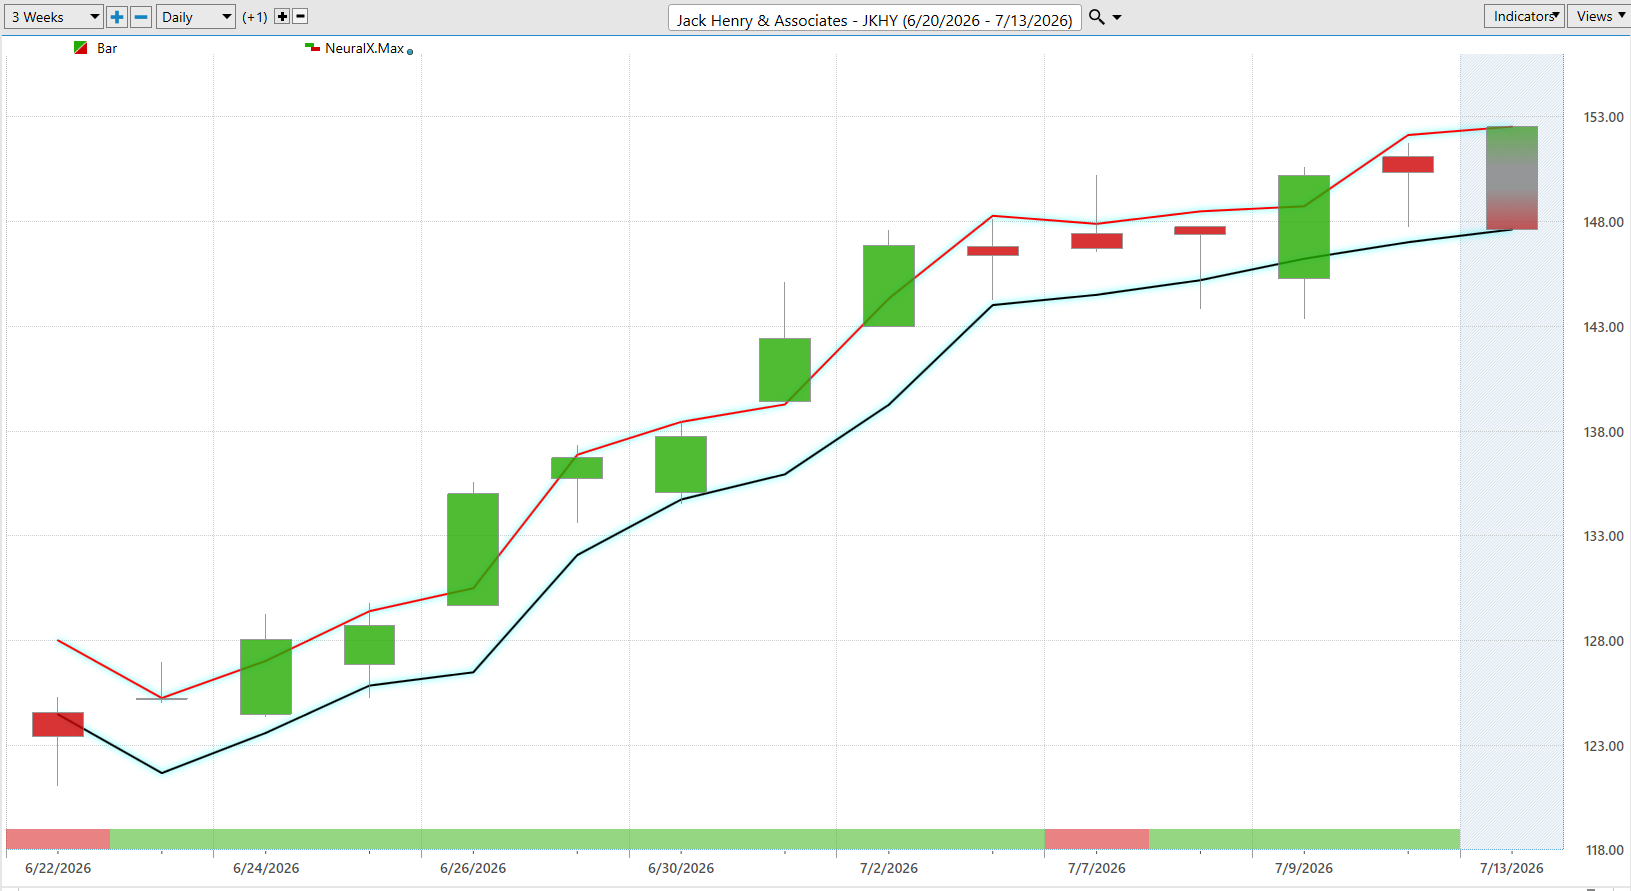
The current forecast suggests traders should expect healthy price movement while maintaining disciplined risk management. If daily ranges begin expanding while the overall trend remains positive, that often reflects increasing institutional participation. Conversely, expanding volatility accompanied by weakening trend signals can indicate growing uncertainty and deserve closer attention.
Our Suggestion
Jack Henry & Associates continues to demonstrate why it has earned a reputation as one of the highest-quality companies in the financial technology industry. Management has consistently expanded recurring revenue, improved profitability, and strengthened its competitive position by helping banks modernize their technology infrastructure. During recent earnings discussions, leadership emphasized continued investment in cloud migration, digital banking capabilities, payment solutions, and operational efficiency. Those priorities align with the long-term technology spending trends across community and regional financial institutions.
Wall Street’s expectations remain constructive. Analysts continue forecasting steady revenue growth and improving earnings over the next two fiscal years, reflecting confidence that management can continue executing its strategy. Investors will be watching the company’s next quarterly earnings release for evidence that payment processing volumes, cloud adoption, and software demand remain healthy. Meeting or exceeding those expectations would reinforce the current recovery. Missing those expectations could slow the stock’s recent momentum, particularly after such a sharp rally.
From a technical perspective, the picture has improved significantly. The stock has dramatically outperformed the broader market over the past month, the Predictive Blue Line continues trending higher, and the Neural Index remains supportive. Those are encouraging signs that institutional buyers have returned. At the same time, JKHY is still well below its 52-week high, reminding traders that this remains a recovery story rather than an established market leader.
The most important question over the coming months is whether this recent leadership persists. If Jack Henry continues outperforming the S&P 500 while earnings expectations remain intact, the probability of a sustained advance increases. If relative strength begins fading or management’s execution slows, traders should expect a period of consolidation before the next meaningful move develops. As always, successful trading is less about predicting the future and more about recognizing when the probabilities are shifting in your favor.
Ready to learn more about forecasting stocks and options days before anyone else with up to 87.4% proven accuracy? Attend a FREE LIVE CLASS.
It’s not magic.
It’s machine learning.
THERE IS A SUBSTANTIAL RISK OF LOSS ASSOCIATED WITH TRADING. ONLY RISK CAPITAL SHOULD BE USED TO TRADE. TRADING STOCKS, FUTURES, OPTIONS, FOREX, AND ETFs IS NOT SUITABLE FOR EVERYONE.IMPORTANT NOTICE!
DISCLAIMER: STOCKS, FUTURES, OPTIONS, ETFs AND CURRENCY TRADING ALL HAVE LARGE POTENTIAL REWARDS, BUT THEY ALSO HAVE LARGE POTENTIAL RISK. YOU MUST BE AWARE OF THE RISKS AND BE WILLING TO ACCEPT THEM IN ORDER TO INVEST IN THESE MARKETS. DON’T TRADE WITH MONEY YOU CAN’T AFFORD TO LOSE. THIS ARTICLE AND WEBSITE IS NEITHER A SOLICITATION NOR AN OFFER TO BUY/SELL FUTURES, OPTIONS, STOCKS, OR CURRENCIES. NO REPRESENTATION IS BEING MADE THAT ANY ACCOUNT WILL OR IS LIKELY TO ACHIEVE PROFITS OR LOSSES SIMILAR TO THOSE DISCUSSED ON THIS ARTICLE OR WEBSITE. THE PAST PERFORMANCE OF ANY TRADING SYSTEM OR METHODOLOGY IS NOT NECESSARILY INDICATIVE OF FUTURE RESULTS. CFTC RULE 4.41 – HYPOTHETICAL OR SIMULATED PERFORMANCE RESULTS HAVE CERTAIN LIMITATIONS. UNLIKE AN ACTUAL PERFORMANCE RECORD, SIMULATED RESULTS DO NOT REPRESENT ACTUAL TRADING. ALSO, SINCE THE TRADES HAVE NOT BEEN EXECUTED, THE RESULTS MAY HAVE UNDER-OR-OVER COMPENSATED FOR THE IMPACT, IF ANY, OF CERTAIN MARKET FACTORS, SUCH AS LACK OF LIQUIDITY. SIMULATED TRADING PROGRAMS IN GENERAL ARE ALSO SUBJECT TO THE FACT THAT THEY ARE DESIGNED WITH THE BENEFIT OF HINDSIGHT. NO REPRESENTATION IS BEING MADE THAT ANY ACCOUNT WILL OR IS LIKELY TO ACHIEVE PROFIT OR LOSSES SIMILAR TO THOSE SHOWN.