


[fusion_builder_container hundred_percent=”no” equal_height_columns=”no” menu_anchor=”” hide_on_mobile=”small-visibility,medium-visibility,large-visibility” class=”” id=”” background_color=”” background_image=”” background_position=”center center” background_repeat=”no-repeat” fade=”no” background_parallax=”none” parallax_speed=”0.3″ video_mp4=”” video_webm=”” video_ogv=”” video_url=”” video_aspect_ratio=”16:9″ video_loop=”yes” video_mute=”yes” overlay_color=”” video_preview_image=”” border_size=”” border_color=”” border_style=”solid” padding_top=”” padding_bottom=”” padding_left=”” padding_right=””][fusion_builder_row][fusion_builder_column type=”1_1″ layout=”1_1″ background_position=”left top” background_color=”” border_size=”” border_color=”” border_style=”solid” border_position=”all” spacing=”yes” background_image=”” background_repeat=”no-repeat” padding_top=”” padding_right=”” padding_bottom=”” padding_left=”” margin_top=”0px” margin_bottom=”0px” class=”” id=”” animation_type=”” animation_speed=”0.3″ animation_direction=”left” hide_on_mobile=”small-visibility,medium-visibility,large-visibility” center_content=”no” last=”no” min_height=”” hover_type=”none” link=””][fusion_text]
How High Is Too High? A Look Inside the Tech Bubble
One of the great challenges of investing and trading is developing a method of valuation and timing that determines what you should buy and sell. While there are thousands of books written related to this topic, many of the individual valuation techniques appear completely irrelevant in todays markets. There are literally hundreds of metrics that investors utilize to try and define fair value in the marketplace. In spite of all of these tools, fundamental analysis today is more treacherous than ever. It appears that the metrics of yesteryear often will only communicate how overvalued an asset is, only to see the asset march significantly higher.
The other great challenge of analysis is how time consuming it is and then wondering if you have correctly evaluated all of the important factors. Is it possible to take into account all the elements which make up the current economy? Specifically, I am referring to negative interest rates and a monetary policy which has created new stimulus at a pace we have never seen before.
The reality is that we have entered into the most turbulent period in US history. In just the opening seven months of this year, we have witnessed that the 2020s have proven to be far more volatile than any other time in the last 100 years.
Major crises are brewing on multiple fronts and converging.
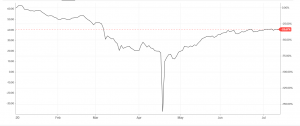
We are looking at an EVERYTHING BUBBLE that is creating major whirlwinds in the financial markets. This tsunami has encompassed stocks, real estate, fiat currencies and bonds. If you question this just simply look at the chart of the Crude Oil market over the last 4 months. It went from $50 to negative $38 and then back to $40.
This has all occurred for a number of reasons, but primarily because governments have printed trillions of new currency units, brought interest rates below zero and bailed out failing institutions while we have witnessed the OPEC cartel fail.
This is going to be an incredibly volatile time for retirees, savers and investors.
One of the greatest investors of all time was Sir John Templeton who was famous for reminding investors that the most expensive words in investing were, “this time it’s different.” Templeton was an avid contrarian and value investor who made a huge fortune by positioning his funds based on long standing value principles.
In 1999, Templeton famously predicted that most of the high flying internet companies would be bankrupt within five years. He very publicly shorted the U.S. tech sector and received ridicule from numerous hedge fund managers. His positions went against him initially. But by March 2000, Templeton’s short position against the dot-com stocks looked ingenious. He had made over $100 million in a matter of months.
It’s an amazing irony that John Templeton – a long term international value investor celebrated for uncovering little-known global opportunities – made his quickest fortune by shorting U.S. stocks during the tech bubble twenty years ago.
In the 1990’s as the internet began to blossom, investors considered “tech” to be different. Innovation was rampant and people began carrying around global communication portals in their pockets. This phenomena was so different that it literally had its own exchange called NASDAQ into whom investors poured trillions of dollars. Then it all collapsed when investors began to recognize that they were looking at a tech “bubble.”
One of the most profound events that expedited the tech bubble burst was a pronouncement by Scott McNeely, then CEO of Sun Microsystems commenting on the value of his company’s stock.
What makes this statement so unique and historic, is that often CEO’s are compensated partially upon the performance of their stock price. McNeely went completely against the entire grain of Silicon Valley when he offered an interview to Bloomberg and stated the following:
“At 10 times revenues, to give you a 10-year payback, I have to pay you 100% of revenues for 10 straight years in dividends. That assumes I can get that by my shareholders. That assumes I have zero cost of goods sold, which is very hard for a computer company. That assumes zero expenses, which is really hard with 39,000 employees. That assumes I pay no taxes, which is very hard. And that assumes you pay no taxes on your dividends, which is kind of illegal. And that assumes with zero R&D for the next 10 years, I can maintain the current revenue run rate. Now, having done that, would any of you like to buy my stock at $64? Do you realize how ridiculous those basic assumptions are? You don’t need any transparency. You don’t need any footnotes. What were you thinking?”
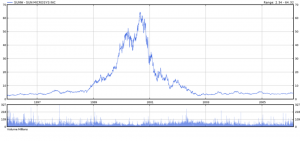
Below is a chart of Sun Micro from 1996 to 2006. It started around $5 ran up to that $64 a share and eventually crashed. Sun Microsystems was eventually purchased by Oracle at $9.50 per share or 1 ½ times sales. McNeely clearly was communicating at the time that at $64 a share the tech bubble was destined to return towards a more normal valuation level.
Market capitalization and revenue are two of the most prominent benchmarks of a company’s financial strength and performance. Investors and analysts use both to compare the valuation of one company to another. Market cap measures the value of a company’s stock, while revenue reflects a company’s sales. It is believed that when you divide Market Cap by Sales, the metric can be quite valuable in keeping investors out of horribly overvalued situations. A high price to sales ratio, which McNeely was warning against, indicates that investors are paying a huge multiple for $1 dollar of sales.
If you purchase a stock that is generating $1 of revenue for $10, the belief is that you are clearly overpaying. Fair value is usually believed to be between 1 to 2 times revenue for a value stock.
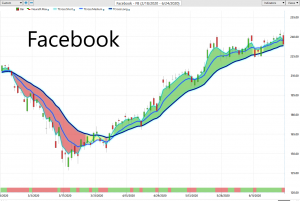
However, when we apply this exact same insight to FAANG stocks (Facebook, Amazon, Apple, Netflix and Google) it clearly does not hold true.
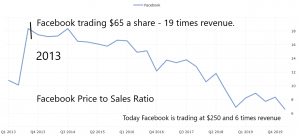
In 2013, Facebook was trading at 19 times revenue and $65 a share. This is almost twice as high as what Scott McNeely considered ridiculous at the peak of the dot-com bubble. Clearly, this would be considered nosebleed levels. Yet in spite of this ridiculous valuation, Facebook has gone on to generate an additional 300% returns in the last 7 years and is still considered traditionally overvalued by this benchmark today at $250 a share since it is trading at 6 times revenue.
Here is a chart of Facebooks Price to Sales Ratio from 2013 to present.
What’s more fascinating, as we find ourselves in the middle of the strangest economic crisis in modern history, there are 37 stocks in the S&P 500 that are trading above ten times revenues today. That is roughly 7% of the S&P 500 Index.
Today, more than ever, you need to have a historically tested and accurate method of knowing what is worth buying and selling. In the absence of this knowledge you are embracing risk and rolling the dice with your heard earned dollars.
When the uneducated look at price they only see the price quote which is usually a ratio denominated in dollars per share. Savvy traders on the other hand, look at benchmarks that compare the price of a stock to a important historical marker, that helps determine when something is cheap and when it is expensive. When these historical markers are approached a smart trader will place these companies on their radar and patiently wait for the opportunity to strike.
The important historical markers which have always defined value in the stock market are:
Price to Earnings Ratio
Price to Earnings Growth Ratio
Price to Sales Ratio
Price to Free Cash Flow
Valuation metrics are invaluable in assessing stocks to invest in. These ratios are by no means failproof, but they can give you an idea of whether a stock is trading at a huge premium or discount to its fair value based on profitability, growth, and its balance sheet. Investors study these metrics to determine value. Investors often will examine and compare the price of a company to its cash flow or debt to understand the financial pressures a company might be facing.
Traders on the other hand are only interested in short term time frames where extremes can be exploited for quick gain.
And herein lies the tremendous opportunity for traders using artificial intelligence. When investors become convinced that “this time is different” that long-standing investment principles–such as value, discipline and diversification–no longer apply, the result is usually tragically expensive for their portfolios.
The volatility we have witnessed so far in 2020 has devastated most retirees, savers and investors. Following conventional advice is likely a recipe for negative returns. The average person has seen their nest egg decimated as financial wealth evaporates. But Power Traders focusing only on short term trends in the FAANG stocks have done amazingly well.
That’s why you have to decide—right now—how you’re going to play your cards.
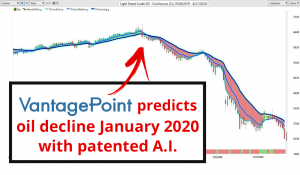
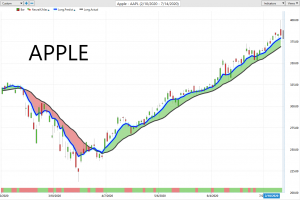
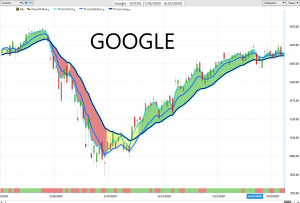
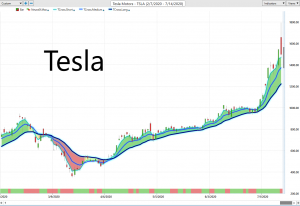
The following charts illustrate how Vantagepoint Power Traders READ the price action to anticipate tomorrows headline NEWS. More importantly, look at how the artificial intelligence kept traders on the right side of the downtrend every step of the way.
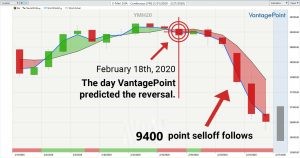
This is the power of artificial intelligence in action.
This is what makes Artificial Intelligence so powerful and unique.
Whether you are applying it to a broad market index like the S&P 500 Index and the Dow Jones Industrials or to an Individual FAANG stock.
Machine Learning is designed to learn from experience and make the best statistically relevant decision moving forward. AI outperforms humanoid analysis hands down every time.
We live in very exciting times.
Consider that the recent stock market implosion has erased trillions of dollars from cumulatively from people trading accounts. However, it has made a handful of traders fabulously wealthy.
Debates will continue for hundreds of years as to why the recent implosions occurred. However, the only thing a great trader is concerned with is PRICE.
Stories are designed to capture the imagination. Traders need to focus on the probabilities of making the right move at the right time
Remember, artificial intelligence has decimated humans at Poker, Jeopardy, Go! and Chess. Why should trading be any different?
Sadly, John Templeton passed away in 2008. While I am not certain he would abandon his value based principles to buy these FAANG stocks at current valuations, I do feel certain that he would feel very comfortable in waiting for the artificial intelligence to let him know when he should short them.
Intrigued?
Visit with us and check out the a.i. at our Next Live Training.
Discover why artificial intelligence is the solution professional traders go-to for less risk, more rewards, and guaranteed peace of mind.
It’s not magic. It’s machine learning.
Make it count.

[/fusion_text][/fusion_builder_column][/fusion_builder_row][/fusion_builder_container]


