




Every election cycle, Wall Street asks the same question: Who will win? Smart traders ask a different one: Who controls the flow of money?
Campaign speeches dominate the headlines. Poll numbers dominate the news cycle. Presidents are praised when stocks rise and blamed when they fall. Yet history tells a far more interesting story. Since the Federal Reserve was established in 1913, the United States has endured world wars, depressions, inflation, financial crises, pandemics, and dozens of election cycles. Administrations have come and gone. Political parties have traded power. Bull markets and bear markets have ignored party lines with remarkable consistency.
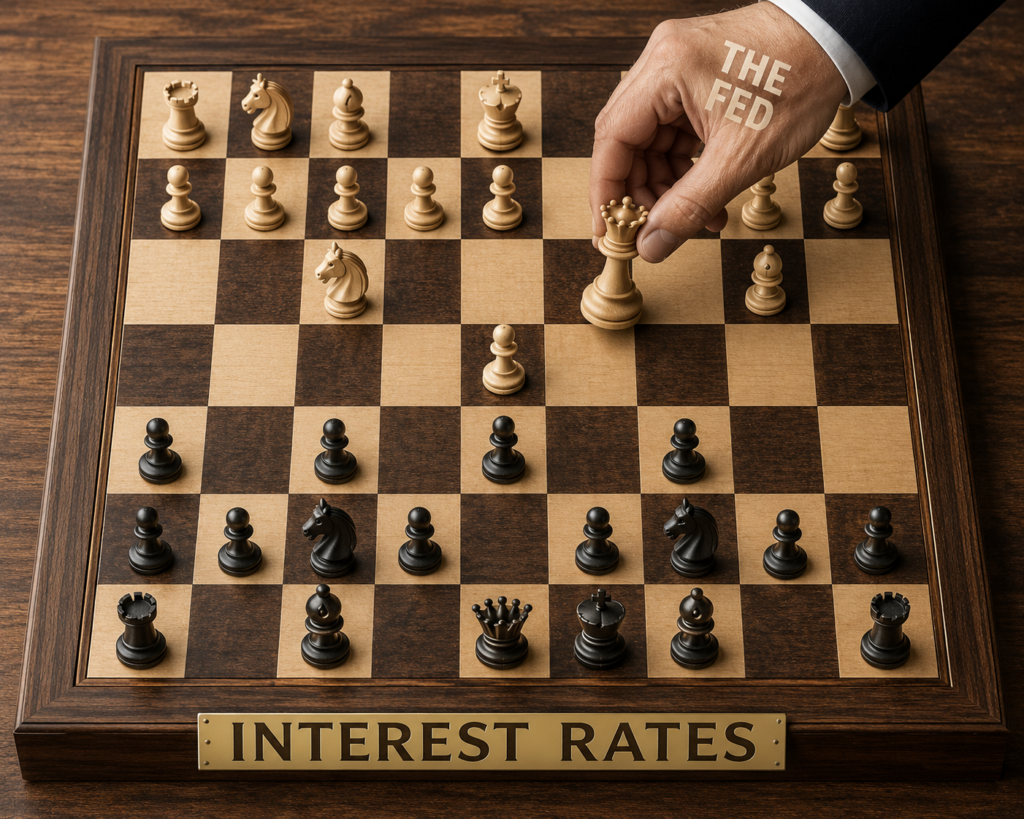
Imagine a poker table. One player controls the cards. Another writes the rules. A third decides how many chips every player receives. Which one has the greatest influence over the outcome? Financial markets work much the same way. Politicians shape fiscal policy. Investors decide where to allocate capital. But the Federal Reserve influences the cost and availability of money itself. That makes liquidity, the oxygen of every financial market. When it is abundant, risk-taking flourishes. When it becomes scarce, even the strongest stories begin to unravel.
Markets do not run on politics alone. They run on money. More precisely, they run on the availability and price of money. Every election season brings a fresh wave of predictions, promises, and partisan arguments. Most of them will be forgotten within a year. Liquidity will not. It quietly influences borrowing, spending, investing, corporate profits, asset valuations, and ultimately the direction of stocks.
As the midterm elections approach, traders should resist the temptation to become political forecasters. The better question is not who will occupy the next seat of power. The better question is whether financial conditions are about to become easier or tighter. History suggests that campaigns create headlines, politicians create expectations, the Federal Reserve shapes financial conditions, and liquidity determines how much capital is willing to chase opportunity.
The greatest fortunes on Wall Street have rarely been made by correctly predicting elections. They have been made by correctly identifying where money was flowing before everyone else noticed. That is the real playbook for navigating election years. And it begins not with politics, but with liquidity.
If politicians truly controlled the stock market, every election would end with confetti falling from the ceiling of the New York Stock Exchange and every campaign manager would retire to a private island funded by perfect market timing. Instead, we get something much less impressive: politicians taking victory laps during bull markets and pointing fingers during bear markets.
It’s one of Washington’s oldest traditions. When stocks rise, the administration of the day declares its economic genius has finally been recognized. When stocks fall, the explanation suddenly becomes much more creative. It’s the previous administration. It’s foreign governments. It’s speculators. It’s greedy corporations. It’s the weather. Almost anything except the uncomfortable possibility that financial markets are vastly more complicated than campaign slogans.
History has little patience for political storytelling. The powerful bull market that began in the early 1980s didn’t politely end because a new administration arrived. The extraordinary rally of the late 1990s wasn’t powered by campaign speeches. The financial crisis of 2008 didn’t ask which party controlled Congress before dismantling balance sheets around the world. The pandemic of 2020 shut down the global economy without consulting pollsters, and the inflation shock of 2022 reminded everyone that markets have a remarkable ability to ignore political talking points when confronted with economic reality.
Markets operate on a much larger stage than elections. They respond to corporate earnings, the cost of borrowing, the availability of liquidity, inflation, productivity, innovation, and perhaps most unpredictably, investor psychology. Fear and greed have never registered with a political party, yet they have influenced every major market cycle in modern history.
This doesn’t mean politics is irrelevant. Elections shape fiscal policy, taxation, regulation, and government spending. Those decisions matter. But they are only a few actors in a cast that includes central bankers, corporate executives, consumers, entrepreneurs, lenders, and millions of investors making independent decisions every day. Reducing the stock market to a presidential report card is like explaining the tides by blaming the moon for getting wet.
The lesson for traders is surprisingly simple. Respect politics, but don’t worship it. Markets are too large, too global, and too interconnected to be driven by a single election or a single politician. Presidents may influence the scenery, but the market is performing on a much bigger stage. The traders who consistently outperform are usually the ones watching the flow of capital instead of the evening news.
If the stock market has a heartbeat, the Federal Reserve doesn’t control every beat, but it does have enormous influence over the circulation that keeps the system alive.
That distinction matters.
Many investors imagine the Fed as an organization that simply “raises” or “lowers” interest rates a few times each year. In reality, its influence extends much further. The Federal Reserve shapes the cost of borrowing, the amount of reserves in the banking system, the availability of credit throughout the economy, and ultimately the level of liquidity moving through financial markets. Those decisions ripple through everything from mortgage rates and business investment to corporate earnings and stock valuations.
A simple analogy helps explain why.
Think of the American economy as a powerful engine.
Businesses are the cylinders. Consumers are the drivers. Entrepreneurs are constantly pressing the accelerator, searching for new opportunities. Investors decide where the vehicle should travel. But the Federal Reserve controls something every engine depends on: the fuel.
It doesn’t decide every destination.
It doesn’t determine every turn.
It doesn’t choose every driver.
But it has extraordinary influence over how much fuel is available to keep the engine running.
When borrowing becomes less expensive and liquidity is plentiful, businesses find it easier to invest, consumers are more willing to spend, lenders become more accommodating, and investors are often willing to assume greater risk. Capital flows more freely, confidence grows, and financial assets frequently benefit.
When financial conditions tighten, the opposite tends to occur. Credit becomes more expensive. Lending standards often become stricter. Companies postpone expansion plans. Consumers become more cautious. Investors begin demanding higher returns to justify taking risk. The flow of money slows, and markets often reflect that change long before the broader economy does.
This is why experienced traders devote so much attention to the Federal Reserve. They are not merely watching for the next quarter-point move in interest rates. They are trying to determine whether financial conditions are becoming more supportive or more restrictive. They understand that markets are forward-looking mechanisms, constantly attempting to price tomorrow’s liquidity rather than today’s headlines.
The Federal Reserve cannot guarantee prosperity, prevent every recession, or dictate the direction of every stock. But by influencing the price and availability of money, it exerts a powerful force on the financial system. For traders, understanding that distinction is essential. The most consequential question is rarely, “What did the Fed do today?” More often, it is, “What does today’s decision suggest about the future availability of capital?”
Everything we’ve discussed so far raises an obvious question: If liquidity is so important, how do you actually measure it? Fortunately, you don’t have to guess. The Federal Reserve publishes one of the most revealing charts in finance every Thursday afternoon.
The Federal Reserve keeps a balance sheet just like any business. On that balance sheet are Treasury securities, mortgage-backed securities, emergency lending programs, and other assets the Fed has purchased over time. Economists call it the Fed’s balance sheet. Traders should think of it as a rough gauge of the amount of liquidity the Federal Reserve has injected into the financial system. Fortunately, you don’t have to guess whether liquidity is expanding or contracting. The data is published every week. The challenge isn’t finding it. It’s knowing which gauges matter
This chart won’t tell you where the S&P 500 will be next month. It tells you whether the Federal Reserve is making money easier or harder to find. You can access The Fed Balance Sheet directly in the future here,
That’s the real purpose of the chart. It doesn’t predict stock prices directly—it tells you whether the liquidity backdrop is becoming more supportive, less supportive, or largely unchanged. Right now, the message is that the period of aggressive liquidity withdrawal appears to have moderated, but the Fed has not returned to the kind of large-scale liquidity expansion seen during the Global Financial Crisis or the pandemic.
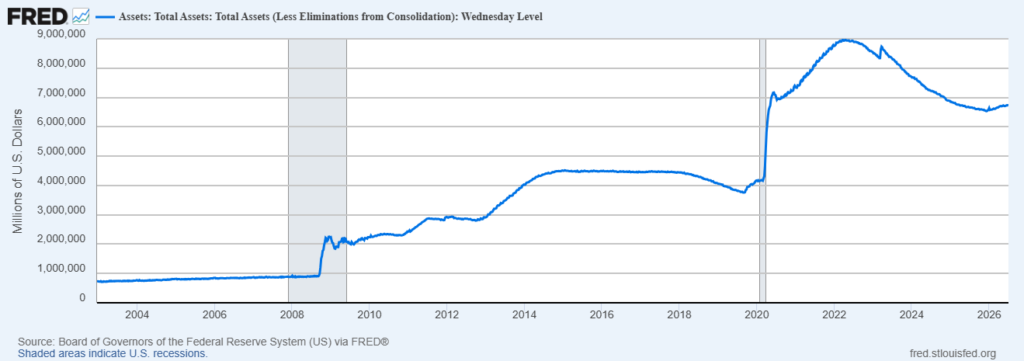
One of the easiest ways to understand the Federal Reserve’s balance sheet is to forget the technical jargon and imagine something much simpler. Picture the Fed holding a giant bucket of money. When that bucket gets bigger, the Federal Reserve is adding money to the financial system. When the bucket gets smaller, it is taking some of that money back out. That’s the entire story this chart is trying to tell.
The first dramatic increase came during the financial crisis of 2008. Banks were struggling, credit markets were freezing, and confidence was disappearing. The Federal Reserve stepped in and poured enormous amounts of money into the financial system to keep it functioning. Then came 2020. As the COVID pandemic brought much of the global economy to a standstill, the Fed responded even more aggressively, adding trillions of dollars to stabilize businesses, support financial markets, and prevent the economy from spiraling into a deeper crisis. The bucket became larger than at any point in modern history.
But emergency measures are not meant to last forever. As the economy recovered, inflation surged and prices rose at the fastest pace in decades. The Federal Reserve concluded that too much money was chasing too few goods and services. Its response was to begin shrinking the bucket. Instead of continuing to add liquidity, it gradually allowed money to leave the financial system. That is why the chart trends lower beginning in 2022.
More recently, however, something subtle has changed. The decline has slowed, and the balance sheet has begun to edge slightly higher. Observe the slope of the line at present and how it is beginning to curve higher. That does not necessarily mean the Federal Reserve has returned to the extraordinary money creation that defined the pandemic. A better analogy is driving a car. Over the past few years, the Fed has had its foot on the brake, slowing the economy by removing liquidity. Today, it appears to be easing up on that brake. It is not stepping on the accelerator again, but it is no longer slowing the vehicle as aggressively as before.
For traders, that distinction matters. This chart suggests the Federal Reserve is no longer flooding the financial system with new money, but it also is not removing liquidity at the same pace it was a year ago. In other words, the liquidity environment appears to be stabilizing. And in markets, sometimes the most important signal isn’t that policy has changed dramatically, it’s that the direction of policy has begun to change.
The easiest way to remember this chart
When the line goes UP, the Fed is adding money. 🟢
When the line goes DOWN, the Fed is taking money away. 🔴
When the line goes FLAT, the Fed isn’t changing much. 🟡
That’s really all a trader needs to remember. Every time you look at this chart, ask one question:
“Is the Fed filling the bucket, emptying the bucket, or leaving it about the same?”
The second chart that is important to understand is the chart of M2 Money supply. You can access the M2 Money Supply chart directly in the future here.
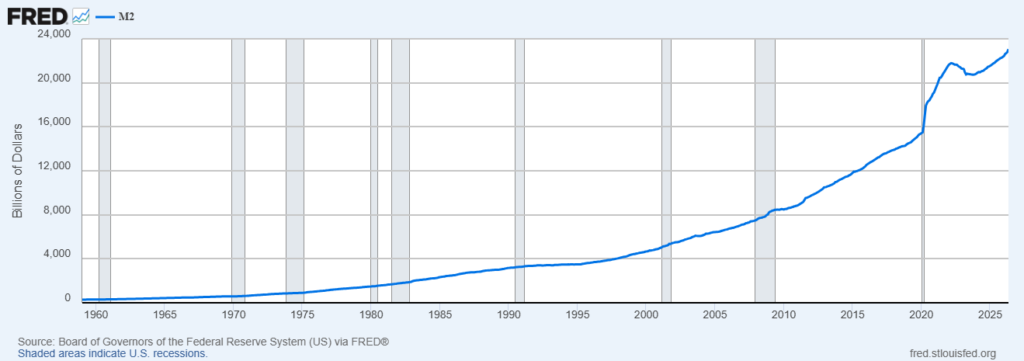
Imagine the American economy as one giant neighborhood. Every family has a wallet, every business has a cash register, and every bank has money ready to lend. Now imagine adding up all of the money that people and businesses can easily spend. That’s exactly what this chart measures. Economists call it the M2 Money Supply, but you can think of it as the economy’s checking account. The bigger the checking account, the more money there is available to buy homes, invest in businesses, purchase stocks, or simply spend.
For most of the past sixty years, this line moved steadily higher. That’s exactly what you would expect. As the country grows, more people work, businesses expand, and more money naturally circulates throughout the economy. Then something extraordinary happened in 2020. The line suddenly shot almost straight up. The pandemic brought much of the economy to a halt, and the Federal Reserve, along with the federal government, responded with unprecedented support. Trillions of dollars entered the financial system through stimulus programs, emergency lending, and other measures designed to keep the economy functioning. The result was the fastest increase in the money supply in modern American history.
That surge had consequences. With far more money circulating, consumers had greater spending power, businesses had easier access to credit, and investors had more cash available to buy financial assets. At the same time, however, more money was competing for a limited supply of goods and services. Prices began rising rapidly, helping fuel the highest inflation the United States had experienced in decades.
Today, the chart tells a more balanced story. The explosive growth has ended, but the money supply remains far above where it stood before the pandemic. Think of filling a swimming pool with a fire hose. During COVID, the water rushed in at full speed. Today, the fire hose has been turned off, but the pool is still nearly full. There is still a tremendous amount of money circulating throughout the economy, even though new money is being added much more slowly.
For traders, that distinction matters. The era of extraordinary monetary stimulus has largely passed, but the economy is still operating with a historically large supply of money. That means liquidity has not disappeared. Instead, it has shifted from expanding rapidly to growing at a much more normal pace. Going forward, the next major move in this chart will be worth watching. If the line begins accelerating sharply again, it could signal that liquidity is becoming more abundant. If it begins flattening or declining, it may indicate that financial conditions are becoming tighter.
The lesson is surprisingly simple. This chart answers one question: How much money is available in the economy? Right now, the answer is, a lot. There is still plenty of money flowing through the financial system. The difference is that the flood has become a stream. For traders, understanding that change helps explain why markets today are being driven less by emergency stimulus and more by earnings, economic growth, and where investors decide to put their money next.
The simplest way to think about this is similarly to the previous analogy.
M2 Money Supply
🟢 GREEN LIGHT The line is rising steadily. More money is flowing through the economy. This is generally good for liquidity.
🟡 YELLOW LIGHT The line is mostly flat. The amount of money isn’t changing very much. Liquidity is stable, and the economy is relying more on business growth than on new money being created.
🔴 RED LIGHT The line is falling. Money is leaving the economy faster than it is being added. This is generally bad for liquidity because there is less money available to support spending, lending, and investing.
Where Are We Today?
🟢 Light Greenish Light on both the Fed balance sheet and the M2 Money Supply , Sloping higher.
The money supply is still growing, but much more slowly than it did during the pandemic. The flood of new money has ended, but the amount of money already in the economy remains historically high.
What this means for traders:
The economy still has plenty of fuel, but the Fed is no longer filling the tank as aggressively. Markets are less likely to be driven by easy money alone and more likely to reward companies with strong earnings, growing sales, and durable business models.
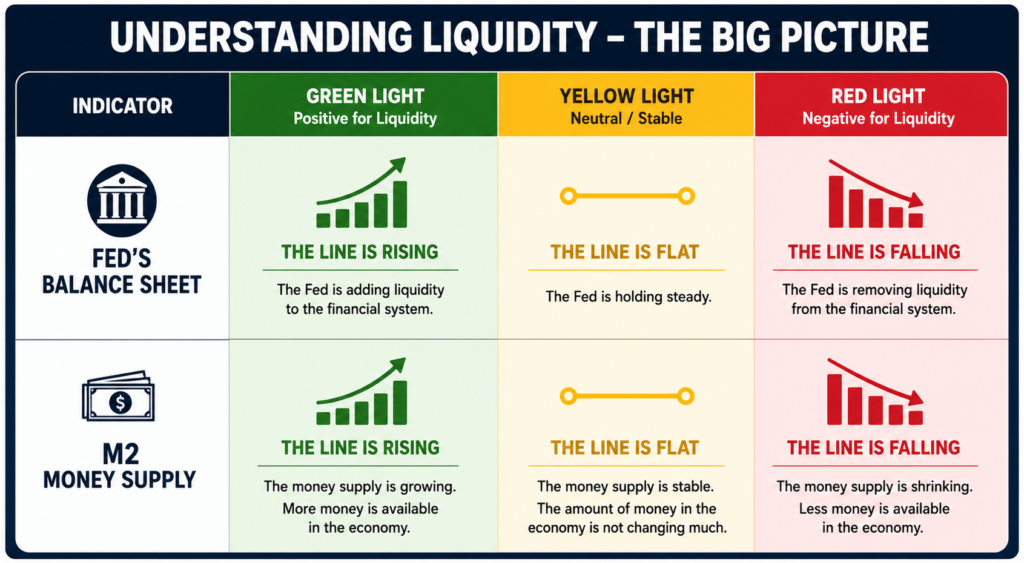
Wall Street has an astonishing talent for making simple ideas sound like they require a Ph.D. in economics. Fortunately, liquidity isn’t nearly that complicated. Think of the economy as a car. It doesn’t matter how beautiful the paint job is if there’s no fuel in the tank. The Federal Reserve’s Balance Sheet tells you whether the Fed is adding fuel, taking fuel away, or simply letting the engine idle. The M2 Money Supply tells you how much fuel is actually circulating through the economy. When both are moving higher, liquidity is generally improving. When both are moving lower, money becomes harder to find, borrowing becomes more expensive, and markets often discover that gravity still works.
By my simple read of these two charts – they are starting to slope higher again which means liquidity is increasing.
Economists can happily debate reserve balances, reverse repos, Treasury accounts, and a dozen other monetary indicators until everyone in the room needs stronger coffee. Those charts certainly contribute to understanding liquidity, but these two do about 90 percent of the heavy lifting. If you learn nothing else, learn this: Is the Fed putting more money into the system, and is the amount of money in the economy growing or shrinking? Answer those two questions each week, and you’ll understand more about the financial landscape than most investors who spend their evenings arguing over politics instead of following the flow of money.
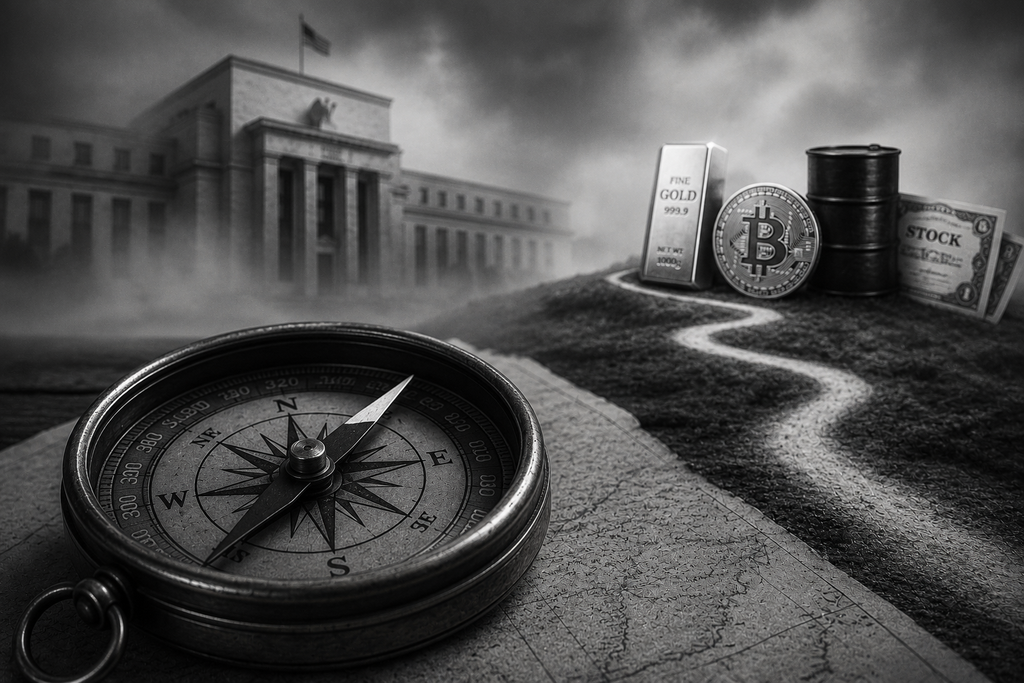
Over the next four months, investors will be inundated with campaign speeches, polling data, and election forecasts. Yet the market is focused on something far more consequential: the direction of interest rates. If borrowing costs remain elevated while economic growth slows, every major asset class, from stocks to commercial real estate to private equity, will feel the pressure. Elections create headlines. Liquidity creates market trends.
That places an extraordinary spotlight on the Federal Reserve under its new chair, Kevin Warsh. His selection followed extensive vetting by Treasury Secretary Scott Bessent, a process that underscored the administration’s desire for a leader who understands both Wall Street and the broader economy. While the Federal Reserve is institutionally independent, every administration has preferences about the economic backdrop it would like voters to experience. Historically, elected officials have favored lower borrowing costs because they support business investment, consumer spending, housing activity, and, often, stronger financial markets.
President Trump has made little secret of his own views on interest rates. He has long argued that rates should be substantially lower and has even spoken favorably about the idea of negative interest rates. Whether one agrees with that position or not, the direction of policy matters because lower rates generally make money easier to borrow and encourage investors to take more risk. Higher rates do the opposite. They raise the cost of capital and make cash and short term fixed income more attractive relative to stocks.
The timing makes the next few months especially important. The midterm elections could significantly influence the administration’s ability to advance its legislative agenda. If Republicans were to lose control of both the House and the Senate, it would become much more difficult for President Trump to pass major legislation during the final two years of his term. Markets often begin evaluating those possibilities well before votes are cast, adjusting expectations as political and economic probabilities evolve.
At the same time, the economic data has become more difficult to ignore. The latest employment report raised concerns that the labor market may be losing momentum. Slower job growth, if it persists, could strengthen the argument for easier monetary policy. The Federal Reserve’s mandate requires it to balance inflation with maximum employment, and weakening labor conditions inevitably become part of that discussion.
The bond market has been sending its own message for years. Long term Treasury prices have been under sustained pressure, reflecting an environment of persistently higher interest rates. For six consecutive years, bond investors have faced a challenging trend as yields climbed and prices declined. Whether that trend is finally approaching an inflection point may become one of the defining questions for investors through the remainder of the year.
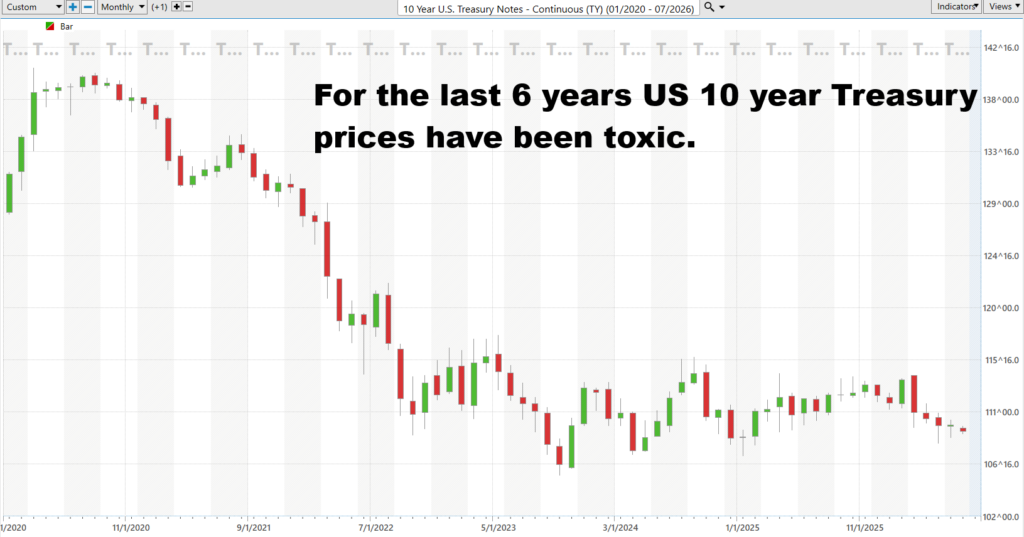
James Carville famously joked that if reincarnation were real, he wanted to come back as the bond market because “you can intimidate everybody.” Three decades later, that line may be truer than ever. Politicians campaign for lower interest rates, central bankers hold press conferences, and television pundits confidently predict the next move, but the bond market has the final vote. This chart tells a brutally simple story. For six straight years, U.S. Treasury bond prices have been trapped in a relentless downtrend, meaning investors have demanded higher and higher interest rates. The bond market has stubbornly refused to believe that cheap money should return. Until this chart changes direction, every dream of lower borrowing costs, easier Fed policy, and another wave of easy-money prosperity remains just that, a dream. In markets, politicians can make promises. The Federal Reserve can make speeches. But the bond market decides whether anyone gets to keep them.
Then there is liquidity.
This does not mean that lower interest rates automatically produce higher stock prices, nor does it mean the Federal Reserve will necessarily reduce rates. Markets are influenced by many variables, including earnings, inflation, productivity, and investor sentiment. But it does suggest that liquidity remains one of the most important variables investors should monitor.
The central question, then, is straightforward. If economic growth continues to soften while borrowing costs remain elevated, will the Federal Reserve decide that the time has come to make money easier to obtain? If the answer is yes, financial conditions could become more supportive for risk assets. If the answer is no, and rates remain restrictive while liquidity stays constrained, the probability of increased pressure on equities rises because companies, consumers, and investors would all continue operating in a more expensive financial environment.
That is the story worth following. Not simply who wins the next election, but whether the flow of money is about to change. History has shown that political cycles eventually pass. Liquidity, however, often leaves the more lasting mark on financial markets.
Wall Street has developed a bad habit. Every time markets stumble, investors begin looking toward the Federal Reserve as though it were a financial superhero waiting backstage. The assumption has become almost automatic: if conditions deteriorate enough, the Fed will cut interest rates, inject liquidity, and rescue asset prices. That expectation has been reinforced repeatedly over the past two decades. But markets are dangerous places to trade on assumptions, especially when everyone shares the same assumption.
This time, the Fed faces a problem it didn’t have during the financial crisis or the pandemic. Inflation has not completely disappeared. Cutting interest rates too quickly risks reigniting the very inflation policymakers have spent years trying to control. The Fed is no longer fighting a single enemy. It is trying to balance slower economic growth against the possibility that inflation could return. Those goals do not always point in the same direction.
Now consider the political calendar. The midterm elections are rapidly approaching, and every administration wants to campaign in front of a healthy economy, rising markets, and falling borrowing costs. President Trump has never hidden his preference for lower interest rates. Politically, the incentive for lower rates is obvious. Whether the Federal Reserve shares that urgency is an entirely different question.
Markets, however, don’t care about political wishes. They care about financial conditions. Economic growth appears to be slowing, yet the cost of money remains historically restrictive. That combination has rarely been comfortable for risk assets.
This is where the market’s optimism collides with reality. Many investors are behaving as though rate cuts are inevitable. They are positioning portfolios based on what they hope the Federal Reserve will do rather than what the Federal Reserve has actually done. Hope is not a monetary policy. It is certainly not an investment strategy. Markets have a long history of punishing investors who mistake expectations for facts.
Then there is SpaceX. It arrived on the public markets as one of the largest companies on Earth, requiring enormous amounts of capital simply to maintain orderly trading. That makes it something far more important than another high-profile IPO. It has become a real-time test of market liquidity. If one of the world’s largest companies struggles to attract sufficient buying interest during periods of selling pressure, traders should not dismiss it as an isolated story. They should ask what it says about the availability of capital across the broader market.
This is precisely why liquidity deserves more attention than politics. Campaign speeches do not finance margin accounts. Election commercials do not lower mortgage rates. Press conferences do not create credit. Liquidity does. When money is abundant, markets often become forgiving. Weak companies find financing. Expensive stocks become even more expensive. Investors convince themselves that every dip is another buying opportunity. When liquidity tightens, those same assumptions begin to unravel with surprising speed.
The uncomfortable truth is that the market may be approaching a moment of decision. If economic data continues to weaken and the Federal Reserve responds by easing financial conditions, markets may find the support they are expecting. If the Fed concludes inflation remains the greater threat and keeps policy restrictive, investors could discover that they have been counting on a rescue that never arrives. In the end, markets rarely collapse because politicians disappoint. They struggle when money becomes harder to find. Politics creates the headlines. Liquidity decides who wins and who loses.
For most investors, the market will always feel unpredictable. They’ll spend countless hours following headlines, listening to political debates, and trying to guess what the Federal Reserve might do next. Yet history suggests the biggest opportunities rarely belong to the people who consume the most news. They belong to the people who understand how money moves. Elections come and go. Federal Reserve Chairs change. Economic forecasts are constantly revised. But the flow of capital remains one of the few forces that consistently shapes financial markets.
The challenge is that no individual can process all of the information influencing prices. Every day, markets are responding to interest rates, bond yields, sector rotation, global currencies, commodities, corporate earnings, investor sentiment, and thousands of relationships unfolding simultaneously. By the time a human being has sorted through all of those moving pieces, the market has often already moved. That isn’t a lack of intelligence. It’s simply a limitation of human processing power.
This is where VantagePoint’s artificial intelligence changes the equation. AI doesn’t replace experience or judgment, but it dramatically expands what a trader can see. Instead of looking at one chart or one market at a time, VantagePoint AI can evaluate thousands of intermarket relationships simultaneously, measuring correlations between stocks, bonds, currencies, commodities, interest rates, sector rotation, volume, and countless other variables that would overwhelm even the most experienced analyst. It doesn’t eliminate uncertainty, but it helps transform overwhelming amounts of information into actionable probabilities that support more informed trading decisions.
Imagine beginning each trading day with a clearer understanding of where money is flowing, which sectors are strengthening, which markets are weakening, and how those relationships are likely to influence tomorrow’s prices rather than yesterday’s headlines. That is the advantage VnatgePoint AI offers. It allows traders to spend less time reacting to news and more time recognizing developing trends before they become obvious. In today’s markets, that edge can make the difference between following the crowd and staying one step ahead of it.
If you’d like to see exactly how this works, I invite you to join us for a FREE Live Online Trading Masterclass. You’ll see VantagePoint AI analyze markets in real time, discover how professional traders use artificial intelligence to identify trends, measure intermarket relationships, and improve decision making, and learn how AI can help you approach the markets with greater confidence and clarity. The markets will always be uncertain. The question is whether you’ll face that uncertainty armed with yesterday’s tools or tomorrow’s technology. We look forward to showing you what’s possible.
Artificial intelligence isn’t about replacing traders. It’s about giving them better information. VantagePoint AI has one clear objective: to keep you on the right side of the right trend at the right time. By analyzing intermarket relationships, correlations, and predictive market data that are impossible to process manually, it helps traders make more informed decisions with greater confidence.
If you’re ready to see predictive AI in action, join our Learn How to Trade with VantagePoint AI Live Online Masterclass. You’ll discover how professional traders use artificial intelligence to identify opportunities earlier, improve decision making, and gain a deeper understanding of today’s financial markets.
It’s not magic.
It’s machine learning.
THERE IS A SUBSTANTIAL RISK OF LOSS ASSOCIATED WITH TRADING. ONLY RISK CAPITAL SHOULD BE USED TO TRADE. TRADING STOCKS, FUTURES, OPTIONS, FOREX, AND ETFs IS NOT SUITABLE FOR EVERYONE.IMPORTANT NOTICE!
DISCLAIMER: STOCKS, FUTURES, OPTIONS, ETFs AND CURRENCY TRADING ALL HAVE LARGE POTENTIAL REWARDS, BUT THEY ALSO HAVE LARGE POTENTIAL RISK. YOU MUST BE AWARE OF THE RISKS AND BE WILLING TO ACCEPT THEM IN ORDER TO INVEST IN THESE MARKETS. DON’T TRADE WITH MONEY YOU CAN’T AFFORD TO LOSE. THIS ARTICLE AND WEBSITE IS NEITHER A SOLICITATION NOR AN OFFER TO BUY/SELL FUTURES, OPTIONS, STOCKS, OR CURRENCIES. NO REPRESENTATION IS BEING MADE THAT ANY ACCOUNT WILL OR IS LIKELY TO ACHIEVE PROFITS OR LOSSES SIMILAR TO THOSE DISCUSSED ON THIS ARTICLE OR WEBSITE. THE PAST PERFORMANCE OF ANY TRADING SYSTEM OR METHODOLOGY IS NOT NECESSARILY INDICATIVE OF FUTURE RESULTS. CFTC RULE 4.41 – HYPOTHETICAL OR SIMULATED PERFORMANCE RESULTS HAVE CERTAIN LIMITATIONS. UNLIKE AN ACTUAL PERFORMANCE RECORD, SIMULATED RESULTS DO NOT REPRESENT ACTUAL TRADING. ALSO, SINCE THE TRADES HAVE NOT BEEN EXECUTED, THE RESULTS MAY HAVE UNDER-OR-OVER COMPENSATED FOR THE IMPACT, IF ANY, OF CERTAIN MARKET FACTORS, SUCH AS LACK OF LIQUIDITY. SIMULATED TRADING PROGRAMS IN GENERAL ARE ALSO SUBJECT TO THE FACT THAT THEY ARE DESIGNED WITH THE BENEFIT OF HINDSIGHT. NO REPRESENTATION IS BEING MADE THAT ANY ACCOUNT WILL OR IS LIKELY TO ACHIEVE PROFIT OR LOSSES SIMILAR TO THOSE SHOWN.