


Every few years, Wall Street discovers the future.
First it was program trading. Then it was neural networks. Then came high-frequency trading, quantum computing, big data, alternative data, satellite imagery, machine learning, etc.. If you believed the headlines, each new breakthrough was supposed to make everything that came before it as obsolete as a fax machine at a smartphone convention.
And yet something rather inconvenient keeps happening.
Some of the oldest tools on Wall Street simply refuse to go away.
Among them are pivot points. A deceptively simple set of calculations first used by floor traders armed with little more than pencils, paper, and loud voices. And traders around the globe still begin their day by checking those same pivot levels.
That should make you curious. I’ve written about Pivot Points before. You can find previous Pivot Point content here.
Due to their immense popularity, I’ll describe the 5 most popular Pivot Point Strategies and I’ve created a Pivot Point Calculator for each method.
Why would sophisticated hedge funds still pay attention to a methodology that predates the internet? Is it nostalgia? Habit? Or have these simple calculations been measuring something far more important all along?
The answer has very little to do with mathematics and everything to do with markets. Technology changes. Human behavior doesn’t. Buyers still compete with sellers. Fear still collides with greed. Uncertainty still demands a price. Pivot points don’t forecast trends (that’s what VantagePoint’s patented artificial intelligence does), but they do provide a remarkably practical framework for understanding where the market may make its next important decision.
Walk onto a modern trading desk and it bears little resemblance to the bustling exchange floors of a generation ago. Orders are executed in microseconds. Algorithms compete against algorithms. Artificial intelligence scans earnings reports, economic releases, satellite imagery, shipping traffic, weather patterns, and even social media sentiment, searching for an informational edge before most investors have finished reading the headline. Markets have become faster, more connected, and unquestionably more sophisticated.
Yet beneath all of that technology lies a surprisingly familiar reality.
Every transaction still requires a buyer and a seller. Every price still reflects a disagreement about value. Every rally is fueled by optimism, every decline by fear, and every period of consolidation by uncertainty as market participants struggle to determine what an asset is truly worth. Computers may execute the trades, but they are still responding to human objectives, human capital allocation, and ultimately, human behavior.
This is precisely why pivot points continue to matter. They are not attempting to outsmart AI or compete with sophisticated algorithms. Instead, they identify the price zones where these competing forces are most likely to converge. Whether the order originates from a retail investor, a hedge fund, or an AI-driven trading system, the market must still discover fair value. Pivot points provide a remarkably simple framework for identifying where that discovery process is most likely to occur.
One of the biggest misconceptions surrounding pivot points is the belief that they are supposed to tell traders exactly what the market will do next. They don’t. They were never intended to function as crystal balls, forecasting models, or guarantees of future price movement. What pivot points do provide is something far more practical. They establish an objective framework for evaluating the next trading period. They estimate where fair value is likely to reside, define an expected trading range, and identify areas where buyers may emerge as support or sellers may appear as resistance. Rather than predicting a specific outcome, they identify the price levels where important decisions are most likely to occur.
This distinction is critical because successful trading has never been about establishing certainty. Casinos don’t know which hand of blackjack will win. Insurance companies don’t know which policyholder will file the next claim. Yet both businesses prosper because they understand probabilities over hundreds or thousands of outcomes. Most professional traders approach the markets in much the same way.
That is the true purpose of Pivot Points. They are probabilistic tools, not predictive ones. They don’t tell you what the market will do. They help you prepare for what the market may do.
Here are the 5 most popular Pivot Methods with a corresponding calculator.
Disclaimer: The Classic Pivot Point Calculator, Fibonacci Pivot Point Calculator, Camarilla Pivot Points Calculator, Woodie Pivot Points Calculator, and DeMark Pivot Points Calculator below are educational illustrations created by the author for this article. These not Vantagepoint AI products, features, or services, and they do not generate forecasts, signals, or trade recommendations. All values, scenarios, and outcomes displayed are entirely hypothetical and intended solely to demonstrate the basic mechanics of pivot points. These tool should not be used to place, plan, or evaluate actual trades. They do not account for real market conditions, commissions, slippage, bid ask spreads, changes in implied volatility, dividends, early assignment risk, or any of the other factors that affect actual trading outcomes. Trading and using Pivot Points both involve substantial risk and are not suitable for everyone. Hypothetical examples are not indicative of future results.
Classic Pivot Point Calculator
Classic Pivot Points are the foundation of virtually every pivot methodology that followed. They identify the market’s approximate fair value and establish a probable trading range using the previous period’s high, low, and close. If you’re new to pivot points, this is the logical place to begin because it provides the benchmark against which the other systems can be compared. Most traders watch the daily, weekly and monthly time frames and place a greater emphasis on the longer term time frames.
Classic: Identify fair value and expected trading ranges.
Show Formula
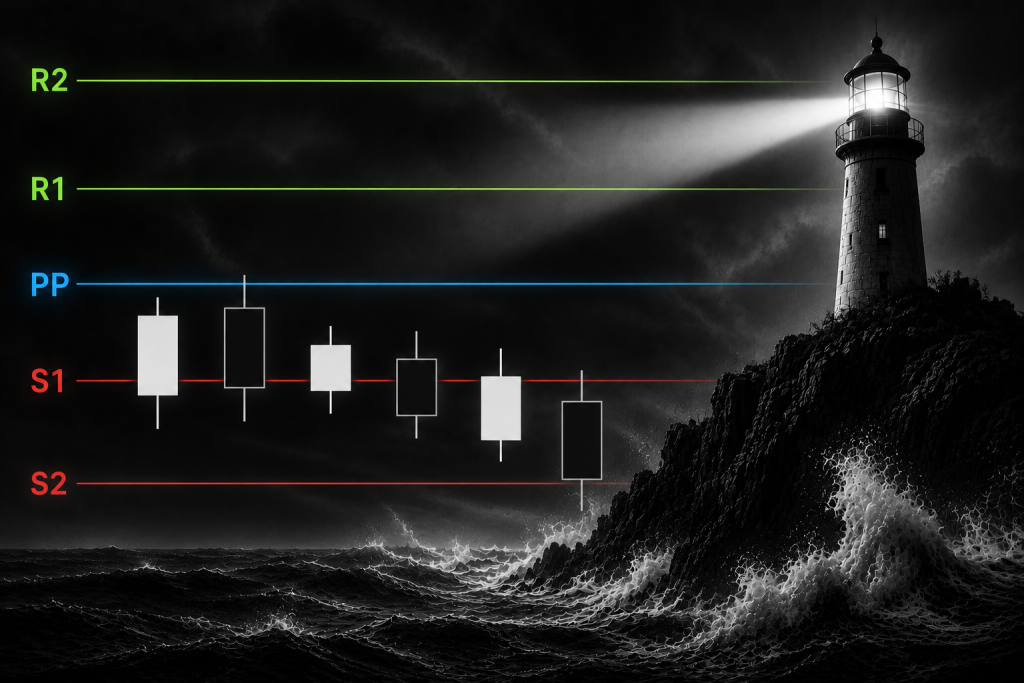
Classic Pivot Levels
How Traders Interpret Classic Pivot Points
Price above PP suggests bullish bias.
Price below PP suggests bearish bias.
R1 and S1 often define the first major upside and downside decision zones.
R2 and S2 suggest stronger-than-normal momentum or an extended move.
Fibonacci Pivot Point Calculator
Fibonacci Pivot Points begin with the same central Pivot Point used in the Classic methodology, but they take the analysis one step further. Instead of calculating support and resistance using fixed mathematical relationships, they apply Fibonacci ratios (38.2%, 61.8%, and 100%) to the previous period's trading range. These percentages have long been associated with recurring patterns found throughout nature, mathematics, and financial markets.
The result is a series of support and resistance levels that estimate how far price may travel once it begins moving away from fair value. Rather than simply identifying equilibrium, Fibonacci Pivot Points measure the probability of market expansion. The farther price moves from the Pivot Point, the more traders begin evaluating whether momentum is strengthening or whether the move is becoming extended.
For traders, this provides a practical roadmap. The Pivot Point represents fair value. The Fibonacci levels represent progressively larger departures from that value, helping traders establish logical upside objectives during advancing markets and downside objectives during declining markets. Like every pivot methodology, Fibonacci Pivot Points do not predict the future. They identify price zones where important market decisions are statistically more likely to occur.
Fibonacci: Project logical price extensions during trending markets.
Show Formula
Fibonacci Pivot Levels
How Traders Interpret Fibonacci Pivot Points
R1 and S1 represent the first Fibonacci expansion zones.
R2 and S2 suggest stronger directional movement.
R3 and S3 represent full-range extensions and may indicate unusually strong momentum.
Camarilla Pivot Points
Camarilla Pivot Points were developed with a different objective than the Classic and Fibonacci methods. Rather than estimating fair value or projecting the magnitude of a price move, Camarilla pivots are designed to identify decision points. Their formulas create a series of tightly grouped support and resistance levels that help traders distinguish between ordinary market fluctuations and potentially significant turning points.
What makes Camarilla unique is its emphasis on reversals versus breakouts. The H3 and L3 levels are commonly viewed as areas where a market may reverse back toward equilibrium, while the H4 and L4 levels often signal that buyers or sellers have become strong enough to drive a sustained breakout. For active traders, this creates a straightforward framework for determining whether the market could remain range-bound or transition into a new trend.
Camarilla: Distinguish between reversals and breakouts.
Show Formula
Camarilla Pivot Levels
How Traders Interpret Camarilla Pivot Points
H4 suggests buyers may be strong enough to create an upside breakout.
L4 suggests sellers may be strong enough to create a downside breakdown.
The prior close acts as the central anchor for the Camarilla framework.
Woodie Pivot Points
Woodie Pivot Points begin with a simple premise: the closing price matters more than any other price of the trading session. While most pivot methodologies treat the high, low, and close equally, the Woodie formula assigns twice the weight to the previous period's close. The assumption is that the market's final price reflects the strongest consensus between buyers and sellers after an entire trading session.
This heavier emphasis on the close makes Woodie Pivot Points more responsive to recent changes in market sentiment. If a market finishes the day with unusually strong buying or selling pressure, that conviction is reflected directly in the next period's pivot calculation. Traders who believe that recent price action provides the clearest insight into future market direction often favor the Woodie methodology for its sensitivity to changing momentum.
Woodie: Emphasizes recent market sentiment.
Show Formula
Woodie Pivot Levels
How Traders Interpret Woodie Pivot Points
Price above PP suggests bullish bias.
Price below PP suggests bearish bias.
R1 and S1 define the first upside and downside decision zones.
R2 and S2 suggest stronger-than-normal momentum or an extended move.
DeMark Pivot Points
DeMark Pivot Points take perhaps the most distinctive approach of the five major methodologies. Rather than focusing primarily on support and resistance, they begin by asking a different question: Who controlled the previous trading session? The formula changes depending on whether the market closed above, below, or exactly at its opening price, allowing the calculation to incorporate the prevailing directional bias.
As a result, DeMark Pivot Points are less concerned with defining an expected trading range and more concerned with identifying potential continuation of the prevailing trend. Momentum traders often prefer this methodology because it emphasizes directional conviction rather than equilibrium. Instead of asking where price might reverse, DeMark pivots help traders evaluate whether buyers or sellers are likely to remain in control during the next trading period.
DeMark: Evaluates directional bias and trend continuation.
Show Formula
DeMark Pivot Levels
How Traders Interpret DeMark Pivot Points
Price above PP suggests buyers may have control.
Price below PP suggests sellers may have control.
R1 acts as a bullish confirmation area.
S1 acts as a bearish confirmation area.
Why Longer Time Frames Matter More
One of the most common mistakes traders make is assuming that all pivot points carry the same significance. They don't. While daily pivot points can be valuable for short-term trading, they are also the most susceptible to market noise. A single news headline, earnings announcement, or burst of algorithmic trading can quickly overwhelm daily support and resistance levels. They remain useful, but their influence is often short-lived.
As the time frame expands, the significance of the pivot points increases. Weekly pivot points incorporate five trading sessions instead of one. Monthly pivots summarize an entire month's worth of buying and selling. Quarterly and annual pivots reflect thousands of individual transactions, substantially more invested capital, and far greater institutional participation. The longer the measurement period, the more meaningful the resulting estimate of fair value becomes.
A simple analogy helps illustrate the difference. Imagine conducting a political poll by asking ten people for their opinion. You would learn something, but few would consider the results definitive. Now compare that with a nationwide census involving millions of participants. The larger sample produces a far more reliable picture. Markets behave much the same way. The more transactions that contribute to a pivot calculation, the more representative that level becomes.
This is one reason many professional traders pay close attention to monthly, quarterly, and annual pivot points. Large institutions allocate capital over weeks, months, and even years, not minutes. As a result, longer-term pivot levels often become important areas where significant buying, selling, or portfolio rebalancing occurs. Daily pivots help explain today's trading activity. Longer-term pivots often help explain where the market is making its most important decisions.
Pivot Points Don't Replace AI (And AI Doesn't Replace Pivot Points)
AI isn't in the business of replacing good tools. It's in the business of making good tools even more useful. The traders who will benefit the most from AI aren't abandoning proven methods like pivot points. And traders aren't abandoning AI for pivot points.
Think about what VantagePoint AI does best. It identifies relationships that humans might overlook. It recognizes patterns across thousands of markets and years of historical data. It forecasts the best trades in seconds instead of hours, days, or even months. Pivot Points already define the price zones where the market is likely to make important decisions. AI adds another layer of intelligence by evaluating whether those probability zones are supported by trend, momentum, intermarket relationships, volume, volatility, or dozens of other variables.
Pivot Points are enhanced by AI and vice versa. A weekly pivot point that aligns with strengthening market momentum is more meaningful than a pivot point standing alone. A monthly pivot that coincides with improving intermarket relationships deserves more attention than one that does not.
Pivot Points accomplish exactly what they were designed to do. They help traders focus less on guessing where the market will close tomorrow and more on recognizing where the most important decisions in the market are likely to occur.
The challenge facing every trader has remained remarkably consistent for centuries. How do you separate random market noise from price movements that actually matter?
The financial markets offer more information faster than ever before. Every second brings another headline, another analyst opinion, another economic report, and another algorithm interpreting it all before most investors have time to read the first sentence. Yet despite this explosion of data, many traders find themselves asking the same question they asked twenty years ago: Where do I begin?
If that question resonates with you, then you owe it to yourself to see what today's technology is capable of accomplishing. The Learn to Trade with VantagePoint AI Live Online Masterclass demonstrates how professional traders combine time-tested principles like pivot points with patented predictive artificial intelligence to identify opportunities, manage risk, and make more informed trading decisions. You'll discover how experienced traders integrate probability, market analysis, and AI into a practical process that can be applied to stocks, ETFs, currencies, and more.
Whether you are new to trading or have decades of market experience, one truth remains constant. The traders who continue learning are the traders who continue improving. If you are ready to move beyond reacting to the markets and begin preparing for them with greater clarity and confidence, reserve your seat for an upcoming FREE Live Trade with VantagePoint AI Masterclass. It will change the way you look at the markets, and more importantly, the way you trade them.
Ready to learn more about forecasting stocks and options days before anyone else with up to 87.4% proven accuracy? Attend our FREE LIVE Online Trading Masterclass.
Let’s Be Careful Out There.
See you at the masterclass.
It’s not magic.
It’s machine learning.
THERE IS A SUBSTANTIAL RISK OF LOSS ASSOCIATED WITH TRADING. ONLY RISK CAPITAL SHOULD BE USED TO TRADE. TRADING STOCKS, FUTURES, OPTIONS, FOREX, AND ETFs IS NOT SUITABLE FOR EVERYONE.IMPORTANT NOTICE!
DISCLAIMER: STOCKS, FUTURES, OPTIONS, ETFs AND CURRENCY TRADING ALL HAVE LARGE POTENTIAL REWARDS, BUT THEY ALSO HAVE LARGE POTENTIAL RISK. YOU MUST BE AWARE OF THE RISKS AND BE WILLING TO ACCEPT THEM IN ORDER TO INVEST IN THESE MARKETS. DON’T TRADE WITH MONEY YOU CAN’T AFFORD TO LOSE. THIS ARTICLE AND WEBSITE IS NEITHER A SOLICITATION NOR AN OFFER TO BUY/SELL FUTURES, OPTIONS, STOCKS, OR CURRENCIES. NO REPRESENTATION IS BEING MADE THAT ANY ACCOUNT WILL OR IS LIKELY TO ACHIEVE PROFITS OR LOSSES SIMILAR TO THOSE DISCUSSED ON THIS ARTICLE OR WEBSITE. THE PAST PERFORMANCE OF ANY TRADING SYSTEM OR METHODOLOGY IS NOT NECESSARILY INDICATIVE OF FUTURE RESULTS. CFTC RULE 4.41 – HYPOTHETICAL OR SIMULATED PERFORMANCE RESULTS HAVE CERTAIN LIMITATIONS. UNLIKE AN ACTUAL PERFORMANCE RECORD, SIMULATED RESULTS DO NOT REPRESENT ACTUAL TRADING. ALSO, SINCE THE TRADES HAVE NOT BEEN EXECUTED, THE RESULTS MAY HAVE UNDER-OR-OVER COMPENSATED FOR THE IMPACT, IF ANY, OF CERTAIN MARKET FACTORS, SUCH AS LACK OF LIQUIDITY. SIMULATED TRADING PROGRAMS IN GENERAL ARE ALSO SUBJECT TO THE FACT THAT THEY ARE DESIGNED WITH THE BENEFIT OF HINDSIGHT. NO REPRESENTATION IS BEING MADE THAT ANY ACCOUNT WILL OR IS LIKELY TO ACHIEVE PROFIT OR LOSSES SIMILAR TO THOSE SHOWN.