


This week’s AI stock spotlight is Applied Materials ($AMAT)
Applied Materials is one of those companies most people have never heard of, yet modern civilization would become a very expensive camping trip without it. Founded in 1967 in Silicon Valley, built to help make semiconductors, transformed itself into a global chip-equipment powerhouse, became a critical supplier during every major computing revolution from PCs to smartphones to AI, and today sits at the center of the most important arms race in technology. It matters because every company chasing artificial intelligence eventually runs into the same problem: somebody has to build the chips. Applied Materials sells the machinery that makes that possible.
Applied Materials does not make the chips. It sells the picks and shovels to the people digging for the proverbial gold. If NVIDIA is selling the dream, Applied Materials is selling the factory equipment needed to manufacture the dream. Its largest business is Semiconductor Systems, which provides the highly specialized tools used to build advanced semiconductors. The second major business is Applied Global Services, which keeps those machines running, upgraded, and profitable long after they are installed. There is also a smaller Display segment serving screens and advanced displays.
Its customers read like a who’s who of global technology: Taiwan Semiconductor Manufacturing Company, Samsung Electronics, Intel, memory producers, foundries, and increasingly any company trying to build AI infrastructure. The company is headquartered in Santa Clara and led by Gary Dickerson. It employs roughly 35,000 people worldwide. Its biggest competitors are ASML, Lam Research, and KLA Corporation. In this industry, there are only a handful of players capable of building these machines, which gives Applied Materials a moat wider than most governments’ fiscal deficits.
Financially, this company resembles a toll booth on a busy interstate. Revenue recently reached a record $7.91 billion in the latest quarter, up 11% year over year, while earnings climbed 33% and margins approached 50%. Those are not numbers typically associated with struggling businesses. They are numbers associated with companies that have customers standing in line with checkbooks.
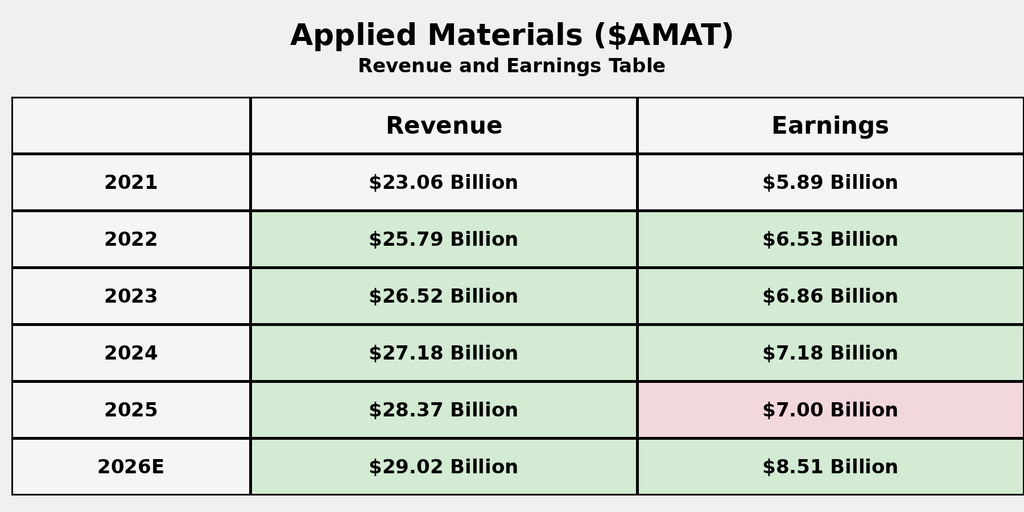
The numbers tell a story that is becoming increasingly familiar across the artificial intelligence ecosystem: revenue growth is steady, but earnings growth is beginning to accelerate. Applied Materials has expanded revenue from $23.1 billion in 2021 to an estimated $29.0 billion in 2026, a respectable but hardly explosive trajectory. What stands out is the company’s ability to convert that growth into profits. Earnings have climbed from $5.9 billion to a projected $8.5 billion over the same period, despite a modest pause in 2025. That matters because Applied Materials sits at the center of the global semiconductor arms race. Every AI server, advanced processor, memory chip, and data center buildout ultimately requires the sophisticated manufacturing equipment that Applied Materials provides. As capital spending tied to artificial intelligence continues to surge, the company is demonstrating what Wall Street values most: operating leverage. Revenue is growing, but profits are growing faster. For investors, that suggests Applied Materials is not merely participating in the AI boom; it is becoming increasingly efficient at monetizing it, a dynamic that often commands premium valuations and attracts institutional capital.
What traders often misunderstand is that Applied Materials is not merely a semiconductor stock. It is a semiconductor spending stock. The difference matters. The company’s fortunes depend less on how many chips consumers buy and more on how much money chipmakers spend building the next generation of factories. When capital expenditures accelerate, Applied Materials becomes the casino that sells chips to the gamblers.
The first question traders are asking right now is simple: how long can the AI spending boom last? Every major technology company is throwing money at AI infrastructure like a drunken bachelor at a Vegas blackjack table. If those spending plans continue, Applied Materials may still be in the early innings. If they slow, expectations could suddenly become much harder to satisfy.
The second question is whether memory spending and advanced packaging demand can remain this strong. AI requires enormous amounts of memory and increasingly complex chip packaging technologies. Applied Materials is heavily exposed to both. So far, that has been a blessing. Traders are trying to determine whether it becomes a dependency.
The third question revolves around China. Export restrictions remain a risk. China was once nearly 40% of revenue and has declined significantly as regulations tightened. Management believes other markets can offset much of the weakness, but investors continue watching this issue closely.
Over the last month, the stock has been powered by a simple narrative: AI spending is accelerating, not slowing. Citi recently raised forecasts for wafer fabrication equipment spending and suggested industry spending could reach $145 billion this year and continue climbing through 2028. Applied Materials, ASML, and Lam Research all surged to record highs on the news.
What is actually new is not AI itself. Traders have heard the AI story a thousand times. What is new is evidence that spending forecasts keep moving higher. Applied Materials reported record revenue, record earnings, expanding margins, and issued guidance that points toward continued growth.
What is already priced in is the idea that AI infrastructure spending remains strong. Wall Street is not surprised by that anymore. The market has largely accepted it as fact. What Wall Street may be missing is how long these spending cycles can last. Historically, analysts tend to underestimate semiconductor capital spending during upcycles and overestimate it during downturns. Human beings have a remarkable ability to assume today’s conditions will continue forever.
The stock is up because the numbers justify it. Revenue growth, earnings growth, margin expansion, and stronger guidance all arrived at the same time. Analysts love stories, but markets ultimately reward cash flow and earnings. Applied Materials delivered both.
Compared with semiconductor ETFs like SOXX and SMH, Applied Materials has become one of the leaders of the AI infrastructure trade. Over the last 90 days, investors have increasingly viewed it as a direct beneficiary of the data center buildout. Year to date, the AI narrative helped. But the earnings reports mattered more. Narratives get attention. Earnings get capital.
The biggest upside surprise would be if semiconductor equipment spending accelerates even faster than current forecasts suggest. Some analysts now envision spending reaching $250 billion by 2028. If that proves accurate, Applied Materials could enjoy years of elevated demand.
The biggest risk is that investors assume AI demand is immune to economic gravity. It isn’t. Every technology cycle eventually experiences pauses, delays, and inventory adjustments. Applied Materials can survive those periods, but the stock can still become volatile when expectations outrun reality.
Looking ahead, traders should focus on three catalysts. First, the next earnings report, expected around August 13, 2026. Earnings matter because this company repeatedly changes investor expectations when it reports results. Second, semiconductor capital spending forecasts from major customers and industry analysts. Third, any changes to U.S.-China export regulations, which could materially affect future revenue opportunities.
For traders, Applied Materials is best suited for those who want exposure to the AI boom without betting directly on one chip designer. This is the company selling the machinery to everyone at the party. For the trend to continue, revenue growth, margin expansion, and semiconductor capital spending must remain strong. Early trouble would show up in slowing equipment orders, weakening customer spending plans, or a sudden drop in AI infrastructure investment. Until then, Applied Materials remains one of the clearest ways to participate in the ongoing construction of the AI economy, and right now the builders are still very busy.
The following are the indicators and forecasts that we will use in this stock study to better comprehend the price action of $AMAT.
Wall Street Analysts Ratings and Forecasts
52 Week High and Low Boundaries
Best-Case / Worst-Case Scenario Analysis
VantagePoint AI Predictive Blue Line
Neural Network Forecast (Machine Learning)
VantagePoint AI Daily Range Forecast
Intermarket Analysis
Our Suggestion
We use our patented artificial intelligence to improve probabilities, not replace judgment. An opportunity means almost nothing if the business behind it is weak. That’s why we study revenue, earnings, cash flow, and competitive strength alongside price action. When strong fundamentals and strong momentum align, the odds often move decisively in a trader’s favor.
Wall Street Analysts Price Forecasts
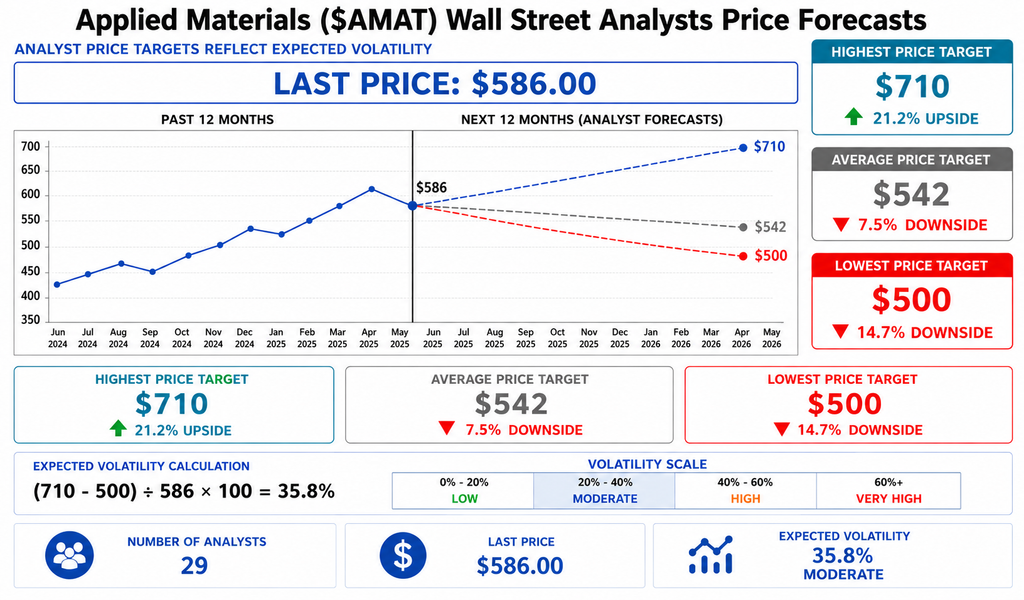
Applied Materials is one of those stocks that can make Wall Street look either brilliant or completely lost, depending on which analyst report you happen to pick up. At a current price of $586, the most optimistic analyst sees the stock climbing to $710, while the most pessimistic analyst believes it could fall to $500. That spread tells us something important. There is no consensus. Analysts agree that Applied Materials is a critical player in the semiconductor and AI infrastructure boom, but they disagree sharply on how much of that future success is already reflected in today’s stock price. When professionals who spend all day studying the same company arrive at targets separated by more than $200, it tells traders that uncertainty remains high. The opportunity may be significant, but so is the debate.
The math reinforces that point. Using the highest target of $710 and the lowest target of $500 produces an expected volatility reading of 35.8%. Think of that number as a report card measuring analyst agreement. The lower the number, the more Wall Street tends to agree on the future. The higher the number, the more disagreement exists. A reading near 36% suggests that analysts are still arguing about how large the AI spending cycle will become, how long semiconductor demand can remain elevated, and whether earnings growth can keep pace with investor expectations. For traders, that usually translates into a stock that can move quickly when new information arrives. Expectations are not fully settled. The market is still trying to determine whether Applied Materials is approaching the late innings of the AI buildout story or merely warming up in the on-deck circle.
That creates an interesting setup. The upside target of $710 implies a gain of roughly 21%, while the downside target of $500 suggests a decline of about 15%. On paper, the reward side remains larger than the risk side. More importantly, analyst revisions are likely to be driven by one thing: earnings. If Applied Materials continues demonstrating that AI-related semiconductor spending is accelerating, analysts will be forced to move targets higher. If orders slow or margins disappoint, those same analysts will suddenly discover reasons to become cautious. For now, this remains a momentum trader’s stock. The trend is still intact, institutional money continues to participate, and Wall Street has not reached full agreement on where the company is ultimately headed. When the experts are still arguing about the destination, the trend often has more road left than most people think.
52 Week High and Low Boundaries
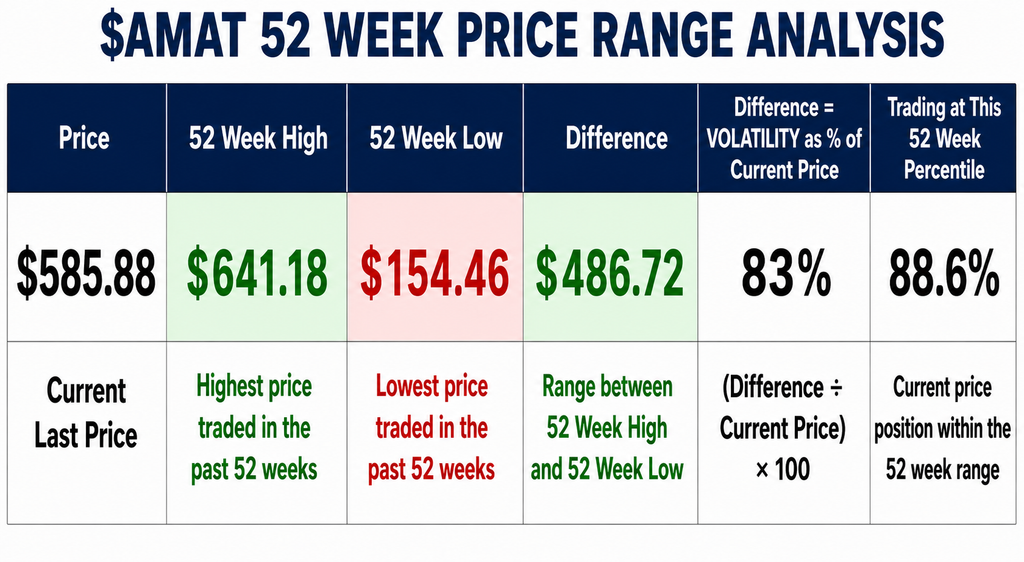
At first glance, the most important number here is not the current price of $585.88. It is the percentile ranking. Applied Materials is trading at the 88.6th percentile of its 52-week range, meaning the stock is sitting in the top tier of where it has traded over the last year. Think of a football field. AMAT is standing near the opponent’s 10-yard line, not midfield. That tells you buyers have controlled the trend for a long time. Smart traders pay close attention to a stock’s 52-week range because it provides a simple picture of what the asset is capable of doing. Over the last year, AMAT has traded between $154.46 and $641.18. That range tells you this is not a sleepy stock. It is a leader that has demonstrated the ability to make very large moves when capital begins flowing into the semiconductor sector.
The annual trading range spans $486.72. When you divide that range by the current price of $585.88, you get approximately 83%. In practical terms, that means the stock covered an amount equal to 83% of its current value over the last 52 weeks. That is significant volatility. This is not the type of stock that drifts quietly higher a few percentage points at a time. AMAT tends to move in powerful advances followed by meaningful pullbacks. The fact that the stock is trading near the upper end of its range suggests expansion rather than compression. Buyers have been willing to pay increasingly higher prices. For traders, that means expectations should remain focused on larger-than-average swings rather than small, predictable movements.
The opportunity is obvious. Strong stocks often remain strong longer than most people expect, and AMAT continues to trade much closer to its high than its low. Momentum traders will likely view that as confirmation that institutional money remains committed to the trend. The risk is equally obvious. At nearly 89% of its annual range, the stock has already traveled a long way. A breakout above the 52-week high of $641.18 would signal another leg higher and confirm continued leadership. A sustained move back toward the middle of the range would suggest momentum is weakening and institutions may be taking profits. For now, the trend remains firmly intact. The risk-versus-reward equation still favors trend followers, but traders should recognize that leadership stocks near their highs can generate enormous rewards and equally memorable pullbacks. The key is respecting both possibilities at the same time.
Best-Case/Worst-Case Scenario Analysis
Volatility sounds like a complicated Wall Street word. It isn’t. Volatility is simply the distance a stock can travel when buyers or sellers take control. The fastest way to understand volatility is not through formulas or academic theories. It is by studying the largest uninterrupted rallies and declines over the past 52 weeks. Those moves tell you what the stock has actually done with real money, real traders, and real emotions involved. Before risking a dollar, every trader should know what an asset is capable of doing when conditions are favorable and when they are not.
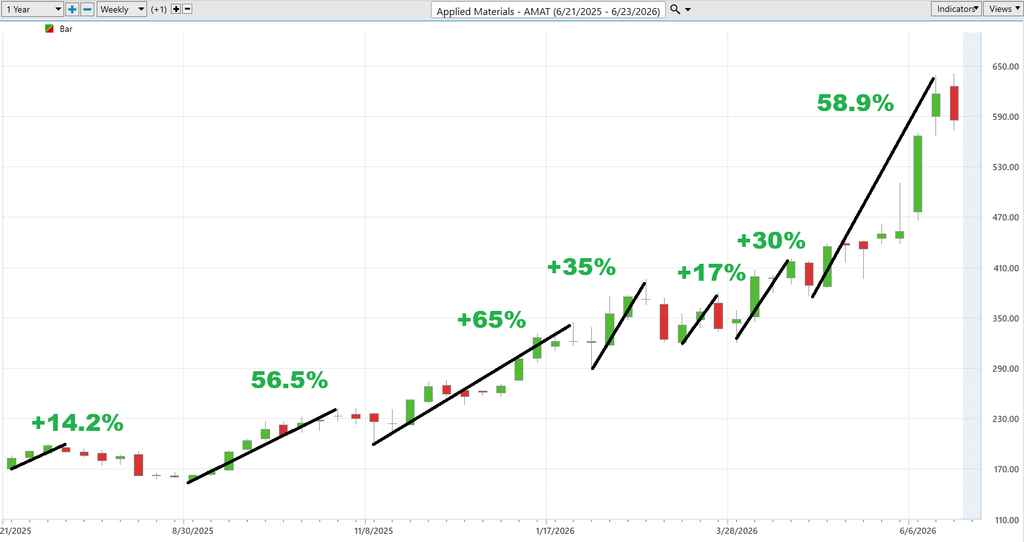
Take a close look at the chart. The largest uninterrupted rally in Applied Materials over the past year was approximately +65%. From the current price of $585.88, a similar move would project a price approaching $967. Is that prediction? Absolutely not. But it is evidence of what this stock has already demonstrated it can do. AMAT operates at the center of the semiconductor supply chain, supplying the tools required to manufacture advanced chips. If AI spending continues accelerating, data center construction remains strong, and semiconductor capital expenditures keep expanding, another powerful advance is entirely possible. The lesson is simple. This stock has already shown that when institutions decide they want exposure, they are capable of pushing it dramatically higher over a relatively short period of time.
Now let’s examine the other side of the equation. The largest uninterrupted decline over the past 52 weeks was approximately -24%. If a similar decline occurred from today’s price of $585.88, the stock could fall toward $445. That is a decline of roughly $140 per share. Notice something important. The stock has already experienced several corrections ranging from 11% to nearly 24% while maintaining its longer-term uptrend. Those pullbacks were not accidents. They were part of the normal behavior of the asset. There is no reason to believe that volatility suddenly disappears because a company is performing well. Strong stocks often experience sharp corrections precisely because they attract so much attention. The downside is always possible, even when the long-term story remains intact.
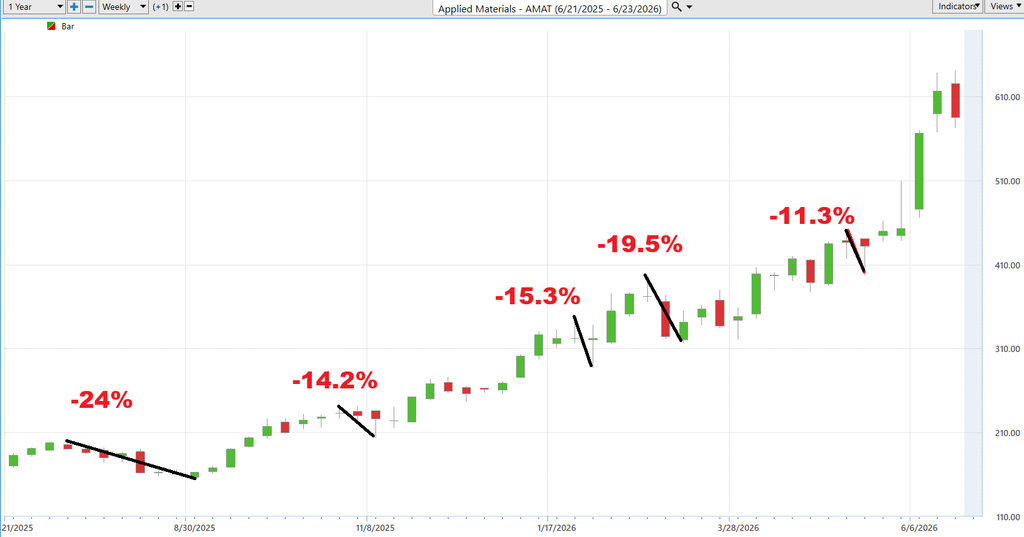
This is the reality every trader faces. The same stock capable of delivering a 65% rally is also capable of delivering a 24% decline. Most traders spend their time dreaming about the upside while completely ignoring the downside. Professionals do the opposite. They begin with risk. They ask themselves whether they can survive the inevitable pullback before they ever think about the potential reward. This exercise is not about predicting what Applied Materials will do next. It is about preparing for what it could do next. If you understand both sides of the equation, position sizing becomes easier, expectations become more realistic, and emotional decision-making becomes less dangerous. The takeaway is straightforward: if you cannot tolerate a 24% decline, you have no business expecting to capture a 65% rally.
Nest we compare th4e performance of $AMAT to the broader stock market averages.
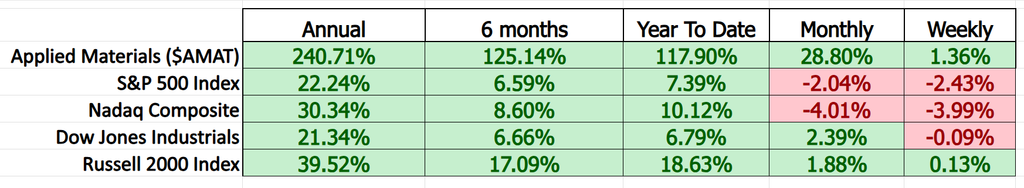
Applied Materials is not outperforming the market. It is lapping the market. If the S&P 500 is the family sedan cruising down the interstate, AMAT is the fighter jet that just broke the sound barrier and forgot to tell everyone else where it was going. Over the last twelve months, AMAT has gained 240.7%, compared to 22.2% for the S&P 500, 30.3% for the Nasdaq, and 39.5% for the Russell 2000. When a stock produces that kind of spread over every major benchmark, it tells you something important. Institutions are not merely participating. They are accumulating. Relative strength on this scale rarely happens by accident. It usually reflects a powerful underlying theme, and in AMAT’s case that theme is the global buildout of AI infrastructure and semiconductor manufacturing capacity.
The story becomes even more interesting when you shorten the time horizon. Over the last six months, AMAT is up 125.1% while the S&P 500 has gained just 6.6%. Year-to-date, AMAT has advanced 117.9% versus 7.4% for the S&P 500. That’s not incremental outperformance. That’s dominance. It means money managers who chose AMAT instead of a broad index dramatically improved portfolio returns. The market loves to talk about diversification. Wall Street loves to talk about risk management. Yet the biggest gains almost always come from concentrated exposure to a handful of true leaders. AMAT has been one of those leaders.
What may be most revealing is the recent action. Over the last month, AMAT gained 28.8% while the S&P 500 and Nasdaq both declined. Even during the most recent week, while major indexes struggled to gain traction, AMAT still managed a positive return. That’s the hallmark of institutional sponsorship. When the market sneezes and a stock keeps walking forward, traders pay attention. Strong stocks tend to remain strong because professional money managers cannot buy billions of dollars worth of shares all at once. They accumulate over time. The numbers suggest that process may still be underway.
The practical takeaway is simple. Professional traders constantly ask one question: “What is winning?” AMAT has been one answer to that question, loudly, across every meaningful timeframe. Could the stock correct? Of course. Every strong trend eventually pauses, consolidates, or pulls back. But until the relative performance numbers begin deteriorating, the evidence suggests AMAT remains a leader rather than a laggard. In markets, leaders deserve attention. Laggards deserve explanations. Right now, Applied Materials is still firmly in the first category.
Vantagepoint AI Predictive Blue Line
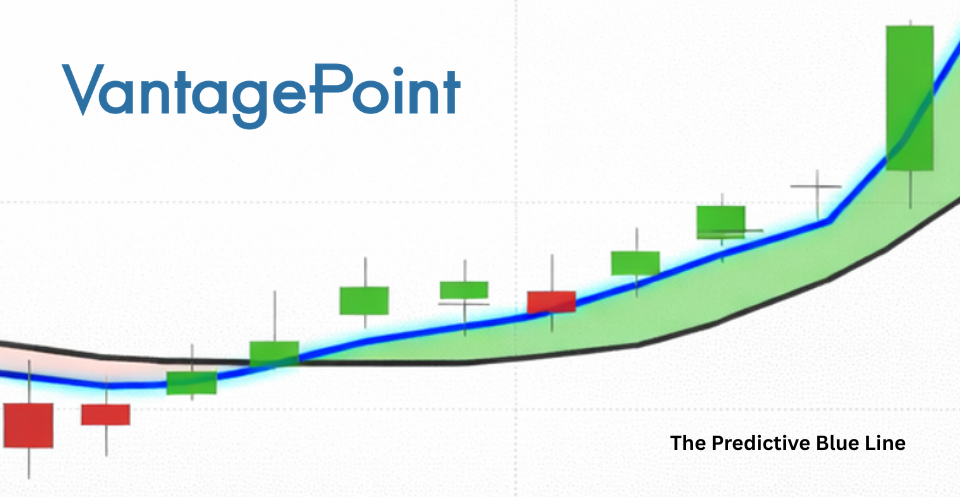
The first thing traders should notice is the slope of the Predictive Blue Line. The slope is the short-term direction of the stock. Right now, the Predictive Blue Line remains firmly pointed higher, which tells us the short-term forecast is still bullish. More importantly, the blue line has spent most of the past several weeks separating itself from the black 10-day moving average. That widening gap reflects strengthening momentum. Study the chart closely and you’ll notice something else. In strong uptrends, the Predictive Blue Line often acts as a support reference point. Price frequently pulls back toward the blue line, or slightly below it, before buyers step back in. That behavior has repeated several times during this advance. The forecast remains positive, but the recent flattening near the highs suggests the rally may be taking a brief pause rather than accelerating higher immediately.
The relationship between the Predictive Blue Line and the black 10-day moving average remains constructive. The blue line is clearly above the black line, which confirms that the forecast is aligned with the existing trend. There has been no bearish crossover and no meaningful breakdown in the relationship between the two indicators. In fact, the black line continues to rise steadily underneath the blue line, creating a healthy trend structure. When the forecast line remains above the moving average, traders view the trend as confirmed. The distance between the two lines has narrowed slightly over the last few bars, but not enough to suggest a reversal. At this stage, the trend appears to be consolidating gains rather than transitioning into weakness.
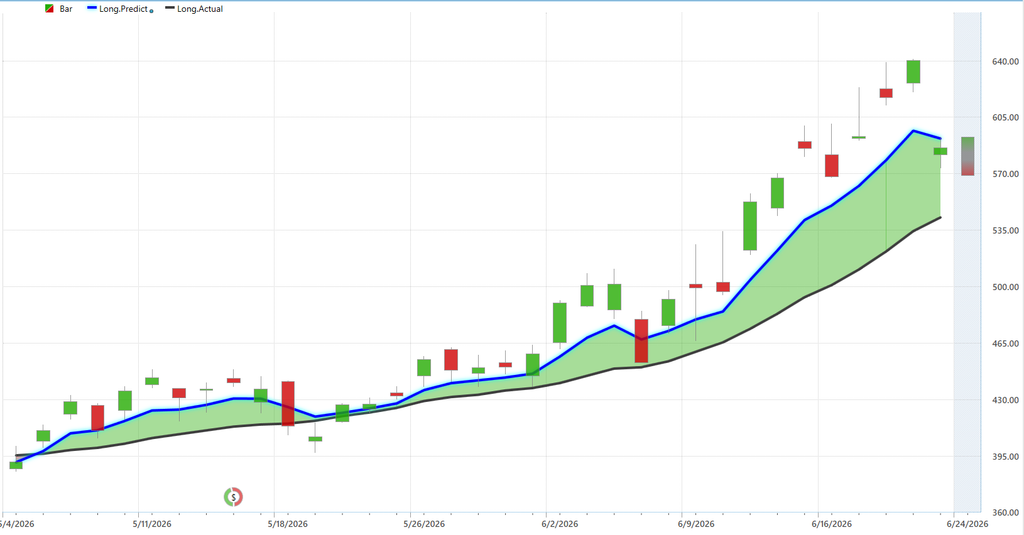
For traders, the practical lesson is straightforward. This remains a buy-the-pullback environment rather than a chase-the-breakout environment. The stock has enjoyed a powerful run higher, and price currently sits above both the Predictive Blue Line and the moving average. Historically, stocks rarely move in a straight line forever. They tend to gravitate back toward the Predictive Blue Line, allowing traders an opportunity to enter at more favorable prices. Risk begins to increase if the blue line starts rolling over and moves below the black line. That would signal that momentum is weakening and that the trend may be changing. Until that happens, the path of least resistance remains higher. The setup still favors trend-following traders, and the Predictive Blue Line continues to suggest that weakness should be viewed as a potential opportunity rather than a reason to panic.
VantagePoint AI Neural Index (Machine Learning)
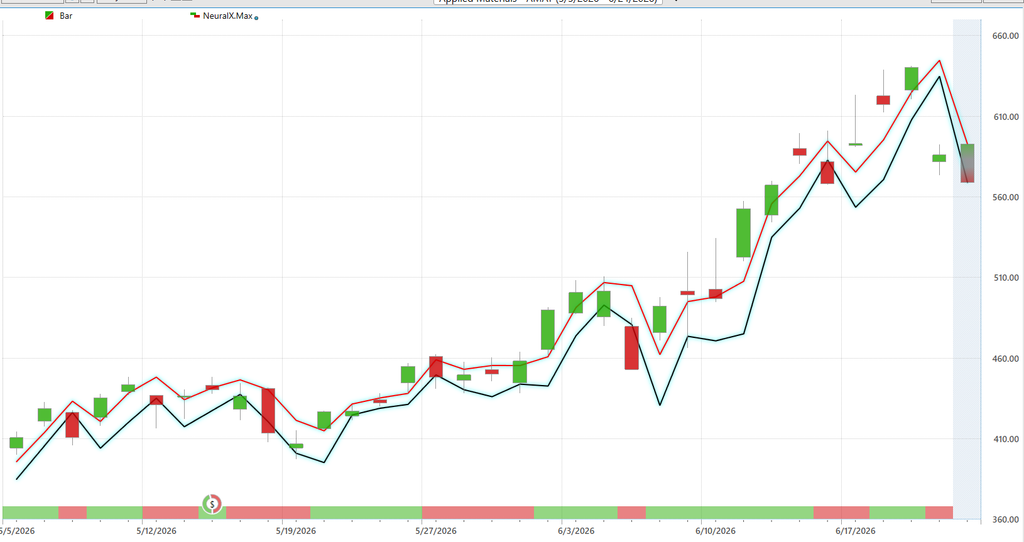
Look closely at the chart with the Neural Index at the base.
At the bottom of the chart is the Neural Index. It is not trying to predict the exact price of Applied Materials tomorrow morning. It is doing something arguably more valuable. It is estimating the most probable direction of future price movement by analyzing thousands of intermarket relationships, statistical patterns, and market behaviors simultaneously.
Think about what that means.
Most traders look at a chart and see only Applied Materials. The neural network is looking at Applied Materials, semiconductor stocks, technology ETFs, market indexes, interest rates, currencies, commodities, institutional money flows, and dozens of other variables all at the same time. It is searching for patterns that historically preceded higher or lower prices before those moves become obvious on the chart itself.
That is why the Neural Index is so useful when paired with the Predictive Blue Line.
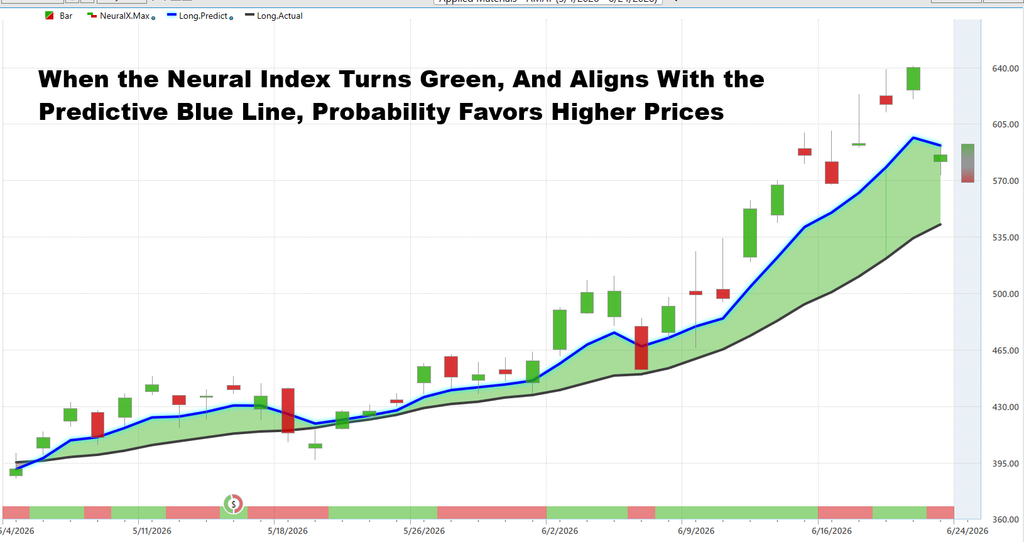
Notice what happened throughout this rally. The Neural Index spent the overwhelming majority of its time green. During that period, the Predictive Blue Line continued rising above the black moving average and the stock advanced from roughly $390 to over $585. The neural network was essentially saying, “The probabilities still favor higher prices,” while many traders were busy arguing whether the stock had gone up too far.
More importantly, notice the red periods.
Every time the Neural Index turned red, Applied Materials either paused, consolidated, or pulled back toward the Predictive Blue Line. Those red signals were not forecasting catastrophe. They were warning that the short-term probability of higher prices was weakening and that the stock might need time to digest its gains.
That distinction matters.
Most traders interpret every pullback as either a buying opportunity or the beginning of a crash. The neural network helps remove some of that emotional guesswork. It identifies when probabilities are improving and when probabilities are deteriorating.
The real value is not predicting every twist and turn.
The real value is helping traders stay aligned with the dominant trend while avoiding unnecessary emotional decisions.
In the current chart, the Neural Index has recently returned to green while the Predictive Blue Line remains above the black moving average. That combination tells traders that the larger uptrend remains intact despite the recent volatility. The stock may continue to fluctuate from week to week, but the probabilities still favor higher prices rather than a major trend reversal.
This is the key lesson.
Price tells you what has happened.
The Predictive Blue Line tells you where the trend is likely headed.
The Neural Index tells you whether the odds are improving or deteriorating.
When all three are working together, traders gain something that most market participants never have: an objective framework for making decisions before the crowd reaches the same conclusion.
VantagePoint AI Daily Range Forecast
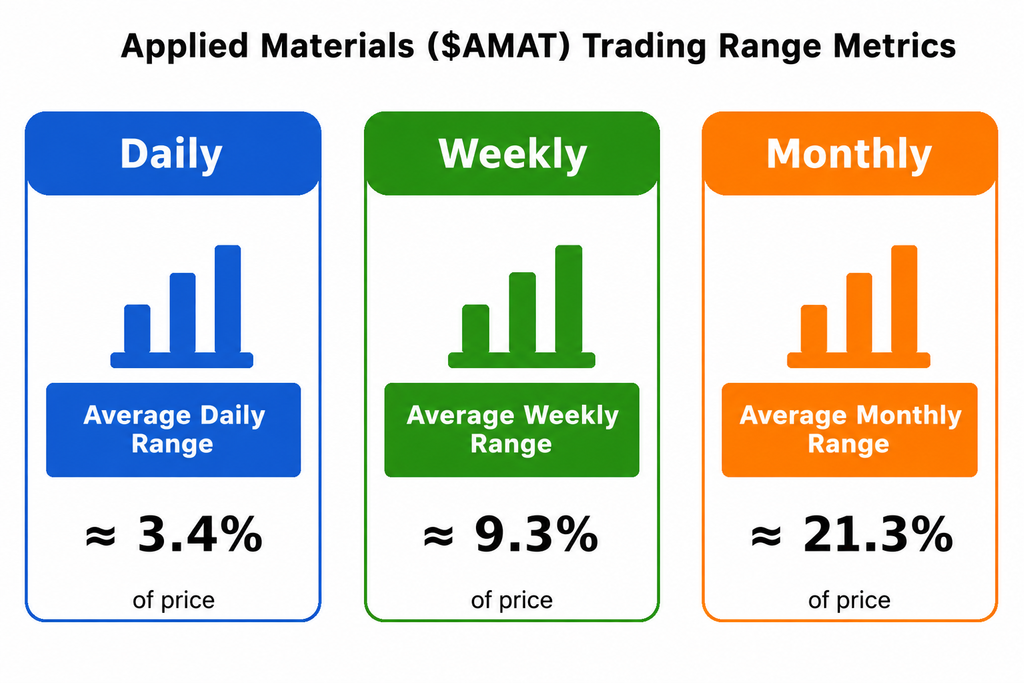
Every stock has its own personality. Some barely move from one day to the next. Others behave like they drank three cups of espresso before the opening bell. Applied Materials falls into the second category. With an average daily trading range of approximately 3.4%, AMAT has demonstrated a consistent ability to cover meaningful ground in a single session. The purpose of the Daily Range Forecast is not to predict where the stock will close tomorrow. Its purpose is far more practical. It provides traders with an objective estimate of where price is most likely to travel during the next session. Professional traders use these projected boundaries the same way a pilot uses a flight plan. They establish expectations before the market opens so they can respond rationally instead of emotionally once volatility arrives.
Looking at the current setup, AMAT enters the next session after an extraordinary advance that has carried the stock toward the upper end of its recent trading range. The forecast suggests there is still room for price movement in both directions, but the key observation is that the projected range is wider than what traders typically experience during an average session. That tells us expectations for movement remain elevated. Momentum has clearly favored buyers over the past several weeks, but momentum rarely travels in a straight line. Markets breathe. They expand, contract, pause, and resume. The Daily Range Forecast helps traders visualize those likely boundaries before the market begins searching for them in real time.
This is where the forecast becomes useful. Traders often use projected range boundaries to identify areas where opportunity may begin to emerge and where risk starts to increase. When price approaches forecast extremes, emotions tend to rise and decision quality tends to fall. Chasing strength near the upper end of a projected range or panicking near the lower end often produces poor results. Instead, traders use the forecast as a planning tool. It helps identify potential entry areas, profit objectives, and locations where momentum may begin to stall. The Daily Range Forecast is not a promise. It is not a certainty. It is a probability-based roadmap designed to help traders answer three critical questions before the market opens: Where can price reasonably travel next? Where does opportunity exist? And where does risk begin to increase? Those traders who prepare for multiple outcomes are usually far better positioned than those who simply react after the move has already occurred.
VantagePoint AI Intermarket Analysis
Intermarket analysis is simply the study of how different markets influence one another. Think of it like a championship football team. The quarterback may get all the attention, but he only succeeds because the offensive line blocks, the receivers run the correct routes, and the defense gets the ball back.
Stocks work the same way. No stock moves in a vacuum.
Applied Materials may be the star of today’s story, but the chart in front of us shows more than 30 different relationships helping shape its price action.
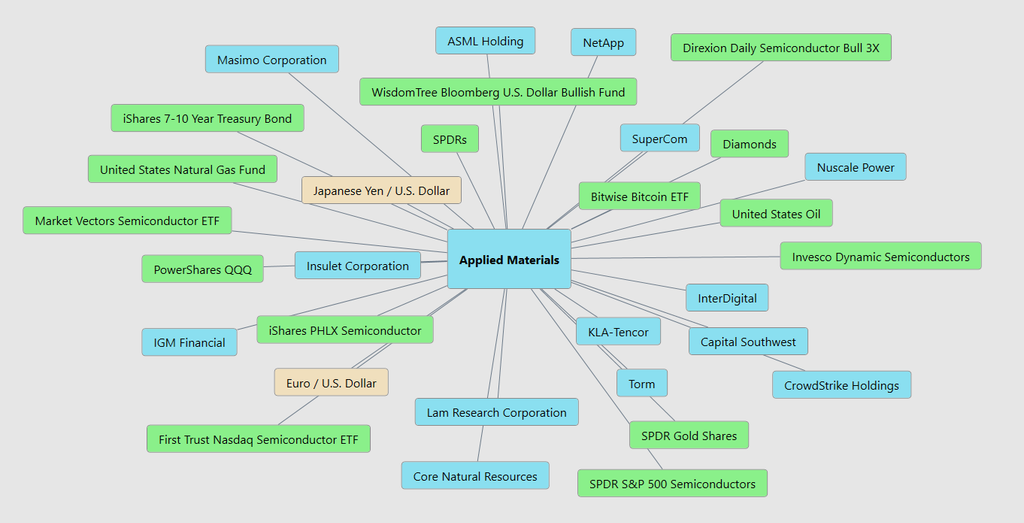
Semiconductor ETFs such as the Market Vectors Semiconductor ETF, the iShares PHLX Semiconductor ETF, and the First Trust Nasdaq Semiconductor ETF are all acting as powerful tailwinds. Leveraged semiconductor exposure through Direxion Daily Semiconductor Bull 3X reinforces the same message. Industry leaders like ASML and Lam Research are moving in harmony with AMAT, confirming strength across the semiconductor ecosystem. Meanwhile, the presence of the U.S. Dollar Fund, Treasury Bonds, Oil, Gold, Bitcoin, the Japanese Yen, and the Euro reminds us that money is constantly choosing where it wants to live. One of the hidden advantages of intermarket analysis is that it often uncovers tomorrow’s opportunities hiding inside today’s relationships. Many traders discovered Lam Research, ASML, and KLA-Tencor long before they became household names simply because they appeared repeatedly inside the same intermarket networks.
The encouraging message from this network is that most of the evidence is pointing in the same direction. The semiconductor group is not acting alone. The ETFs are participating. The equipment manufacturers are participating. The technology infrastructure names are participating. Even the broader technology benchmarks like QQQ are helping validate the move. When a stock rises while its peers lag behind, caution is warranted. That is not what we see here. Instead, we see a broad coalition of related assets all marching in the same direction. The dollar remains a variable worth monitoring because a sharply rising dollar can pressure global technology spending. Interest rates also matter because semiconductor fabrication plants and AI infrastructure projects require enormous capital investments. But at the moment, the weight of the evidence suggests confirmation rather than conflict. The orchestra is largely playing the same song.
For traders, this matters because strong trends rarely travel alone. The highest-confidence opportunities tend to emerge when multiple markets independently arrive at the same conclusion. AMAT appears to have that support today. That does not mean risk disappears. It never does. If semiconductor ETFs begin underperforming, if industry leaders such as ASML or Lam Research begin rolling over, or if capital starts flowing aggressively into defensive assets such as Treasury bonds, that would be an early warning sign that conditions are changing. Until then, the intermarket evidence suggests the trend deserves respect. The stock is not carrying the weight by itself. It has a large group of supporting actors helping push it higher. When markets agree, trends tend to persist longer than most people expect. Right now, the evidence points toward a high-confidence move rather than a fragile one.
Our Suggestion
Applied Materials sounds like a management team that’s winning, and more importantly, knows why it’s winning.
Over the last two earnings calls, management consistently communicated a message of confidence without drifting into optimism for optimism’s sake. The company continues to benefit from one of the most powerful forces in technology today: the global race to build more advanced semiconductors and artificial intelligence infrastructure. Every new AI model, data center, and high-performance computing system ultimately requires more semiconductor manufacturing capacity. Applied Materials sells many of the tools that make that expansion possible.
What stands out is not simply that demand remains healthy. It’s that management appears to have strong visibility into future customer spending plans. Large chip manufacturers continue investing billions of dollars into new facilities and next-generation production technologies. As a result, Applied Materials is not merely participating in the AI boom. It occupies a critical position in the supply chain that helps enable it.
Management’s primary objective remains straightforward: continue expanding technology leadership while capturing a larger share of semiconductor capital spending. Based on recent results and commentary, they appear to be executing against those goals. The company continues to generate strong cash flow, maintain healthy profitability, and strengthen relationships with many of the world’s largest chip producers.
The biggest concern management appears to have is not competition. It’s uncertainty surrounding the timing of customer spending decisions. Semiconductor manufacturing is a cyclical business. Customers occasionally delay projects, governments adjust trade policies, and global economic conditions can influence capital spending plans. While AI demand remains a powerful tailwind, management understands that even the strongest trends rarely move in a straight line.
Looking ahead, Wall Street expects Applied Materials to remain one of the primary beneficiaries of continued AI infrastructure investment. Investors are less focused on what happened last quarter and more focused on whether demand for advanced semiconductor equipment can remain strong over the next several years. At the moment, management appears confident that the long-term opportunity remains intact.
For traders, the story is relatively simple. This is a company operating in the right industry, serving the right customers, at a time when global demand for computing power continues to expand. As long as semiconductor capital spending remains healthy and management continues executing against its objectives, the trend deserves respect. If spending begins to slow or customer demand weakens materially, that would be the first sign that expectations may need to be recalibrated.
Our suggestion: focus less on quarterly accounting details and more on the larger trend. Applied Materials is winning because its customers are investing aggressively in the technologies shaping the future. Continue practicing disciplined money management on every trade, and use the VantagePoint AI Daily Range Forecast to identify short-term opportunities while keeping the larger trend firmly in view.
It’s not magic.
It’s machine learning.
Disclaimer: THERE IS A HIGH DEGREE OF RISK INVOLVED IN TRADING. IT IS NOT PRUDENT OR ADVISABLE TO MAKE TRADING DECISIONS THAT ARE BEYOND YOUR FINANCIAL MEANS OR INVOLVE TRADING CAPITAL THAT YOU ARE NOT WILLING AND CAPABLE OF LOSING.
VANTAGEPOINT’S MARKETING CAMPAIGNS, OF ANY KIND, DO NOT CONSTITUTE TRADING ADVICE OR AN ENDORSEMENT OR RECOMMENDATION BY VANTAGEPOINT AI OR ANY ASSOCIATED AFFILIATES OF ANY TRADING METHODS, PROGRAMS, SYSTEMS OR ROUTINES. VANTAGEPOINT’S PERSONNEL ARE NOT LICENSED BROKERS OR ADVISORS AND DO NOT OFFER TRADING ADVICE.


