




This week’s AI stock spotlight is Crowdstrike ($CRWD)
Three months ago on May 20th we last wrote about CRWD. At the time we said CrowdStrike was emerging as a major player in AI-driven cybersecurity, cloud protection, and enterprise security. Revenue, recurring revenue, and free cash flow were strong, while management remained confident about future growth. Since publishing that analysis $CRWD has rallied an additional 39%.
Wall Street has rewarded $CRWD with a premium valuation as cybersecurity increasingly became essential infrastructure. But we also warned that high expectations demanded near-perfect execution. Any slowdown in growth, weaker guidance, or softer enterprise spending would quickly pressure the stock.
Most importantly, we said the trend depended on continued strength in technology, software, AI, and cybersecurity. As long as institutional money continued flowing into these leadership groups, the trend favored $CRWD. Weakness across growth stocks and cybersecurity, particularly alongside rising Treasury yields, would be the warning sign to watch.
Today CrowdStrike has more than $5.5 billion in annual recurring revenue, and Wall Street increasingly treats it not merely as antivirus software, but as one of the tollbooths on the road to an AI economy.
CrowdStrike sells security through its Falcon platform. Think of Falcon as a very paranoid digital security guard who never sleeps, doesn’t take lunch, and has been instructed to assume everyone approaching the building may be carrying malware.
The real business is subscriptions. For the twelve months through April 2026, CrowdStrike generated approximately $4.84 billion of subscription revenue versus only about $259 million from professional services. In other words, this is overwhelmingly a recurring software business, which is precisely what Wall Street likes because subscriptions are more predictable than hoping somebody walks into the store Tuesday afternoon carrying a wallet.
Customers can add more Falcon modules covering endpoint protection, cloud security, identity protection, Next-Gen SIEM, threat intelligence, managed detection and response, data protection and increasingly AI security. That cross-selling matters. As of April 30, 51% of subscription customers used six or more modules, 35% used seven or more and 25% used eight or more.
The strategic battle is no longer merely about protecting laptops. It is about becoming the security platform on which the customer’s entire digital nervous system depends.
The revenue story is impressive. CrowdStrike went from less than $900 million of annual revenue in fiscal 2021 to $4.81 billion in fiscal 2026. Growth has slowed because mathematics eventually arrives even at technology companies, but Q1 fiscal 2027 revenue accelerated to 26%, reaching $1.39 billion. ARR reached $5.51 billion, also up 24%.
Here is the six-year picture. 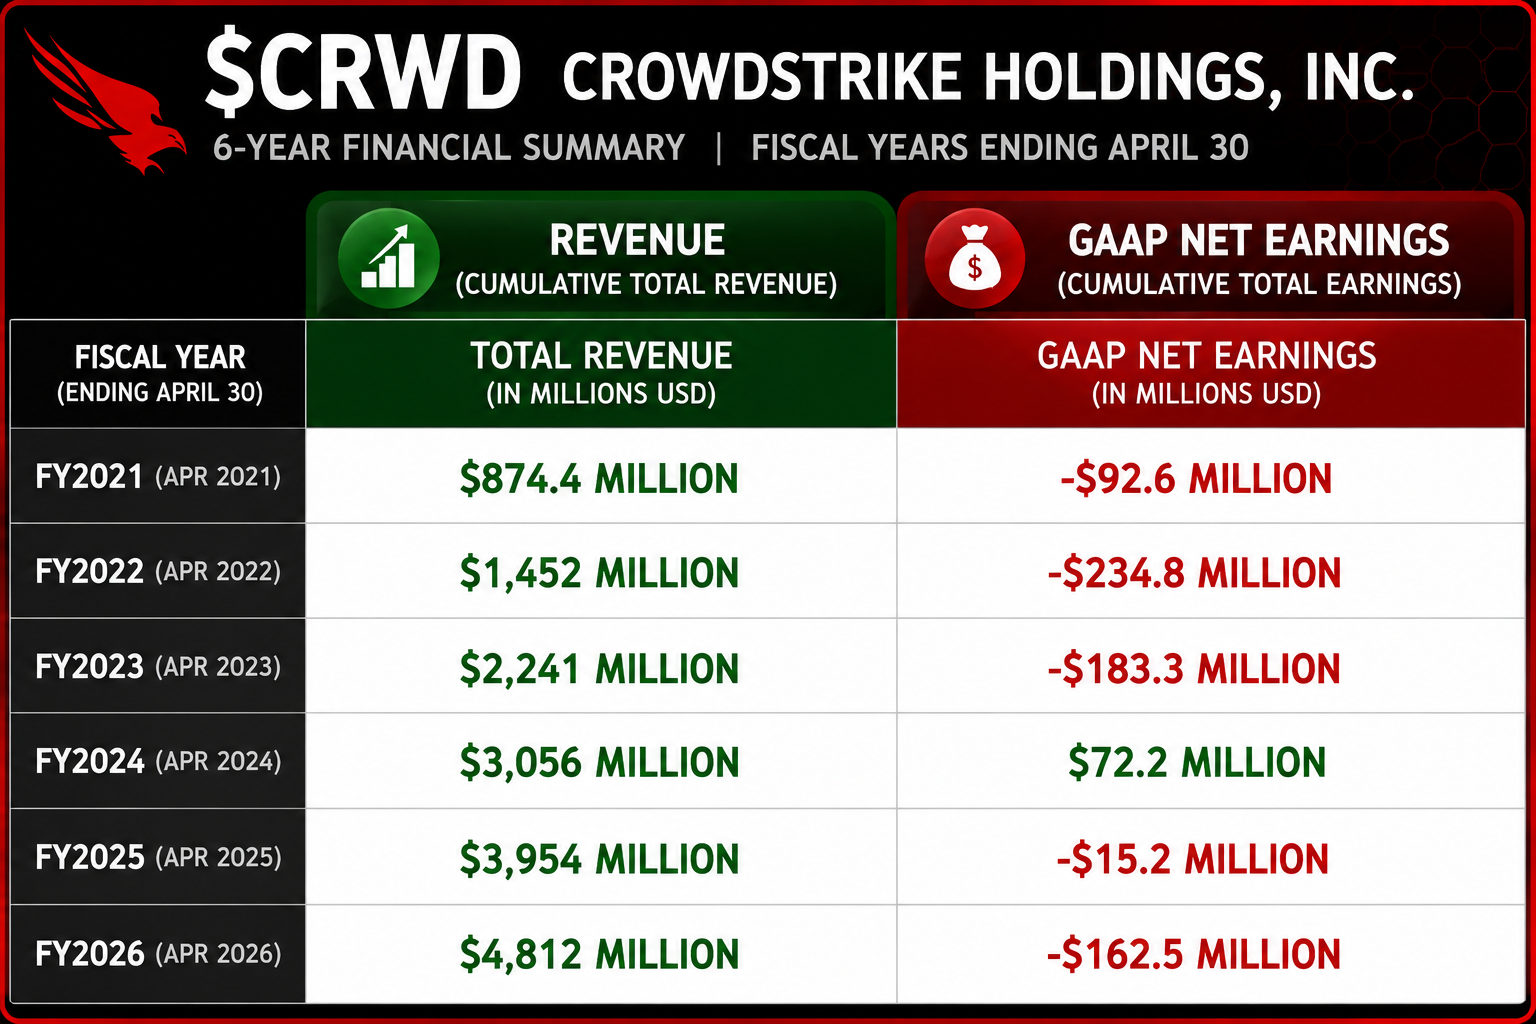 The funny-looking part is obvious. Revenue went up like a Roman candle while earnings wandered around looking for their car keys. This is what traders sometimes misunderstand. CrowdStrike produces enormous cash flow despite inconsistent profitability because stock-based compensation, acquisition expenses, amortization and other adjustments create a substantial gap between earnings and operating cash generation.
The big question is whether CrowdStrike can keep growing more than 20% a year as the company gets much bigger. After its first-quarter results, management became more optimistic and expects annual recurring revenue, or ARR, to reach about $5.79 billion in the second quarter. ARR is important because it shows how much repeat subscription business CrowdStrike has. If that growth suddenly slows, investors may decide the stock is too expensive for a company that is no longer growing as quickly.
The second question is bigger: does AI make CrowdStrike more valuable or eventually make traditional cybersecurity software less valuable? Right now the market is voting enthusiastically for Door Number One. AI agents create new identities, new attack surfaces, new data flows and faster cyberattacks. That means companies may need more automated security, not less. But when investors begin believing something is inevitable, traders should check their wallets.
The message $CRWD is promoting heavily: CrowdStrike wants Wall Street to think “AI security infrastructure,” not “antivirus company.”
Much of that AI enthusiasm is already priced in. What Wall Street may still underestimate is how AI expands the number of machines, agents and identities requiring protection. What it may overestimate is how automatically that opportunity belongs to CrowdStrike. Microsoft, Palo Alto and others are not planning to spend the AI revolution knitting sweaters.
Using the January 2 close of approximately $113.40, the stock has gained roughly 99% year to date. Using the May 11 pre-split close of $542.26, equivalent to approximately $135.57 after July’s four-for-one split, CrowdStrike has gained roughly 66% in about three months.
That is not simply a cybersecurity-sector move. CIBR, the First Trust Nasdaq Cybersecurity ETF, was already benefiting from strong cybersecurity demand this year, but CrowdStrike has dramatically outperformed the broader basket.
The data driving the enthusiasm are less mysterious than the headlines. Q1 revenue grew 26%. ARR (adjustable Recurring Revenue) grew 24%. Net new ARR increased 32% to a record $256 million. Free cash flow hit a record $468 million. Management raised full-year net-new ARR expectations. Those numbers matter more than somebody on television saying “AI” fourteen times before lunch.
Wall Street’s bullish argument therefore has evidence behind it. But analysts have repeatedly underestimated how violently premium software stocks can fall when guidance merely meets expectations. CrowdStrike itself dropped sharply after prior earnings reports despite respectable results. At this valuation, “good” can be bad news. The market isn’t paying for good. It is paying admission to see spectacular.
The upside case is straightforward. CrowdStrike keeps winning endpoint business, customers keep adding modules, Falcon Flex expands spending, Next-Gen SIEM and cloud security continue growing, and AI creates an entirely new security layer protecting models, agents, identities and data. If those businesses scale together, CrowdStrike could become less a cybersecurity product and more a cybersecurity operating system.
The blind spot is valuation combined with expectations. CrowdStrike doesn’t merely have to grow. It has to grow faster than investors already expect. A slowdown in ARR, weaker large-enterprise bookings, falling module adoption or disappointing guidance could produce an impressive demonstration of gravity.
There is also the lesson of July 2024. Cybersecurity companies sell trust. One bad update showed that a company protecting global infrastructure can itself become systemic risk. The business recovered remarkably well, but traders should never forget what the incident revealed.
The next earnings report is the most important catalyst, and is scheduled for August 26, 2026 .
Earnings matter because ARR, guidance and free cash flow can reset the valuation overnight.
CrowdStrike is best suited for momentum and growth traders comfortable owning expensive stocks making new highs. As mentioned it has rallied 39% since our last analysis in May, but what is noteworthy is that it has had two twenty percent corrections in the past 3 months.
For the trend to continue, ARR needs to remain strong, net-new ARR needs to keep expanding, customers must continue adding Falcon modules, free cash flow must remain powerful and AI security must translate into real contracts. Right now, the evidence supports the bulls.
The early warning would be deterioration in net-new ARR, weaker forward guidance or evidence that customers are consolidating security spending somewhere else. Watch those numbers before watching the headlines.
At roughly a 99% YTD gain through August 11, CrowdStrike is telling traders something important. The market believes cybersecurity is becoming more valuable because of AI, not less valuable. Until the operating numbers contradict that story, fighting the trend simply because the stock looks expensive is an excellent way to discover that expensive stocks can become even more expensive.
But remember what you’re buying. CrowdStrike no longer has the luxury of merely being a great company.
At this price, it has to keep proving it.
In this analysis we will review and evaluate forecasts using the following set of indicators and tools.
Wall Street Analysts Ratings and Forecasts
52 Week High and Low Boundaries
Best-Case / Worst-Case Scenario Analysis
VantagePoint AI Triple Cross Indicator
Neural Network Forecast (Machine Learning)
VantagePoint AI Daily Range Forecast
Intermarket Analysis
Our Suggestion
Wall Street Analysts Price Forecasts
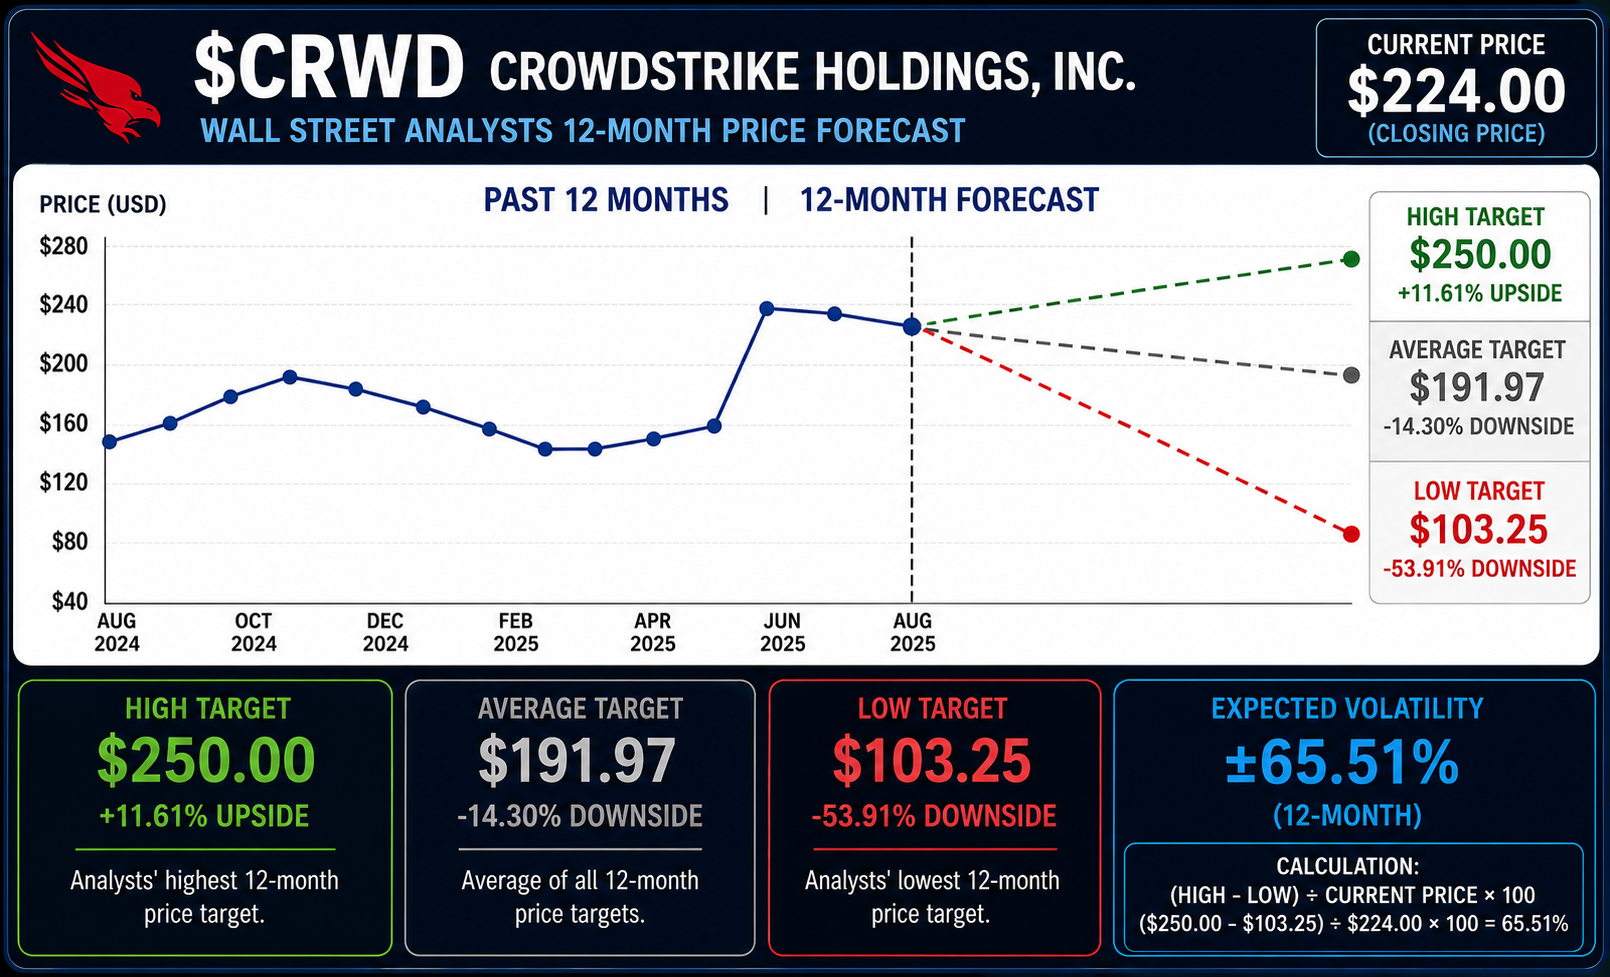
Wall Street’s view of CrowdStrike ($CRWD) presents an interesting contradiction. Analysts remain broadly constructive on the company, with the current consensus rating sitting at Moderate Buy, based on roughly 50 analysts. Yet the stock’s extraordinary run has pushed the price to $221.90, just 2.2% below its 52-week high, meaning the shares have moved faster than many analysts have been able to move their targets.
Using the analyst figures in our graphic, the high target is $250.00, representing 12.67% upside from the $221.90 close. The average target of $191.97 represents 13.49% downside, while the low target of $103.25 represents a substantial 53.47% downside. That enormous spread tells traders something important. Wall Street largely likes the company, but there is considerably less agreement about what investors should be willing to pay for it.
The disagreement becomes even clearer when we measure the entire analyst forecast range. Using our standard formula for expected volatility moving forward, ($250.00 − $103.25) ÷ $221.90 × 100, expected volatility comes to approximately 66.13%. That is an unusually wide range of possible outcomes, and it reflects the fundamental argument surrounding CrowdStrike. Investors are trying to decide how much they should pay today for what could become one of the dominant cybersecurity platforms of the AI era.
The question is no longer simply whether CrowdStrike is a good company. The question is whether the extraordinary expectations already embedded in the stock price leave enough room for disappointment.
That is what traders should focus on. The analysts are bullish on the business, but deeply divided on valuation. With $CRWD trading near its 52-week high while the consensus target sits below the market price, Wall Street is effectively saying that the company may continue performing exceptionally well while the stock becomes increasingly dependent on flawless execution. That gap between a great company and the price investors are willing to pay for it is precisely where both opportunity and risk tend to become amplified.
52-Week High and Low Boundaries
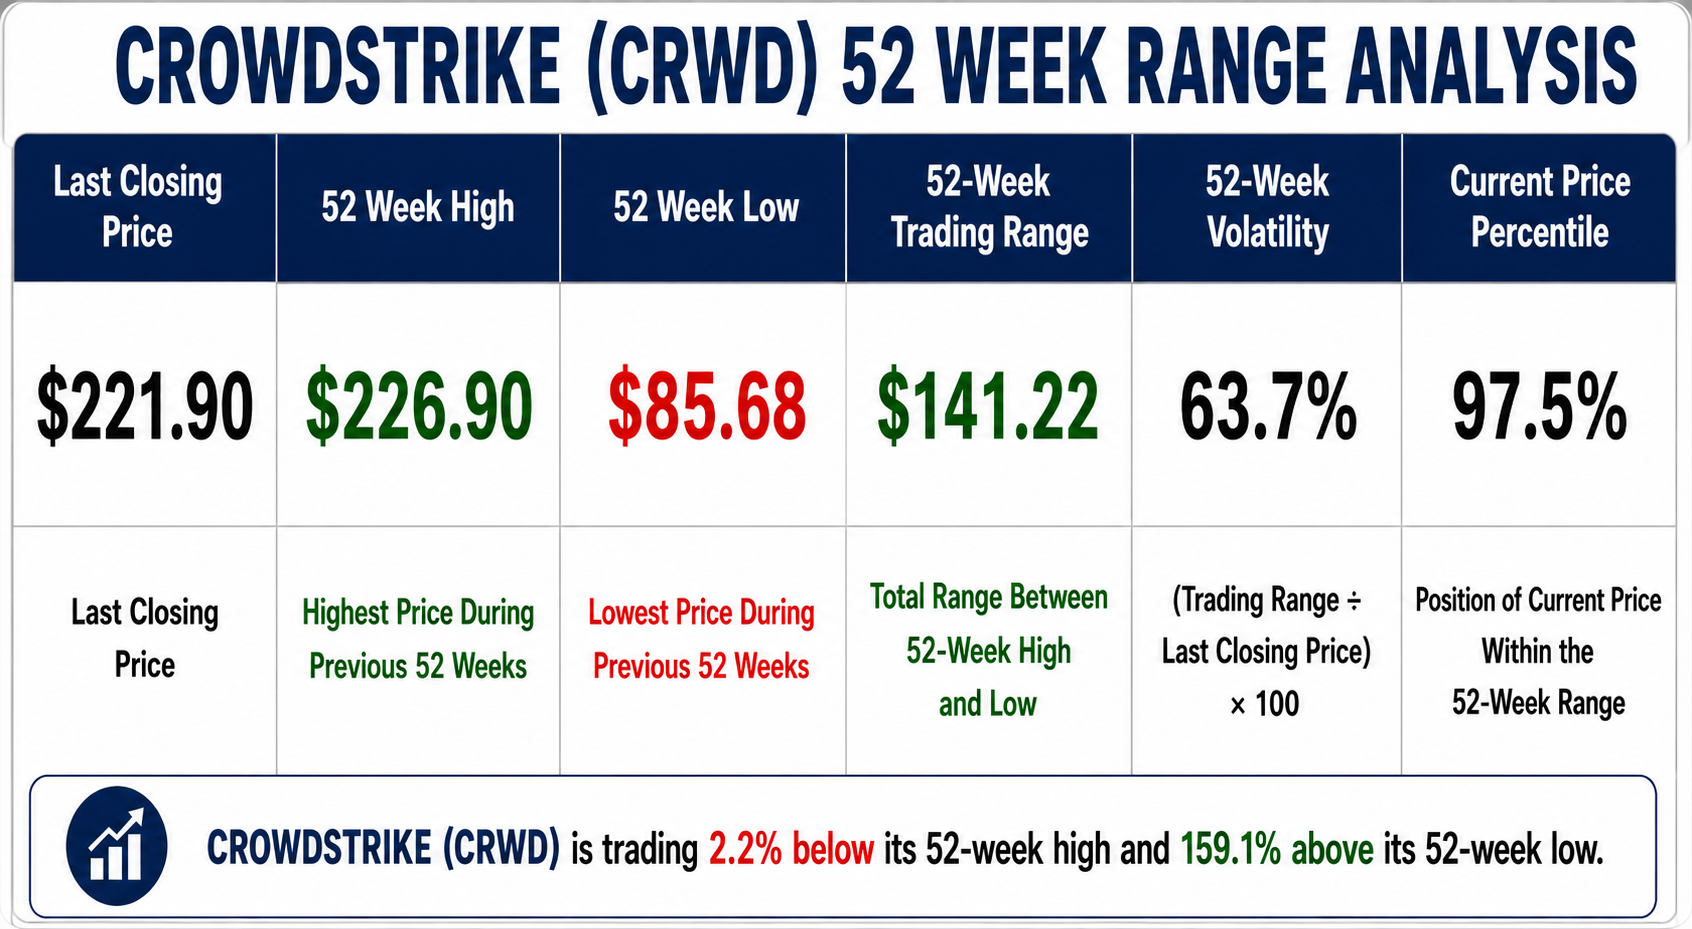
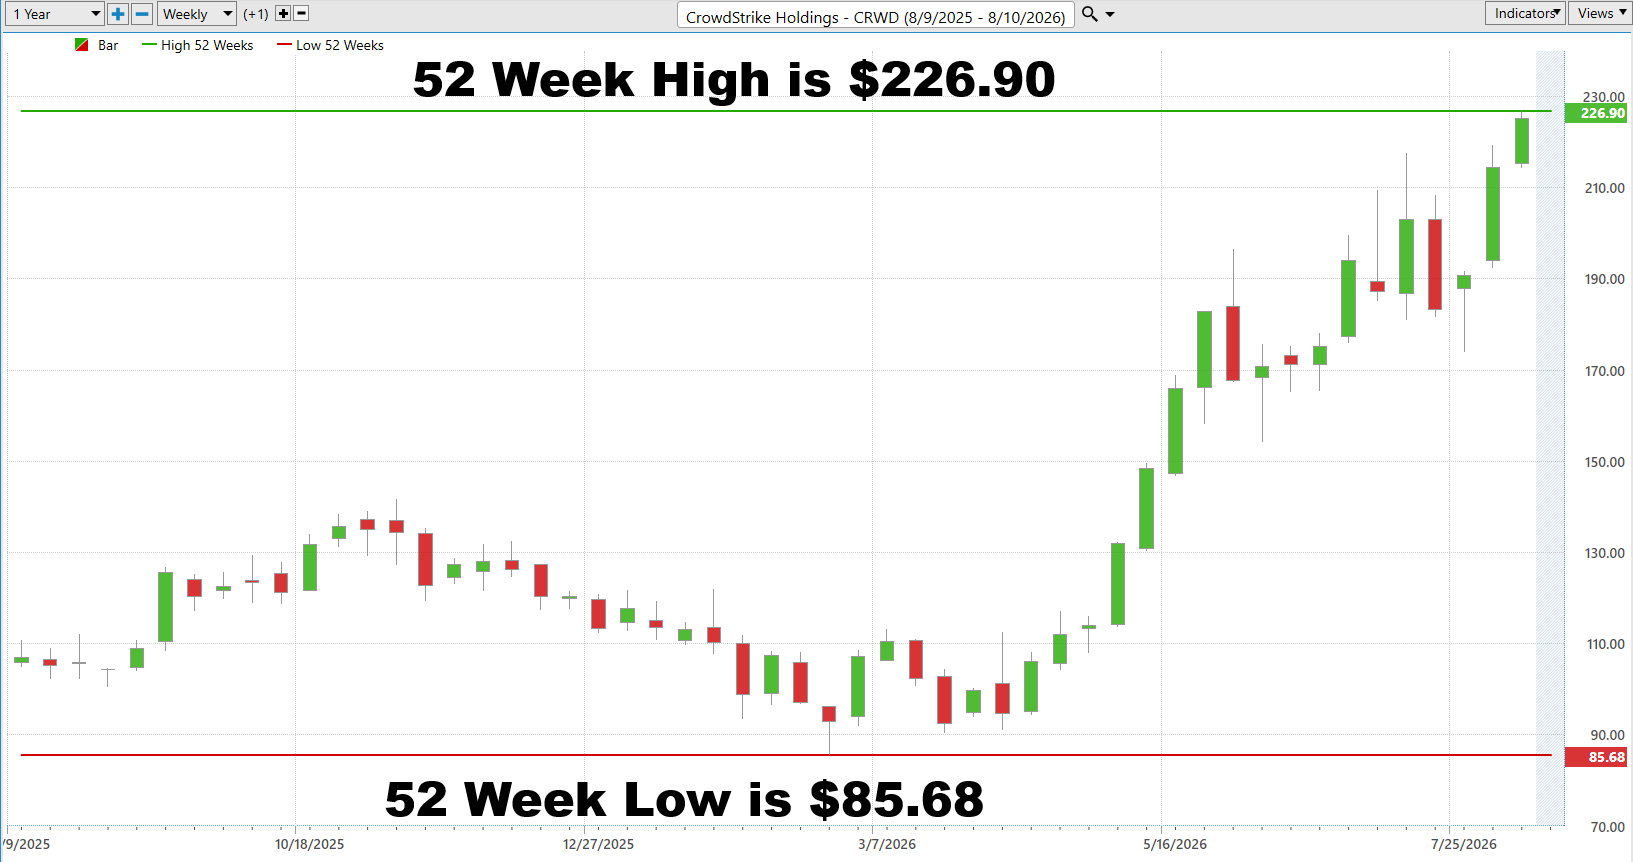
The 52-week boundaries tell the story before the headlines ever get a chance. CrowdStrike ($CRWD) has traded from a 52-week low of $85.68 to a 52-week high of $226.90, an enormous $141.22 trading range. With the most recent close at $221.90, the stock is sitting at roughly the 96.5th percentile of its entire 52-week range, just 2.2% below its high. That is not a stock quietly wandering around Wall Street looking for directions. That is a stock pounding on the ceiling.
Now look at where it came from. CRWD is trading approximately 159.0% above its 52-week low. Traders who insist that a stock must be “too expensive” simply because it has already risen dramatically are ignoring one of the oldest lessons in markets. Strength attracts capital, and winners have an irritating habit of continuing to win. The 52-week high is not automatically a warning sign. It is a boundary that tells us exactly where buyers must prove they are willing to keep paying up.
That makes $226.90 the number that matters. A decisive breakout above that level would establish a new 52-week high and confirm that buyers have absorbed everything sellers have thrown at the stock. Failure at that boundary, particularly if accompanied by weakening momentum, would tell a different story. The point is not to predict which happens. The point is to know where the battle is taking place before everybody else starts explaining it afterward.
The other number traders should respect is the 63.6% 52-week volatility, calculated as ($226.90 − $85.68) ÷ $221.90 × 100. CRWD has demonstrated that it can cover enormous territory. This is the annual trading range divided by the current price. That creates opportunity, but it also demands disciplined position sizing and risk management.
 Best-Case/Worst-Case Scenario Analysis
Volatility is not theoretical. It is what a stock has already proven it can do with real money on the line. Over the past 52 weeks, CrowdStrike ($CRWD) produced major uninterrupted rallies ranging from +29.9% to +111.6%, with individual advances of +29.9%, +32.2%, +39.6%, +40.3%, and +111.6%.
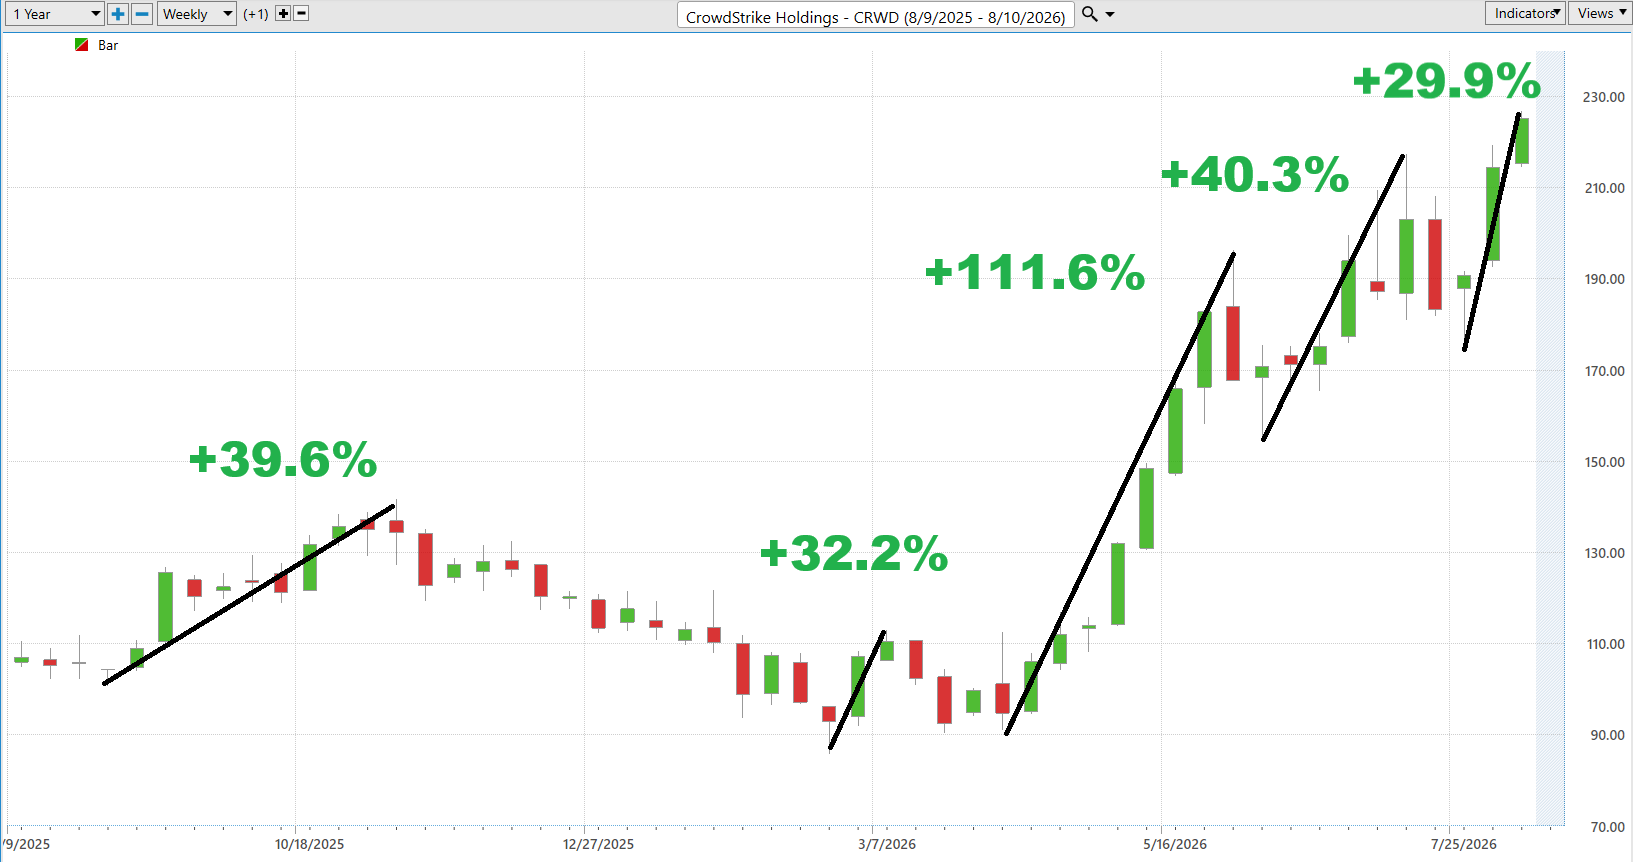
Those are enormous moves, particularly the 111.6% advance, and they demonstrate how aggressively CRWD can move when buyers take control. These moves are not forecasts or price targets. They are historical evidence.
Now look at the other side of the ledger. CRWD’s major uninterrupted declines ranged from -19.8% to -38.6%, including drops of -19.8%, -19.9%, -20.9%, and -38.6%. Three of those corrections clustered around 20%, while the largest erased nearly 39% from the stock’s value. That matters because a trader can be correct about CRWD’s long-term direction and still experience a brutal drawdown along the way. These declines are not hypothetical risks. They are what CRWD has already demonstrated it is capable of doing.
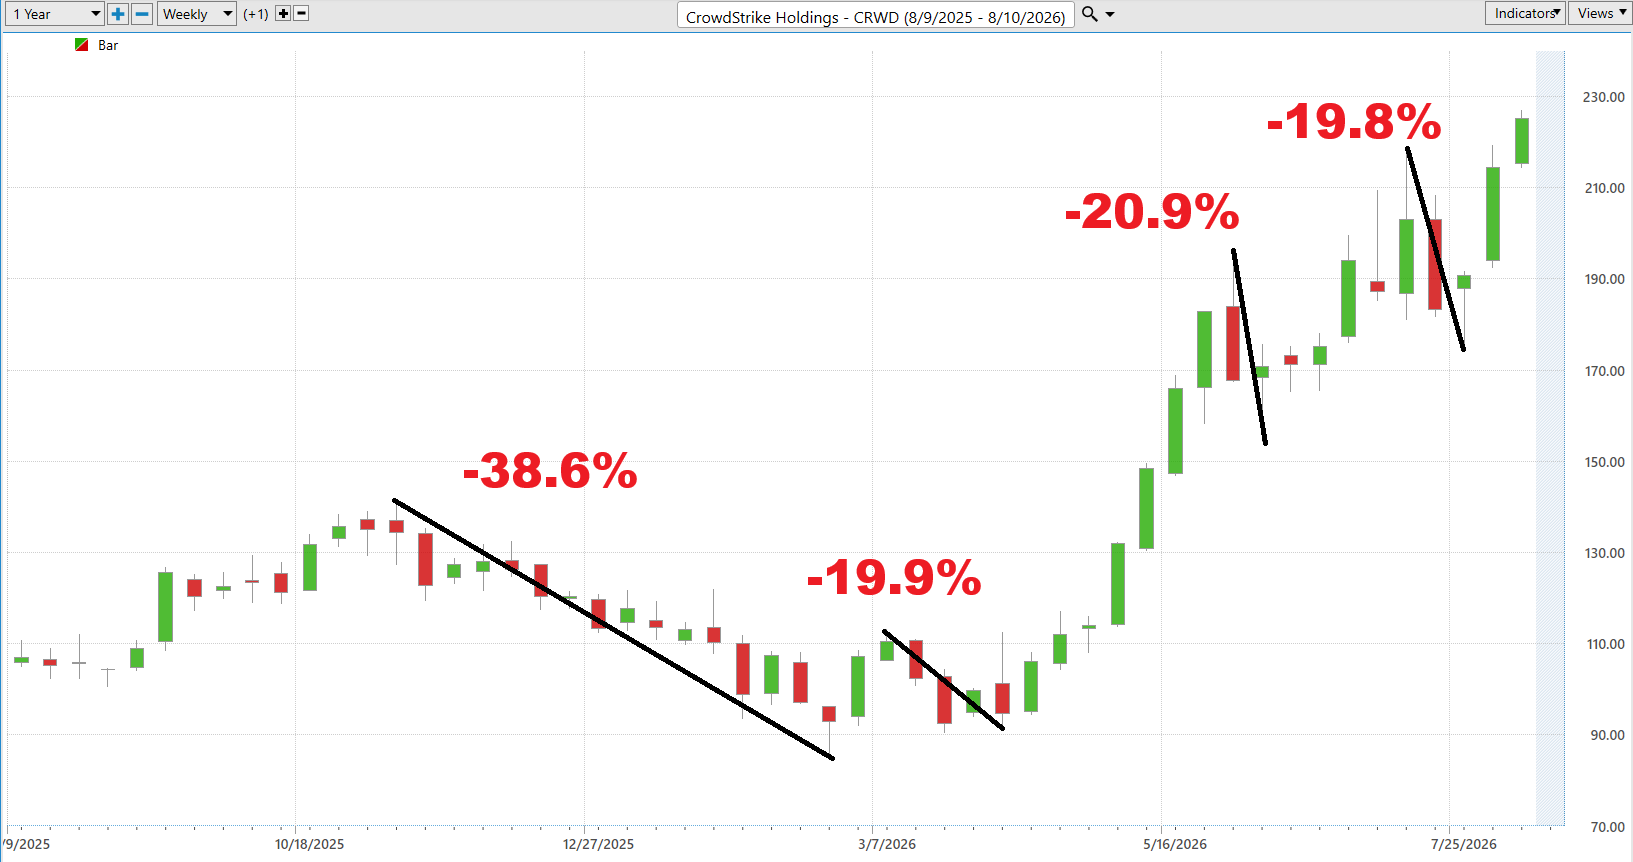
Put the two charts together and CRWD presents an extraordinary but demanding risk/reward profile. Historical rallies have ranged as high as 111.6%, while historical declines have reached 38.6%, demonstrating tremendous upside potential accompanied by substantial downside volatility. None of this tells us what CRWD will do next, but it gives traders a realistic framework for understanding what the stock can do. When a stock routinely moves 20%, 30%, 40% or more, position sizing and disciplined risk management are not optional. They are the price of staying in the game.
Next we compare $CRWD to the major stock market averages and multiple time frames.
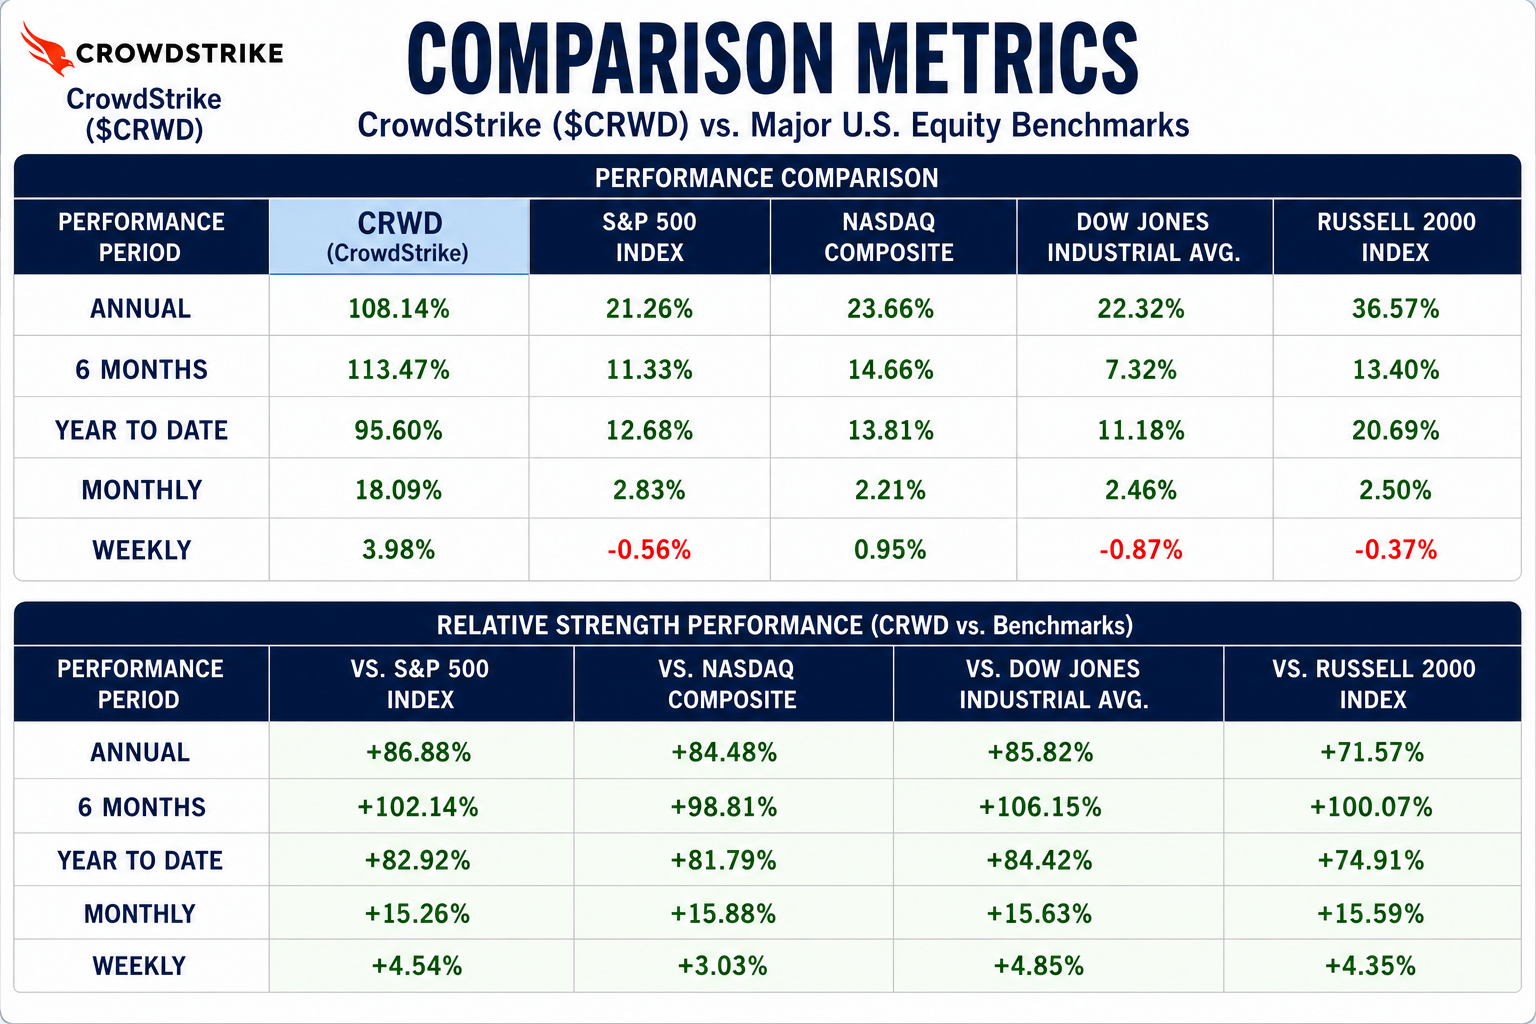
CrowdStrike ($CRWD) is currently beating every major yardstick we can put beside it, across every timeframe shown. Whether you use the S&P 500, Nasdaq Composite, Dow Jones Industrials, or Russell 2000 as your stock-market barometer, the conclusion is identical. Whether you measure one week, one month, year to date, six months, or one year, CRWD has outperformed every benchmark. When different measurements keep delivering the same answer, traders should pay attention.
The magnitude of that outperformance is remarkable. Over six months, CRWD gained 113.47%, compared with just 11.33% for the S&P 500, 14.66% for the Nasdaq, 7.32% for the Dow, and 13.40% for the Russell 2000. Year to date, CRWD is up 95.60%, outperforming those benchmarks by between 74.91 and 84.42 percentage points. Even over the past month, CRWD gained 18.09%, while every major index gained less than 3%.
And the strength isn’t confined to the longer-term numbers. Over the latest week, CRWD gained 3.98% while the S&P 500, Dow, and Russell 2000 actually declined. It beat the S&P 500 by 4.54 percentage points, the Nasdaq by 3.03, the Dow by 4.85, and the Russell 2000 by 4.35. In other words, the market can change the ruler, and CRWD still wins the measurement.
This is why relative strength deserves a permanent place in a trader’s toolbox. You don’t have to argue about which index provides the best picture of the market or which time frame tells the “real” story. Every benchmark and every period displayed here points in the same direction. CrowdStrike is demonstrating exceptional relative strength. That does not guarantee tomorrow’s performance, but when searching for market leadership, this is exactly the kind of evidence you want to see.
VantagePoint AI Triple Cross Indicator
The Triple Cross is one of VantagePoint AI’s more useful ways of separating a genuine trend from ordinary market noise. It combines three predictive moving averages, the 3-day short-term, 8-day medium-term, and 18-day long-term predictive moving averages, to examine momentum across three different time horizons. When the faster predictive averages move above the slower averages and all three begin rising together, the configuration signals strengthening bullish momentum. When they cross below and begin falling together, it warns that momentum may be deteriorating. Rather than claiming to predict the future with certainty, the Triple Cross is designed to give traders an early, data-driven indication that the underlying trend may be changing.
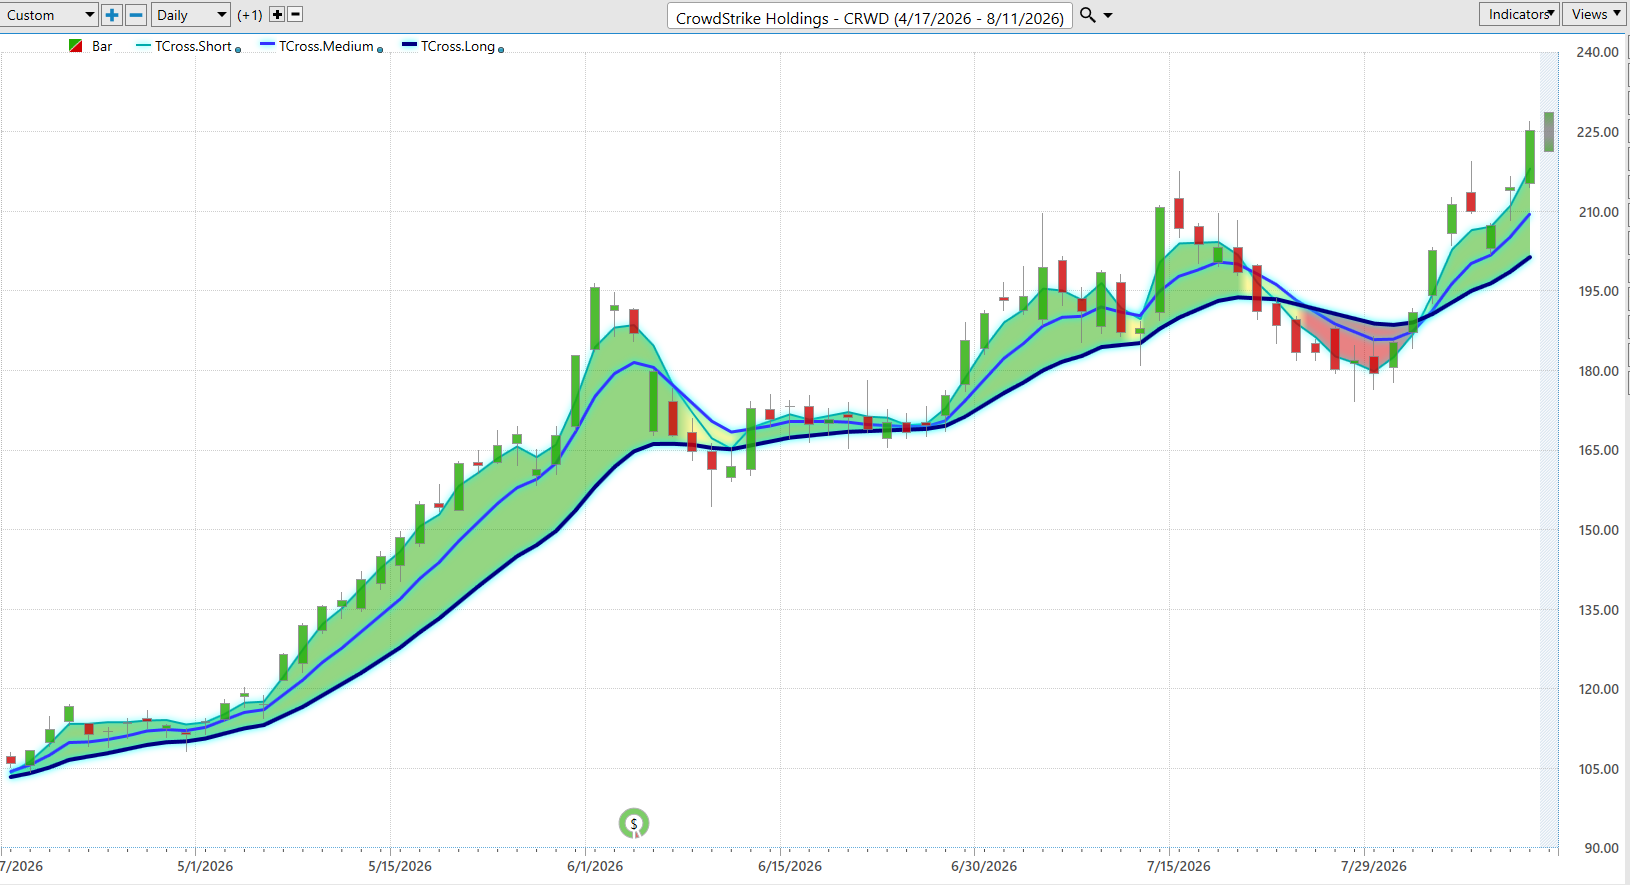
The CRWD chart provides an unusually clear example. From April through early June, the three predictive moving averages became positively aligned and the space between them expanded as the stock accelerated higher. The green shading visually reinforces periods when the shorter-term predictive averages were positioned bullishly relative to the longer-term trend. CRWD advanced from roughly $105 in April to nearly $195 by early June, while the Triple Cross remained predominantly bullish. The important point is that traders did not have to guess where momentum was headed. The alignment of the three predictive averages provided an objective way to measure whether the trend was strengthening or weakening.
Then came the test. In the second half of July, CRWD declined toward $180, the predictive averages compressed and briefly shifted into the red bearish configuration. That was a warning that the previous bullish momentum had weakened. But notice what happened next. The bearish configuration did not persist. The shorter-term predictive averages turned higher, crossed back above the longer-term average, the chart returned to green, and all three predictive averages began rising again.
That last development deserves attention. At the far right of the chart, CRWD is pushing toward $225, while the 3-day, 8-day and 18-day predictive moving averages are bullishly stacked, rising, and spreading apart. In practical terms, short-term momentum is leading medium-term momentum, while both are pulling away from the longer-term trend. That is a substantially stronger technical condition than simply saying, “the stock went up today.” Three different predictive time horizons are currently pointing in the same bullish direction.
There is also an important risk-management lesson hiding in this chart. The Triple Cross should not be treated as a crystal ball, and a bullish alignment does not guarantee that CRWD will continue higher. What it does is give traders a systematic framework for asking a much better question: Are the underlying predictive trends confirming the price move, or beginning to contradict it? Right now, based strictly on the attached chart, the Triple Cross is confirming CRWD’s powerful bullish trend. If those averages begin flattening, converging and eventually crossing, that would provide evidence that the character of the trend is changing.
VantagePoint AI Neural Index (Machine Learning)
The Neural Index is VantagePoint AI’s short-term forecasting tool, designed to anticipate market strength or weakness over the next 48 to 72 hours. The indicator appears along the bottom of the chart. Green signals forecast short-term strength, while red signals forecast short-term weakness. Rather than using the Neural Index by itself, traders can combine it with the broader predictive trend to distinguish temporary price fluctuations from potentially more meaningful changes in direction.
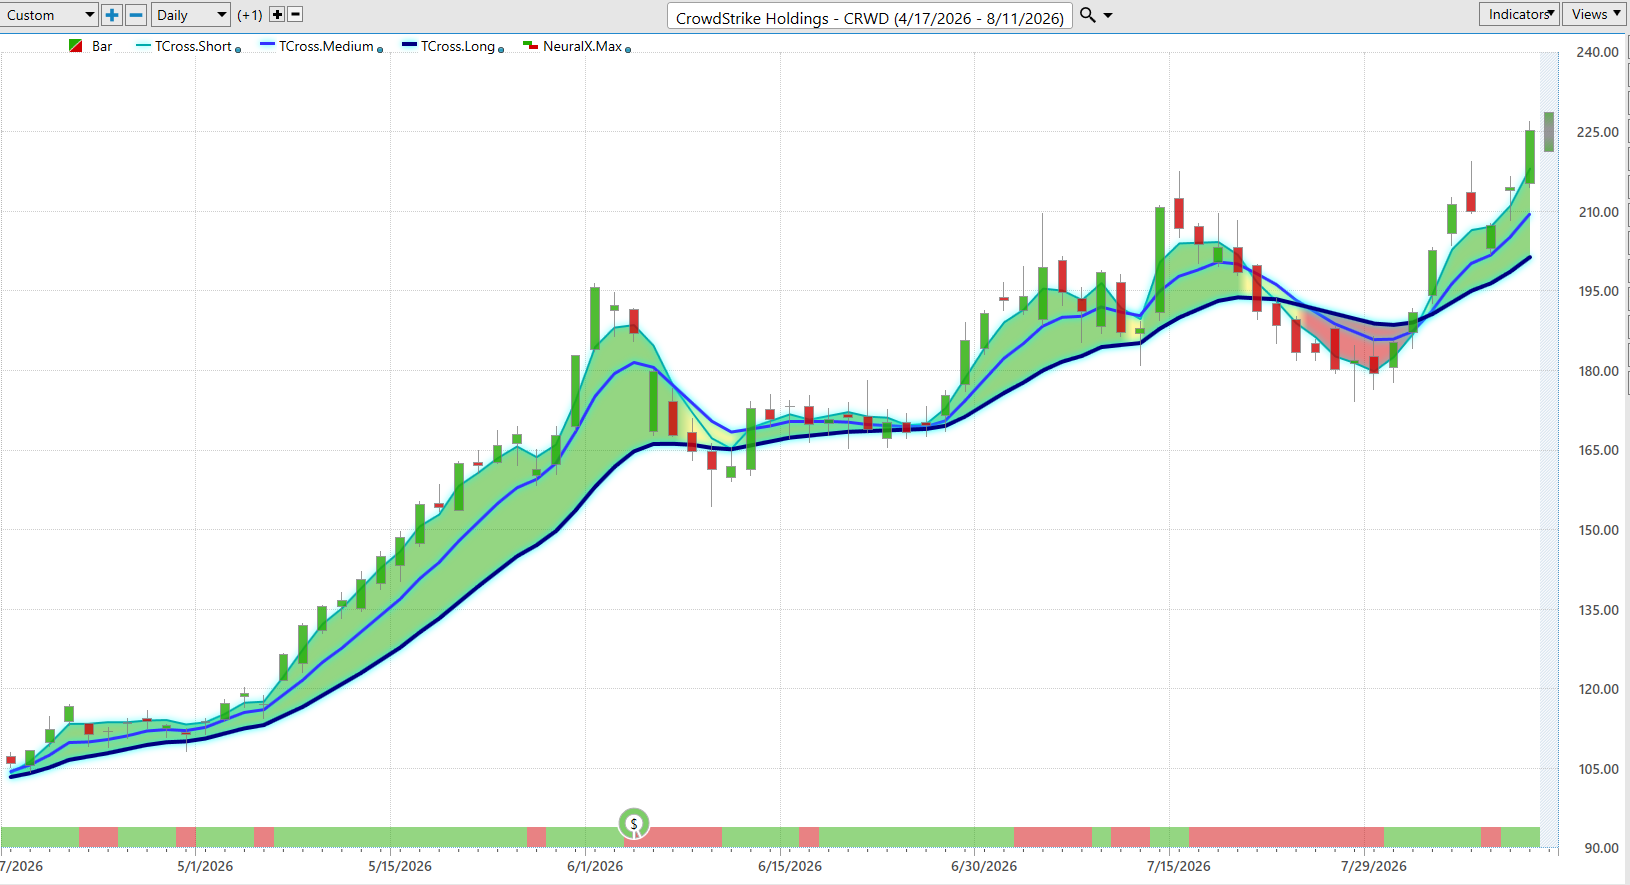
CrowdStrike ($CRWD) provides an excellent example of why that distinction matters. During CRWD’s powerful advance from roughly $105 in April toward $195 in early June, the Neural Index periodically switched from green to red. Those red readings warned of short-term weakness, but the larger predictive trend remained bullish. Instead of automatically interpreting every red signal as the end of the advance, traders could view those signals in the context of the rising predictive moving averages. Short-term weakness and a bearish trend are not necessarily the same thing.
The late-July decline provides the more important lesson. As CRWD fell toward $180, the Neural Index remained predominantly red while the Triple Cross configuration also deteriorated. Here, short-term weakness was being confirmed by deterioration in the broader predictive trend. That combination deserves considerably more attention because multiple predictive indicators were pointing in the same bearish direction.
Now look at the right side of the chart. CRWD subsequently reversed higher, the Neural Index returned predominantly to green, and the Triple Cross turned bullish again as the predictive moving averages separated and accelerated upward. The most recent Neural Index reading shown is green, indicating forecasted strength over the coming 48 to 72 hours, while the broader predictive trend is also bullish. This is what we call double confirmation: the triple cross and the short-term Neural Index are pointing in the same direction.
That does not guarantee CRWD will move higher. What it does provide is a disciplined framework for decision-making. When the predictive trend is bullish and the Neural Index is green, traders have confirmation across two different forecasting horizons. When they disagree, caution becomes more appropriate. Right now, based strictly on the attached chart, CRWD has bullish double confirmation, with both the broader predictive trend and the Neural Index signaling strength.
VantagePoint AI Daily Range Forecast
The VantagePoint AI Daily Range Forecast is designed to forecast a stock’s expected daily high and daily low before the trading session unfolds. Think of those levels as predicted boundaries that give traders a map of where price may travel during the day. They are forecasts, not guarantees, but they can help replace emotional decisions with predefined areas to evaluate opportunity and risk. Instead of guessing where tomorrow’s opportunity and risk may appear, traders begin with predicted price boundaries already in front of them.
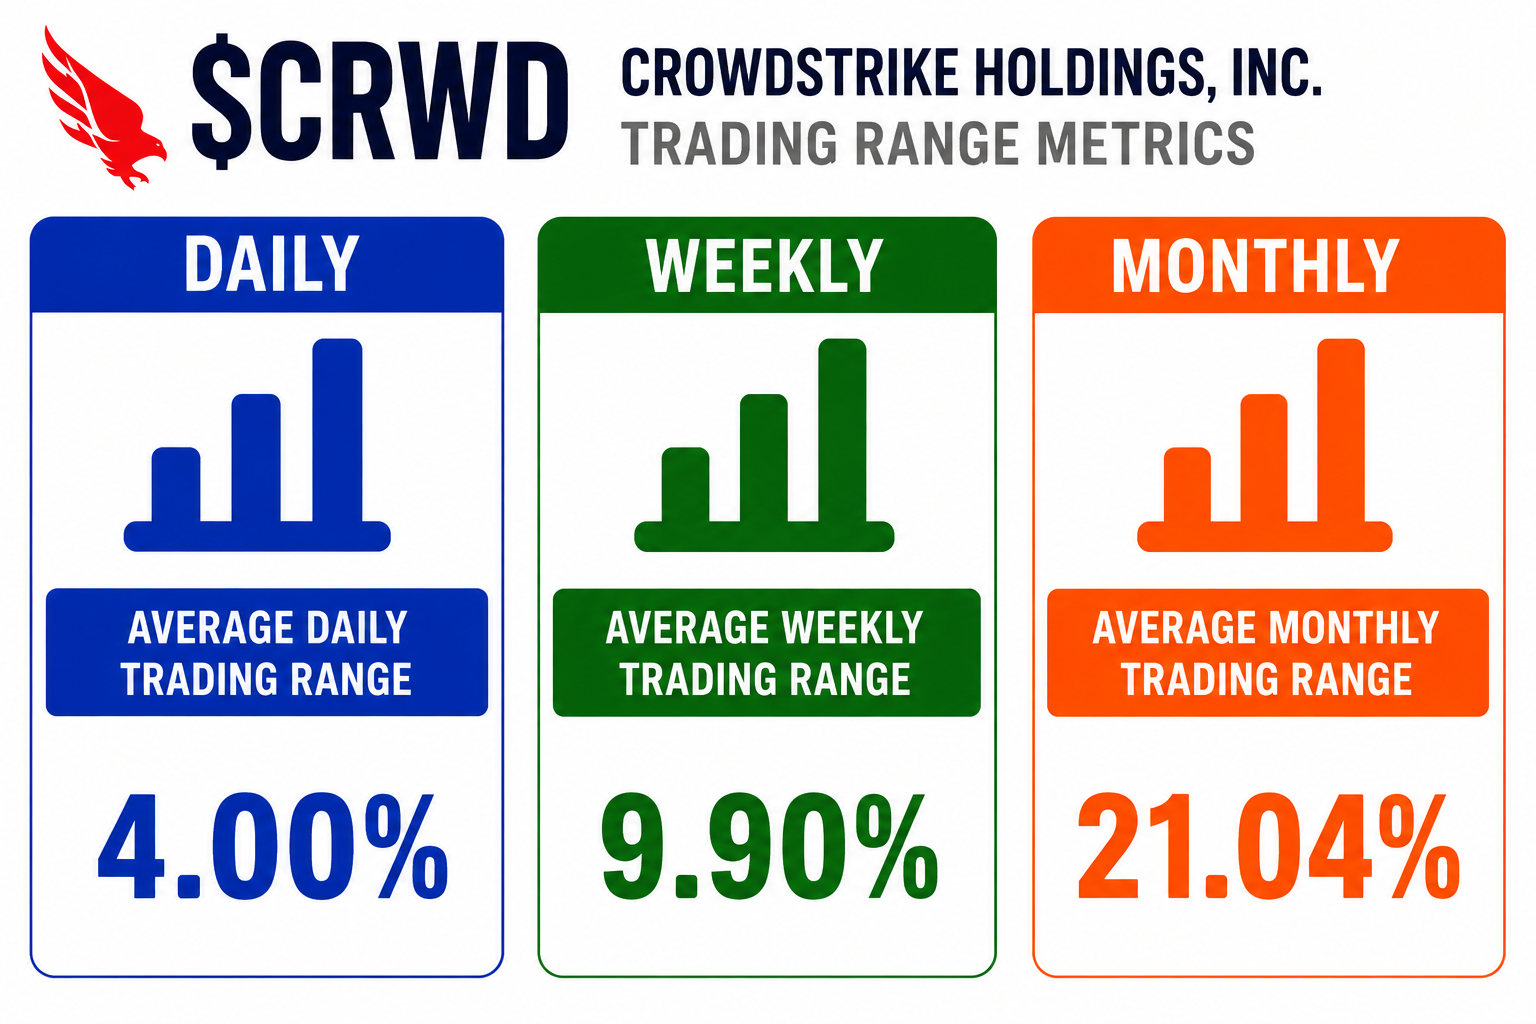
There is more than enough volatility in $CRWD to satisfy even the most discriminating swing trader. Over the past year the average daily range is 4%. The average weekly range is 9.9%, while the average monthly range is 21.04%.
The CRWD chart shows why this matters. During the three-month period displayed, CrowdStrike ($CRWD) repeatedly traded within or reacted around its predicted daily boundaries as the stock advanced from roughly $135 to above $220. The boundaries adjusted as volatility and direction changed, expanding during larger moves and shifting higher as CRWD’s trend strengthened. Most recently, as CRWD rallied sharply from its late-July low near $180, both forecast boundaries turned decisively higher alongside price, confirming the strength of the advance.
This gives traders a practical framework for execution. During a strong bullish trend, the predicted low becomes an area to evaluate potential entries or additions to an existing position, while the predicted high becomes an area to evaluate profit-taking or short-term resistance. If the broader trend turns bearish, those considerations can reverse, with rallies toward the predicted high becoming more important areas to evaluate risk. The boundaries should never be treated as guaranteed support or resistance. Their value comes from giving traders predetermined areas to make decisions rather than chasing price emotionally.
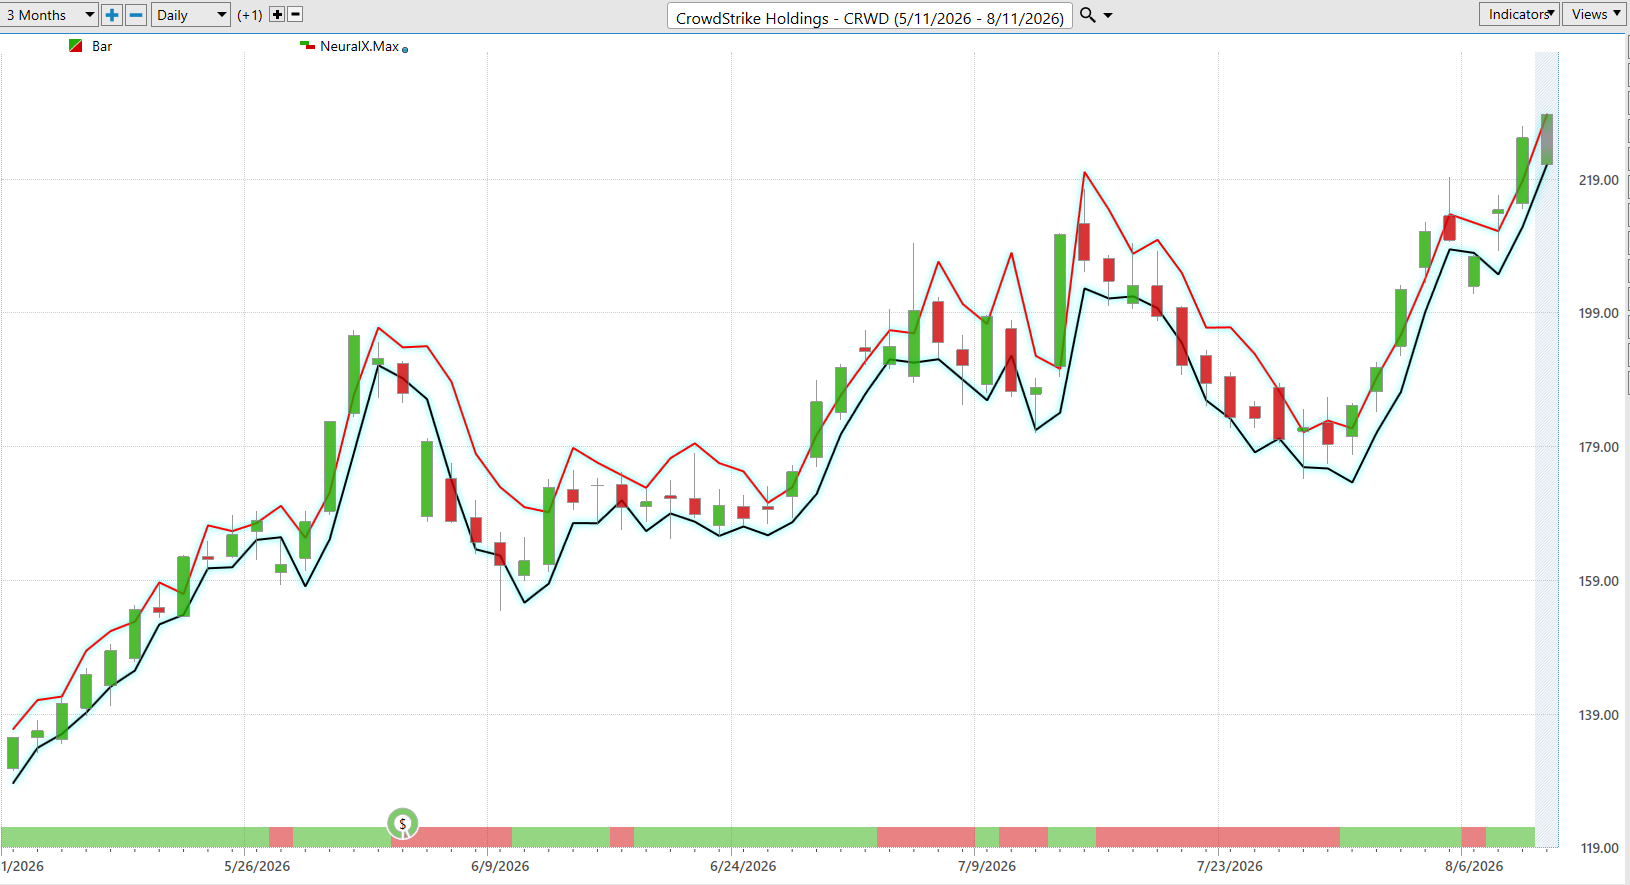
Now focus on the far-right side of the chart. CRWD’s predicted daily high and low are both rising sharply, while price is pressing toward the upper portion of its recent trading range near its 52-week high. That means the Daily Range Forecast is currently confirming rather than contradicting the broader bullish technical picture. It does not tell us that CRWD must continue higher, but it tells us that the expected trading range itself has shifted upward. For traders, that is the real advantage: a forward-looking roadmap for where tomorrow’s battle may occur, combined with disciplined risk management when price gets there.
VantagePoint AI Intermarket Analysis
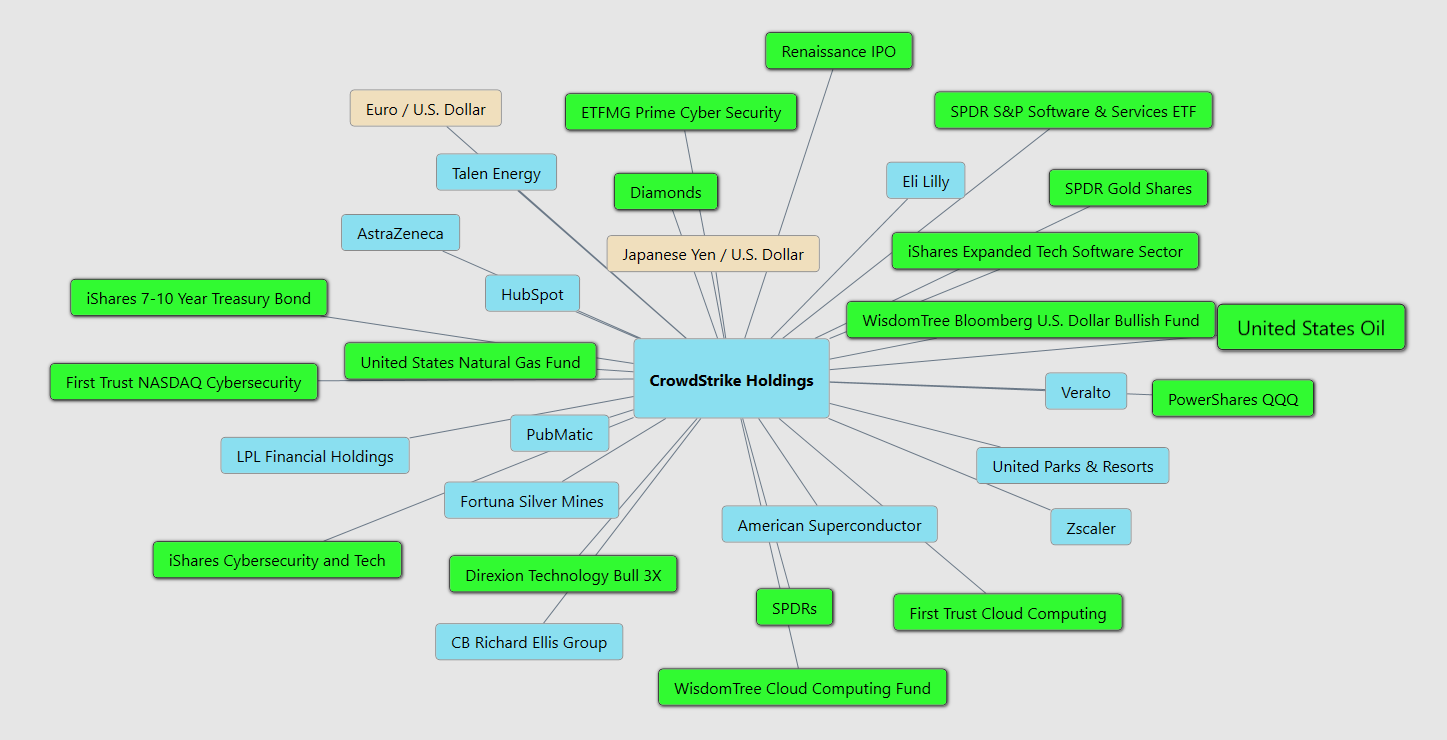
CrowdStrike ($CRWD) does not trade in a vacuum. Its price is connected to a much larger financial ecosystem that includes technology stocks, cybersecurity companies, interest rates, currencies, commodities and global risk appetite. The graphic makes that visible, connecting CRWD to the Nasdaq, software and cybersecurity ETFs, Treasury bonds, the U.S. dollar, yen, euro, gold and energy markets. Intermarket analysis matters because money is constantly moving between these markets, often creating tailwinds or headwinds for CRWD before they become obvious on its own chart.
The strongest relationships surround technology, software and cybersecurity. CRWD is connected to the QQQ as well as multiple cybersecurity, software and cloud-computing ETFs. When those markets are rising together, CRWD has an important tailwind because institutional capital is flowing toward its neighborhood. When CRWD rises while its sector begins weakening, however, traders should pay attention. A stock moving with its ecosystem has confirmation. A stock moving against it has something to explain.
Interest rates add another dimension. CRWD is a growth stock whose valuation depends heavily on expectations for future earnings. Rising yields can make those future profits less valuable while simultaneously making bonds more attractive competitors for investment dollars. Currencies, gold, oil and natural gas provide additional clues about liquidity, inflation, geopolitical stress and global risk appetite. The relationship does not have to be direct. Oil can influence inflation, inflation can influence interest rates, and interest rates can influence technology valuations. Markets operate through chains of cause and effect.
The key insight is that intermarket analysis is really the study of capital migration. Trillions of dollars are constantly choosing between stocks, bonds, currencies, commodities, sectors and countries. CRWD’s chart tells us what happened to CrowdStrike. Intermarket analysis helps explain the financial currents pushing underneath it. When cybersecurity, software, technology, bonds and currencies begin telling the same story, traders gain something far more valuable than another headline: confirmation.
This is the power behind VantagePoint AI’s intermarket analysis. Instead of treating CRWD as an isolated ticker symbol, it examines relationships across markets to identify outside forces that may influence price behavior. When those relationships confirm CRWD’s predictive trend, conviction can strengthen. When they begin contradicting it, traders know to pay closer attention to risk. The chart shows you the boat. Intermarket analysis shows you the current moving beneath it.
Here are the top 31 price drivers for $CRWD.
Our Suggestion
Respect the trend, but don’t confuse strength with safety. CrowdStrike ($CRWD) is displaying extraordinary market leadership. It has gained 108.14% over the past year, 113.47% over six months, and 95.60% year-to-date, outperforming the S&P 500, Nasdaq, Dow and Russell 2000 across every time frame we examined. With CRWD recently closing at $221.90, it is trading just 2.2% below its $226.90 52-week high. The market is clearly telling us where the strength is.
The predictive indicators reinforce that message. The Triple Cross is bullish, with the short, medium and long-term predictive moving averages rising and positively aligned. The Neural Index is green, providing short-term confirmation for the next 48 to 72 hours, while the Daily Range Forecast has been stair-stepping higher with price. Put those signals together and $CRWD currently has the kind of double confirmation we want to see: the broader predictive trend and shorter-term forecast are pointing in the same direction.
But this is where discipline matters. $CRWD has already demonstrated rallies ranging from 29.9% to 111.6%, but it has also suffered declines ranging from 19.8% to 38.6%. Its 52-week trading range spans an enormous $141.22, and our 52-week volatility measurement is approximately 63.6%. Wall Street’s analyst targets are also widely dispersed, reinforcing just how differently reasonable investors can value this business. This is a powerful stock, but it is not a forgiving one.
For traders already long $CRWD, the evidence argues for staying aligned with the bullish trend while protecting accumulated profits. For traders looking to establish a new position, chasing a stock sitting only a few dollars beneath its 52-week high creates a different risk/reward equation. The $226.90 boundary deserves close attention. A sustained move above it would represent another demonstration of strength, while weakness in the predictive indicators, particularly a flattening or bearish shift in the Triple Cross combined with a red Neural Index, would tell us that conditions are changing.
Right now, the weight of that evidence remains bullish: exceptional relative strength, bullish predictive trends, short-term Neural Index confirmation, rising Daily Range Forecast boundaries and supportive intermarket relationships. But after a move of this magnitude, position sizing and risk management become more important, not less. Follow the trend, respect $226.90, watch the patented VantagePoint AI predictive indicators for deterioration, and never let enthusiasm for a great stock become an excuse for ignoring risk.
Use the VantagePoint AI Daily Range Forecast to isolate short term trading opportunities. Practice great money management on all of your trades. Position sizing is critical if you choose to trade $CRWD due to its massive volatility.
It’s not magic.
It’s machine learning.
Disclaimer: THERE IS A HIGH DEGREE OF RISK INVOLVED IN TRADING. IT IS NOT PRUDENT OR ADVISABLE TO MAKE TRADING DECISIONS THAT ARE BEYOND YOUR FINANCIAL MEANS OR INVOLVE TRADING CAPITAL THAT YOU ARE NOT WILLING AND CAPABLE OF LOSING.
VANTAGEPOINT’S MARKETING CAMPAIGNS, OF ANY KIND, DO NOT CONSTITUTE TRADING ADVICE OR AN ENDORSEMENT OR RECOMMENDATION BY VANTAGEPOINT AI OR ANY ASSOCIATED AFFILIATES OF ANY TRADING METHODS, PROGRAMS, SYSTEMS OR ROUTINES. VANTAGEPOINT’S PERSONNEL ARE NOT LICENSED BROKERS OR ADVISORS AND DO NOT OFFER TRADING ADVICE.