


| This week’s stock analysis is CrowdStrike ($CRWD) |
In today’s digital age, where cyber threats are becoming increasingly sophisticated and pervasive, cybersecurity companies like CrowdStrike are playing a critical role in protecting organizations from these ever-evolving dangers. CrowdStrike, a San Francisco-based company founded by George Kurtz and Dmitri Alperovitch in 2011, has made a name for itself as a leader in endpoint security, threat intelligence, and incident response services. The company has 7500 employees.
CrowdStrike’s cloud-native platform and AI-powered technology enable them to provide real-time threat detection and response, a key advantage in the ever-changing cyber battlefield. Their Falcon Endpoint Protection solution is a top revenue generator and a testament to their expertise in protecting organizations from endpoint threats.
Despite facing competition from other cybersecurity giants like Palo Alto Networks, Symantec, McAfee, and Carbon Black, CrowdStrike has consistently demonstrated its ability to innovate and adapt to the ever-evolving threat landscape. Their strong revenue growth and positive Wall Street analyst reviews speak to their resilience and commitment to providing cutting-edge cybersecurity solutions.
However, the cybersecurity industry is not without its challenges. The rapid pace of change and increasing competition pose significant risks to companies like CrowdStrike. Additionally, any data breaches or security incidents involving their customers could have a devastating impact on their reputation and financial performance.
Despite these challenges, CrowdStrike remains a strong contender in the cybersecurity market. Their cloud-native approach, proactive threat-hunting capabilities, and real-time threat detection and response have solidified their position as a leader in the industry.
As we continue to navigate the treacherous waters of the digital world, cybersecurity companies like CrowdStrike play an indispensable role in safeguarding our digital assets and ensuring the security of our organizations.
While $CRWD has had impressive performance it is still not profitable. Wall Street analysts believe the company will become profitable in the next 3 years. This is the challenge confronting traders and investors. $CRWD is a company with improving financial metrics, but it is still not a viable concern. However, earnings are forecasted to grow by roughly 50% per year.
In this weekly stock study, we will look at and analyze the following indicators and metrics as are our guidelines which dictate our behavior in deciding whether to buy, sell, or stand aside on a particular stock.
- Wall Street Analysts’ Estimates
- 52-week high and low boundaries
- Best Case – Worst Case Analysis and Takeaways
- Vantagepoint A.I. Forecast (Predictive Blue Line)
- Neural Network Forecast
- Bollinger Band Analysis
- Intermarket Analysis
- Our trading suggestion
We don’t base our trading decisions on things like earnings or fundamental cash flow valuations. However, we do look at them to better understand the financial landscape that a company is operating under.
Wall Street Analysts’ Estimates
The 39 analysts offering 12-month price forecasts for CrowdStrike Holdings Inc have a median target of 196.03, with a high estimate of 235.00 and a low estimate of 153.00. The median estimate represents a +2.92% increase from the last price of 192.36.
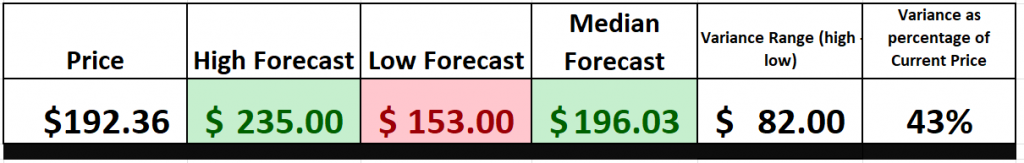
We focus our attention on the variance between the high forecast and the low forecast which is $82 and represents a difference of 43% in price perspective. The larger the variance the larger the volatility that a company will exhibit and the greater the trading opportunity.
52-Week High and Low Boundaries
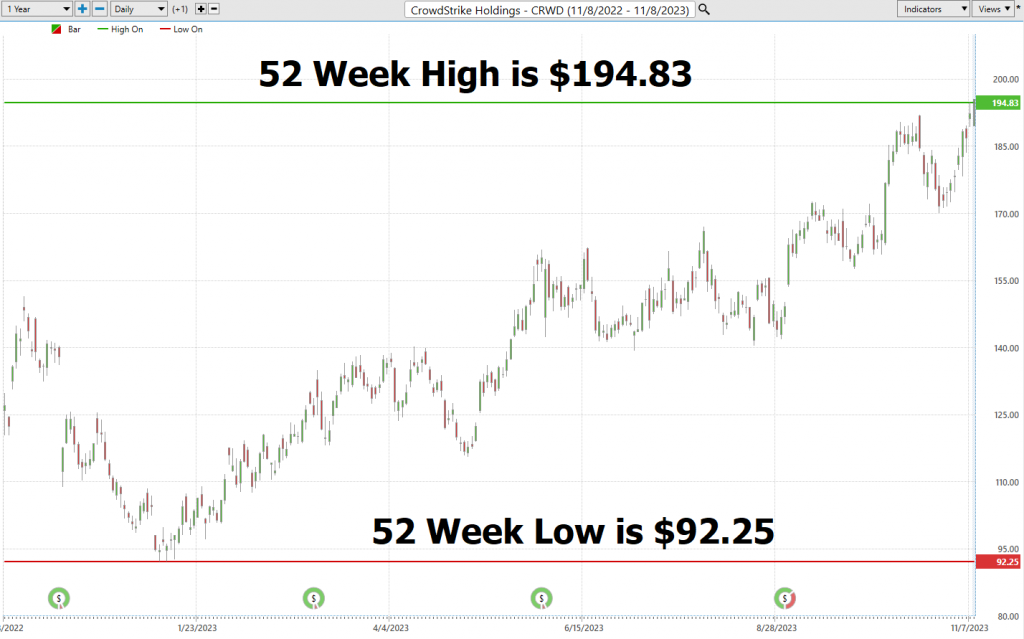
When we’re talking about trading assets, one key metric you must keep an eye on is the 52-week high and low boundaries. These aren’t just numbers; they’re a window into how the market perceives the value of a stock over the past year. Look at $CRWD, for instance. Over the last year, it’s been as high as $194.83 and as low as $92.25, with an annual trading range of $102.58.
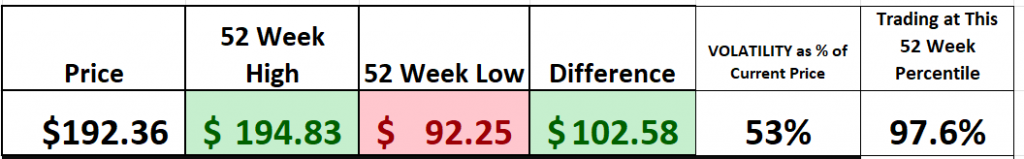
When we divide that annual range into the current price, we get the annualized statistical volatility. Right now, $CRWD annualized statistical volatility stands at a robust 53%. What does that mean? Well, it tells us that it wouldn’t be unusual to see $SWBI swing up or down by about 53% over the next 12 months. That’s some serious market action.
But let’s zoom in on that 52-week range. $SWBI is currently trading at the 97th percentile of its annual trading range. Translation? It’s knocking on the door of its 52-week high once again, like a racehorse giving it all in the final stretch. These boundaries aren’t just numbers; they’re the lifeblood of the market, reflecting investor sentiment.
When a stock flirts with its 52-week high, it’s like a siren song of bullish momentum, a sign that it’s firing on all cylinders. How it performs at this price level is what traders focus on. What type of volume is entering or leaving the market as price reaches its 52-week high? Conversely, when it’s hanging near the 52-week low, it’s a red flag, a warning of bearish sentiment.
Now, don’t forget, folks, these boundaries tell a story—a story of a stock’s journey in the ever-shifting market landscape. And that’s not all; understanding the annualized statistical volatility of a stock is crucial. It’s like a compass guiding you through the turbulent market seas. The higher the annualized statistical volatility, the wilder the ride, with more potential for both ups and downs. But remember, this isn’t the only factor to consider, but it’s a key tool to gauge a stock’s performance, past, and future. So, keep your eyes on those 52-week boundaries and the annualized statistical volatility, and you’ll be navigating the markets like a pro.
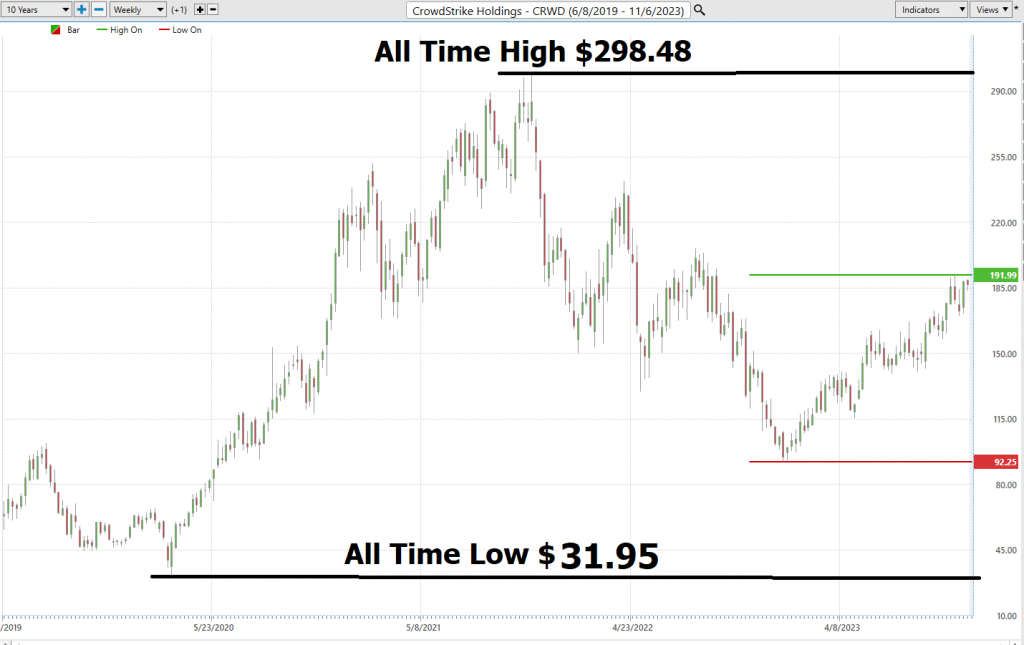
When we zoom out, we also like to look at the long-term chart as well to get a full panoramic view of the journey the stock has been on.
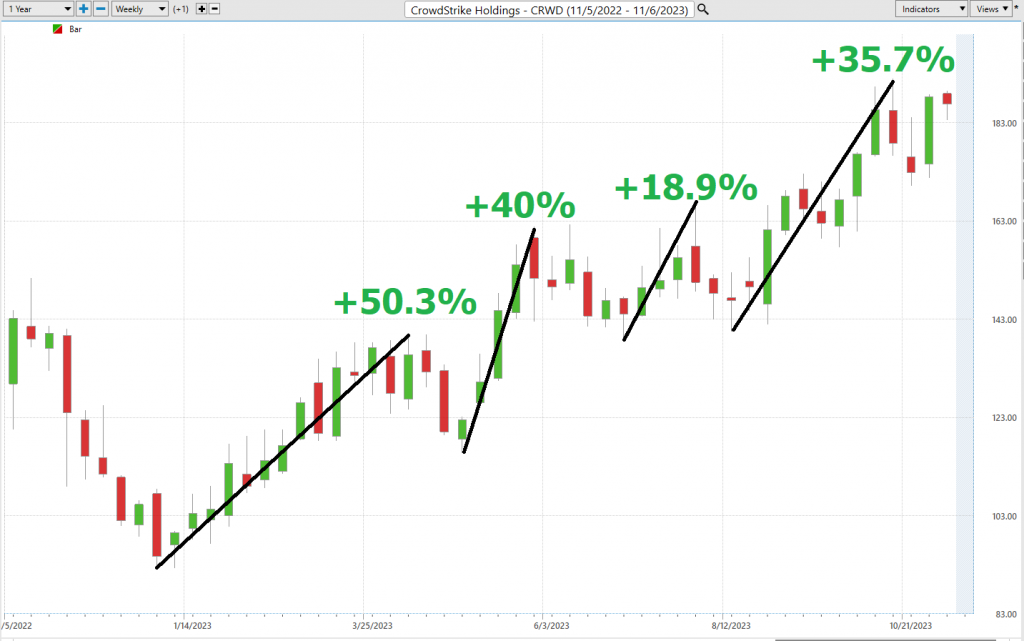
Best Case – Worst Case Scenario
In the high-stakes world of trading, stepping into the market is akin to a General commanding the field. Strategy is paramount, and for the savvy trader or investor, best-case and worst-case scenario planning is not just a tool—it’s an imperative. It is always about balancing optimism with real world implications and weighing risk versus reward. Picture this: two sets of binoculars, each offering a distinct view of the battlefield. This is the essence of thorough market analysis.
Why, you ask, is this approach so critical? It’s simple. By scrutinizing both the brightest days and the darkest storms, you equip yourself with a panoramic perspective of a stock’s potential. This isn’t merely about sunny optimism or the promise of gains; it’s about a clear-eyed assessment of the risks that may loom large on the horizon. This dual-vision strategy is foundational for grasping the volatility of an asset, serving as a compass in the often-unpredictable seas of the stock market.
By evaluating both the potential rewards and the risks, you’re not just speculating; you’re charting a course with intent. It’s about calibrating your exposure, understanding when to stand firm and when to pivot. This is about discerning the true value of a stock, beyond its shimmering facade.
In the grand tapestry of the market, this method transcends mere technique; it’s a philosophy. It’s about balancing the scales of risk and reward, ensuring your portfolio is not just robust for the fleeting moment but is strategically poised for enduring prosperity. The ultimate goal is to be prepared for any outcome. Remember, in the marketplace of trading, knowledge isn’t just power—it’s your navigational chart to wealth.
First, we do the Best-Case analysis:
Followed by the WORST-CASE Analysis:
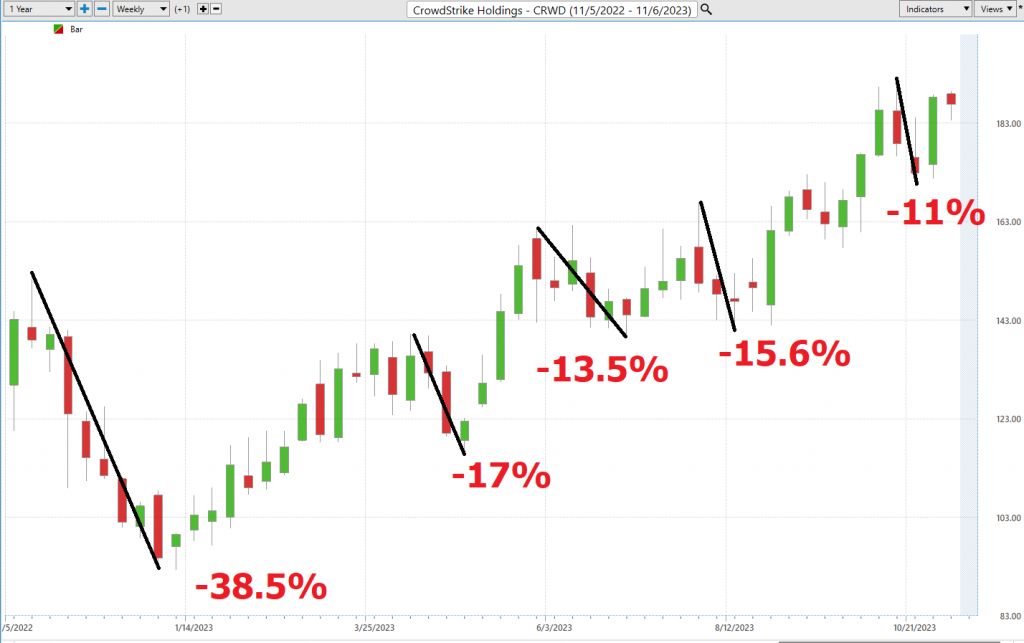
This initial analysis lets us see how quickly $CRWD falls in comparison to its rallies.
Next, we want to compare the performance of $CRWD to the major broad market indexes.
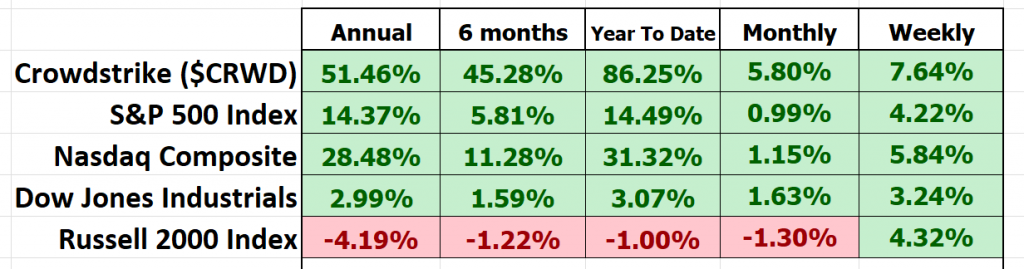
Crowdstrike, ticker symbol $CRWD, has been a standout performer, consistently outshining the broader market indices across all time frames. Its stellar performance warrants a closer look, particularly in terms of volatility and its comparison with market heavyweights. In the world of traders, this is often encapsulated by a metric known as “BETA.”
In the heart of Wall Street, one crucial metric reigns supreme – beta (β). This financial barometer serves as the Richter scale of the stock universe, measuring how sensitive a stock is to the broader market’s movements. Like a seismograph capturing the earth’s tremors, beta quantifies a stock’s susceptibility to the ebbs and flows of the market, typically benchmarked against a major index like the S&P 500.
Here’s the breakdown to understanding Beta’s nuances:
**Beta = 1: A Mirror of the Market’s Mood**
Imagine a stock with a beta of 1 as a faithful reflection of the market’s movements. When the market experiences a 5% surge, this stock mirrors its upward trajectory, rising 5% in tandem. It’s like two dancers moving in perfect harmony.
**Beta > 1: Embracing the Thrill Ride**
Picture a high-speed rollercoaster, exhilarating yet nerve-wracking. A beta exceeding 1, say 1.5, sends the stock on a thrilling ride, 50% more volatile than the market itself. When the market climbs 5%, this high-beta stock takes off on a heart-pounding 7.5% ascent (or descent, for that matter).
**Beta < 1: Stability Amidst the Chaos**
Now, step into a tranquil meadow amidst the bustling stock market. A beta below 1, such as 0.5, instills a sense of calm amidst the volatility. If the market enjoys a 5% ascent, this low-beta stock embarks on a more measured 2.5% rise. It’s like a serene stroll through the park.
Let’s zoom in on $CRWD, Crowdstrike, a company that has captivated the market with its cybersecurity solution. Over a 5-year horizon, $CRWD exhibits a beta of 1.18, implying that it is 18% more volatile than the broader stock market.
Investors turn to beta as a risk assessment tool, guiding them in constructing portfolios aligned with their risk tolerance and investment objectives. $CRWD’s higher beta signals that it belongs in portfolios seeking higher returns but are prepared to withstand greater volatility.
Beta, like any financial metric, is not a magic wand that guarantees success. It’s a tool that helps investors make informed decisions, weighing potential rewards against inherent risks. For those who can stomach the volatility, $CRWD presents an opportunity to ride the highs and reap the rewards of a company with a unique product offering and a strong track record of growth. However, it’s crucial to remember that high beta comes at a price – the potential for significant losses.
The choice lies with the investor – to embrace the thrill of potential gains or seek safer havens. But one thing is certain: beta, the Richter scale of the stock universe, will continue to play a pivotal role in guiding investors’ decisions.
Vantagepoint A.I. Forecast (Predictive Blue Line)
On the following chart you will see the power of the VantagePoint Predictive blue line which determines the medium-term trend price forecast.
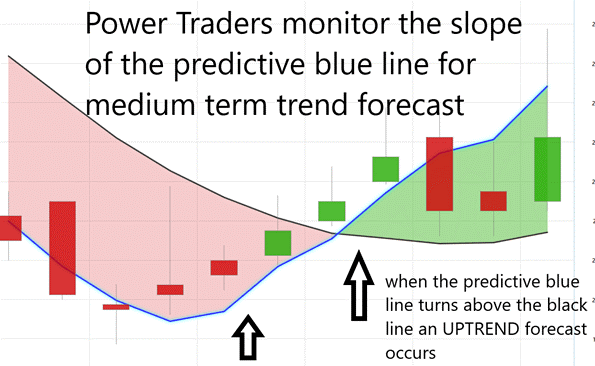
In today’s dynamic and ever-changing market, traders are constantly seeking tools and strategies to help them make informed decisions and navigate the complex landscape. VantagePoint Software, with its pioneering artificial intelligence capabilities, offers a unique perspective, providing a precision guided risk reward analysis into trend forecasts through the monitoring of its predictive blue line.
Imagine the predictive blue line as a beacon, illuminating the path ahead. Its slope determines the trend forecast, indicating the general direction of the market. When the line slopes upwards, it’s a sign that the market is trending upwards, presenting opportunities for buying. Conversely, when the line slopes downwards, it signals a downward trend, indicating potential selling opportunities.
The predictive blue line also identifies the value zone, the sweet spot where astute traders can seize opportunities. In an uptrend, astute traders look to snap up assets at or just below this definitive blue marker. This zone represents the intersection of price and value, where the asset’s true worth is revealed.
The predictive blue line is not a mere guesstimate. It’s the result of VantagePoint’s groundbreaking technology, a symphony of artificial intelligence, neural networks, and intermarket analysis. This powerful combination meticulously analyzes the most influential price drivers of an asset, harnessing the power of A.I. and data correlations to understand its intrinsic value.
While the predictive blue line provides insights into the future, the black line offers a glimpse into the past. It represents the 10-day moving average of prices, essentially our rearview mirror, showing us the market’s recent history. By analyzing the interplay between the black line and the predictive blue line, traders can gain valuable insights into the market’s momentum and identify potential opportunities.
Here’s a golden nugget for all you traders out there: when that predictive blue line ascends above the black line, it’s like the market’s way of waving a green flag, signaling an UP-entry opportunity. This moment represents the convergence of price and value, indicating that the asset is undervalued and poised for upward movement.
As you navigate the complex market landscape, remember that the predictive blue line is your guide. By closely monitoring its movements and understanding its relationship with the black line, you can make informed decisions and position yourself for success. Stay informed, stay ahead of the curve, and let VantagePoint Software be your trusted partner in the world of trading.
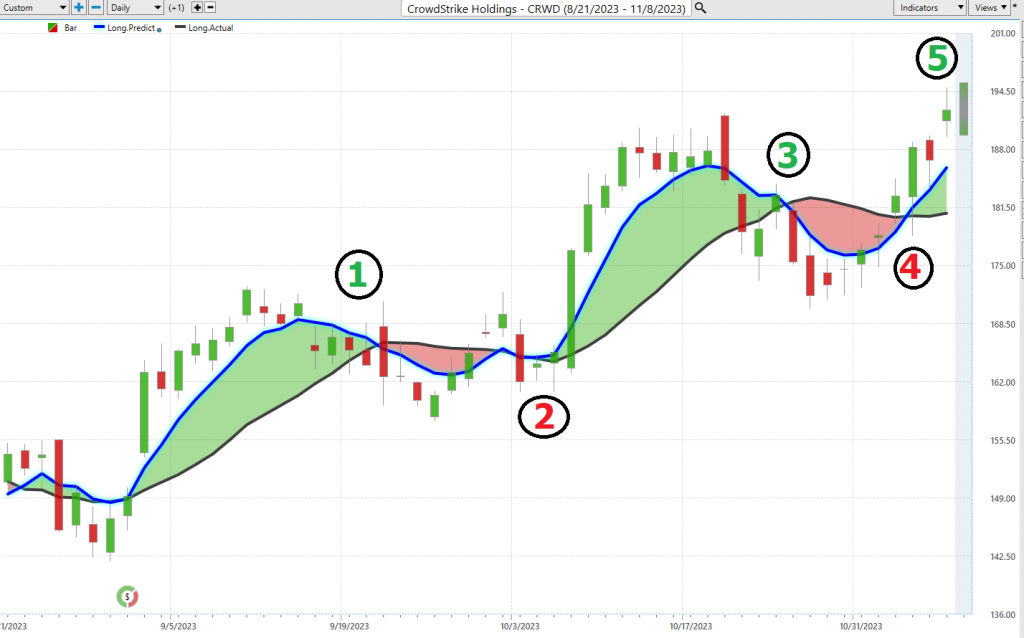
Over the last 3 months there have been 5 trend forecasts.
3 have been winners.
2 have been small losers.
Had a trader taken each and every forecast here is what the results would look like:
Trade #1 5.80%
Trade #2 -1.67%
Trade #3 10.50%
Trade #4 -3.60%
Trade #5 5.30%
Net 16.33%
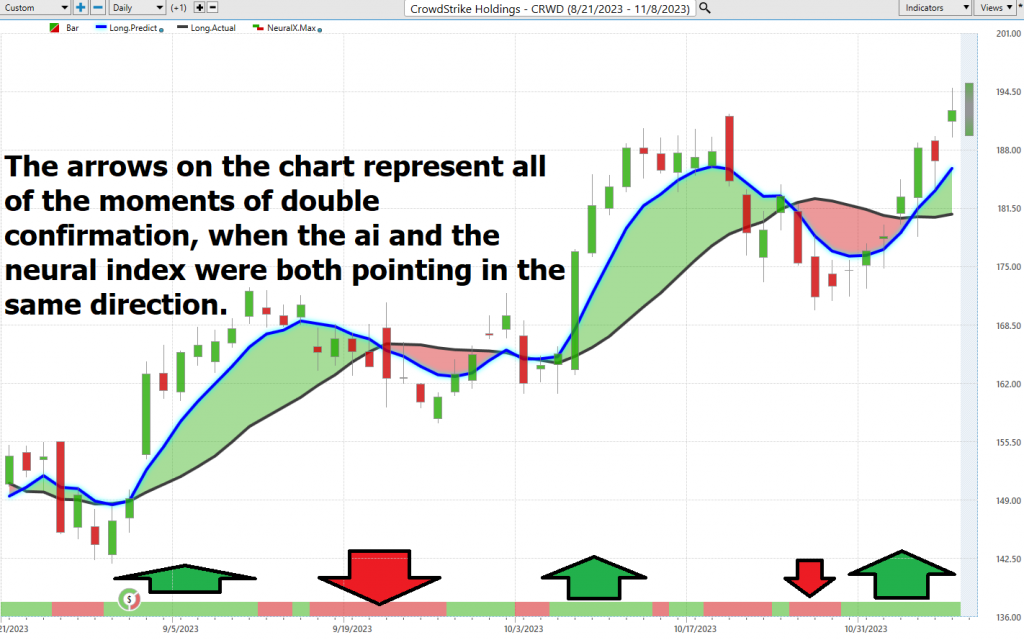
Neural Network Indicator (Machine Learning)
At the bottom of the chart is the Neural Network Indicator which predicts future short-term strength and/or weakness in the market. When the Neural Net Indicator is green it communicates strength. When the Neural Net is Red it is forecasting short term weakness in the market. When it is yellow it is anticipating sideways prices.
But what’s the secret sauce behind this Neural Net Indicator, you ask? Well, it’s all about neural networks – computational learning systems that operate like digital brains. These networks use a web of functions to crunch massive amounts of data and churn out the output we traders crave. They’re like the sharpest minds in the trading toolkit, always improving and adapting.
This Neural Network, supercharged with innovative A.I., is the Sherlock Holmes of trading. It sifts through mountains of data, serving up precise predictions. It’s a relentless explorer, delving into every nook and cranny of the market, from technical intricacies to global events. And it does all of this at lightning speed, connecting the dots between seemingly unrelated market factors – like the way it links oil price swings to unexpected stock index movements.
Now, here’s the golden rule for trading success: confirmation is king. The savvy Power Traders out there cross-reference the predictive blue line with our trusty Neural Network Indicator. This allows Power Traders to focus on much shorter, high probability trades. When both indicators point in the same direction, it’s a crystal-clear market signal. But when they both sing a tune of caution, it’s wise to take a step back and reevaluate your strategy.
Here is the same Chart of $CRWD but now it has the Neural Index at the bottom of the chart.
In essence, Neural Networks are the compass guiding us into the future of trading, unveiling insights that traditional methods can only dream of. For Power Traders, the magical combo of the Neural Network and A.I. forecasts is pure gold. When they align, it’s a green light for action. But if they diverge, proceed with caution. Remember, in trading, double-checking is the cornerstone of success.
So, we strongly urge our Power Traders to harness the full potential of this tool. Cross-reference the chart with the predictive blue line and Neural Network Indicator to pinpoint those sweet entry and exit points. For serious traders, neural networks are the next-gen wizardry that uncovers subtle patterns and interdependencies hidden from traditional methods.
Traders, pay close attention to the Neural Net for your LONG or SHORT positions. In simple terms, when the A.I. forecast is green, and the Neural Net is green, it’s a buying bonanza. Power Traders are always on the lookout for opportunities where both the Neural Network and A.I. converge, paving the way for statistically sound trading strategies.
In conclusion, embrace the power of the Neural Network Indicator and ride the wave of AI-driven insights. It’s a new era for trading, and together, we’re navigating these uncharted waters to find the treasures of the market.
Power Traders are always looking to apply both the Neural Network and A.I. to the markets to find statistically sound trading opportunities.
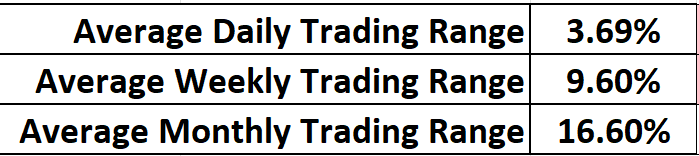
Daily Range Forecast & Analysis
For the discerning elite of the trading world, those who have placed their faith in the remarkable VantagePoint Software, there exists a singular tool they consult with unwavering regularity – the VantagePoint Daily Price Range forecast. It’s become nothing short of their financial North Star, a beacon guiding them through the often-turbulent waters of market maneuvers.
Let’s now immerse ourselves in the world of trading range metrics for $CRWD over the past year, exploring the daily, weekly, and monthly intervals.
Every trader faces the daily conundrum – and trust me, it’s a profound one – of pinpointing those precise moments to make their move in the market. Yet, armed with the formidable capabilities of VantagePoint’s A.I. and the Daily Price Range Forecast, it’s akin to having a market sage discreetly whispering invaluable counsel in their ears.
Now, introduce the VantagePoint A.I.’s daily range forecast into this equation. Imagine having a subtle nudge, a gentle prod, that foretells the market’s next step. By seizing opportunities at the lower end of the forecast and crafting exit strategies at their peak, traders can potentially tip the odds in their favor while maintaining a firm grip on risk management.
However, there’s a critical point we must ponder here: the daily valuation of the stock market isn’t solely the result of corporate maneuvers or financial disclosures. A diverse range of factors, from a fleeting tweet to global upheavals, can sway the balance. Thus, predicting market movements is a sophisticated art. Yet, VantagePoint A.I. seems to have carved out a unique niche, harmoniously blending A.I., neural ingenuity, and machine learning in the relentless pursuit of that elusive perfect prediction.
The crux of successful trading lies in identifying that impeccable timing for market entry and exit. VantagePoint doesn’t merely assist in locating that pivotal moment; it accomplishes it with astounding precision. The Daily Range forecast undergoes daily updates, providing a window into potential price trajectories. It’s akin to having a seasoned market guru sharing time-tested insights.
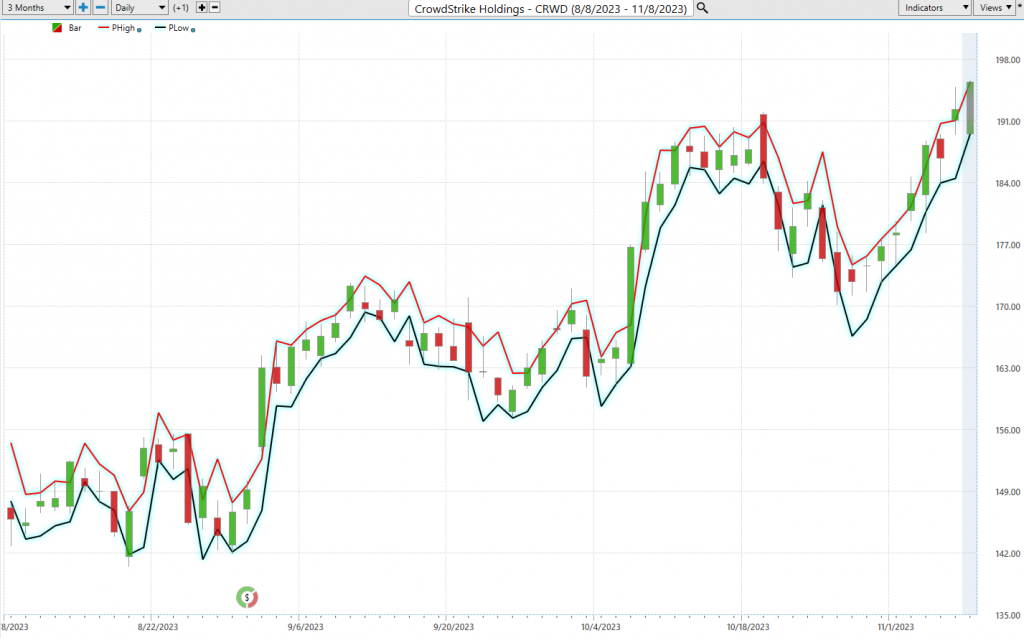
Now, let your gaze rest upon that chart. It’s more than just aesthetically pleasing curves; it’s a roadmap for strategic stop placements and risk management. Observe how rarely prices dip below that prominent dark line. It’s a clear indication, pointing to the optimal zone for buy stop placements, ensuring that risks remain finely calibrated.
While $CRWD offers a plethora of opportunities, it’s imperative for traders to understand how to harness its volatility, for in the world of trading, knowledge is power.
Intermarket Analysis
In the world of trading and investing, there’s a common misconception that financial success is solely determined by headline-grabbing news and market trends. While these factors undoubtedly play a role, the true key to navigating the market lies in understanding the underlying connections between different asset classes – a concept known as intermarket analysis.
Imagine the financial world as a vast tapestry, intricately woven with threads representing various asset classes – stocks, oil, currencies, and more. Intermarket analysis is like wielding a magnifying glass, allowing you to zoom in and examine the intricate patterns and relationships that shape this tapestry, revealing the driving forces behind price movements.
Just as a skilled detective meticulously examines clues to solve a crime, intermarket analysis practitioners delve into the interconnectedness of asset classes, seeking patterns and correlations that foreshadow future market movements. By understanding how these interlinkages work, investors can make informed decisions that align with the broader market trends.
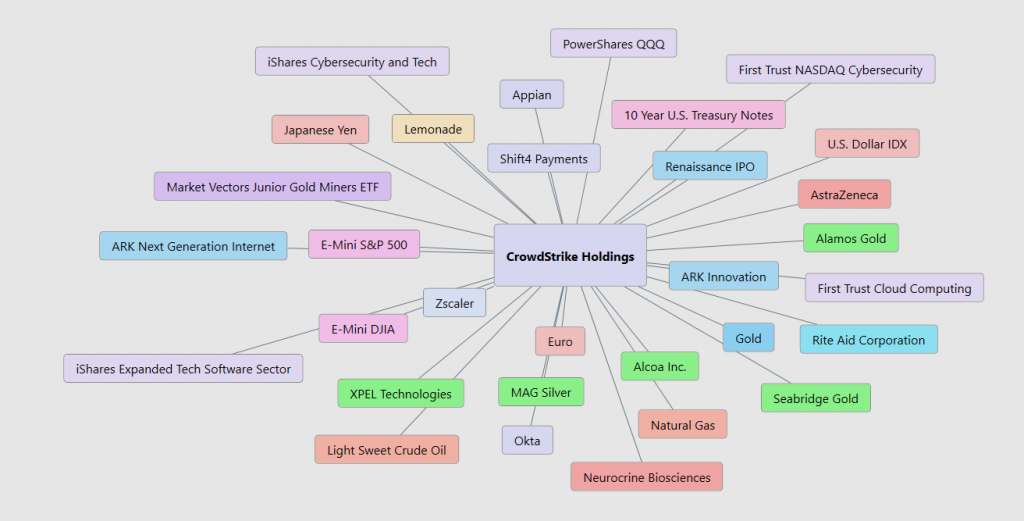
Think of it as a domino effect: when one asset class experiences a significant shift, it can reverberate through the interconnected network, affecting other asset classes in predictable ways. Intermarket analysis equips investors with the ability to anticipate these domino effects, enabling them to position their portfolios for potential gains or minimize potential losses.
In the bustling financial realm, intermarket analysis stands as a beacon of wisdom, guiding investors beyond the superficial headlines and into the deeper currents of the market. It’s the financial equivalent of having a secret weapon, empowering you to make informed decisions that align with the underlying forces shaping the markets.
So, embrace the detective within you, sharpen your analytical skills, and delve into the world of intermarket analysis. With this newfound knowledge, you’ll unlock the secrets to navigating the financial labyrinth with confidence and precision, transforming yourself into a master of the market.
Our Suggestion
Traders, take note: $CRWD deserves a prime spot on your trading radar for the upcoming year. As I always say, when you focus on what is winning you place the odds overwhelmingly in your favor, particularly if you have a long-term outlook and practice good money management.
Ladies and gentlemen, in the fast-paced world of trading, let me tell you, market selection is the linchpin of success. It’s what separates the wheat from the chaff in this dynamic arena. The real secret to making a consistent profit boil down to one thing: picking the right markets.
Think of it like a skilled craftsman, carefully handpicking the finest materials to craft a masterpiece. Successful traders, much like craftsmen, meticulously choose markets that align with their trading style, risk tolerance, and investment goals. They set their sights on markets that show steady trends, predictable patterns, and plenty of liquidity. And let me tell you, it’s a game-changer.
But why is market selection such a big deal? Well, it’s all about managing that wild beast called volatility – the double-edged sword of trading. Volatility can swing both ways, bringing in handsome profits one moment and leaving you with a financial hangover the next. Novice traders often get caught in their jaws and end up disillusioned. But the pros, they pick markets that match their risk tolerance and style, and they turn volatility from a source of fear into a catalyst for growth.
In a nutshell, market selection is the fine art of aligning yourself with the right market conditions, creating an environment where profits flow consistently. When traders understand the unique nuances of different markets and choose the ones that play to their strengths, they embark on a path to financial triumph. They ride the waves of volatility with confidence and navigate the ever-shifting market landscape like seasoned pros. That’s the key to trading success, my friends.
Crowdstrike ($CRWD) will offer numerous trading opportunities over the coming year. It is a major player in the cybersecurity space, and it is slowly becoming a viable financial concern. Despite the challenges outlined in this stock study, CrowdStrike stands tall as a cybersecurity leader, poised to capitalize on the growing demand for its services. The company’s commitment to innovation, coupled with its cloud-native approach and proactive threat hunting capabilities, positions it well for continued success in the ever-changing cybersecurity landscape.
Our recommendation is to follow the A.I. trend analysis as outlined in this stock study and practice good money management on all trades.
We will re-evaluate daily based upon:
- New Wall Street Analysts’ Estimates
- New 52-week high and low boundaries
- Vantagepoint A.I. Forecast (Predictive Blue Line)
- Neural Network Forecast
- Daily Range Forecast
The trend in $CRWD is UP. We will look to the bottom of the daily range forecast to position ourselves LONG with tight stops for short-term trades.
Let’s Be Careful Out There!
It’s Not Magic.
It’s Machine Learning.
Disclaimer: THERE IS A HIGH DEGREE OF RISK INVOLVED IN TRADING. IT IS NOT PRUDENT OR ADVISABLE TO MAKE TRADING DECISIONS THAT ARE BEYOND YOUR FINANCIAL MEANS OR INVOLVE TRADING CAPITAL THAT YOU ARE NOT WILLING AND CAPABLE OF LOSING.
VANTAGEPOINT’S MARKETING CAMPAIGNS, OF ANY KIND, DO NOT CONSTITUTE TRADING ADVICE OR AN ENDORSEMENT OR RECOMMENDATION BY VANTAGEPOINT AI OR ANY ASSOCIATED AFFILIATES OF ANY TRADING METHODS, PROGRAMS, SYSTEMS OR ROUTINES. VANTAGEPOINT’S PERSONNEL ARE NOT LICENSED BROKERS OR ADVISORS AND DO NOT OFFER TRADING ADVICE.


