| This week’s a.i. Stock Spotlight is CARVANA ($CVNA) |
The purpose of this stock study is to drive home a couple of key trading points on trading $CVNA. One of our most important trading principles is to closely monitor two broad metrics. The first is, “what is winning.” By that we simply mean, where is the money being made? The second principle is that we monitor stocks and assets very closely in relation to their 52-week ranges. This primary principle is to learn to put stocks on your trading radar and watch them, monitor them, and pay attention to both their news announcements and to the a.i. forecasts always balancing the risk versus the reward.
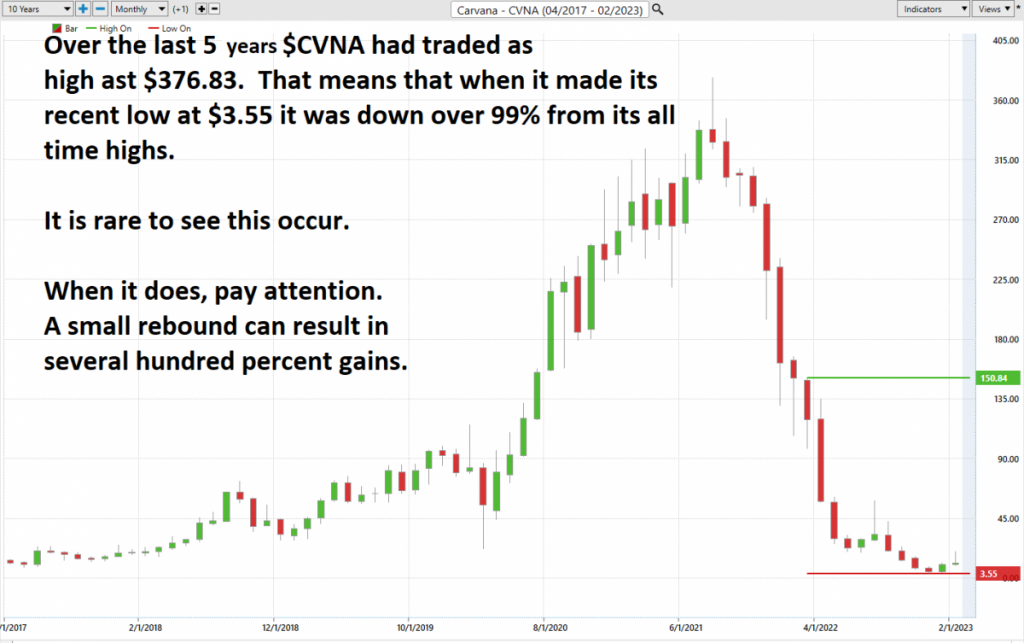
Over the past year and half, we have reported on $CNVA several times. The first analysis on $CVNA was on February 23, 2023. It can be summarized by the following chart which explained why we were putting $CVNA on our radar. You can read the entire $CVNA stock analysis here.
We followed up on that a.i. stock spotlight on July 12, 2023. In that analysis we stated the following:
“Carvana has never been profitable and is bleeding money hand over first. It is releasing its next earnings on February 23, 2023. They are expected to post losses of -$2.30 per share. If the number is smaller than that it will be considered an earnings surprise, and the rally will continue. If not, expect the volatility that $CVNA has experienced over the past year to continue.
Keep in mind that $CVNA has $6 billion in debt on its balance sheet and only $318 million in cash. A few more bad quarters and it will run out of money and will either file for bankruptcy or will be purchased by one of its rivals.
This is why it deserves to be on your trading radar.
We have learned from years and years of observation that when a stock loses almost all its value in a 52-week time frame it is time to put on the discriminating trader hat. These types of meltdowns can and often reverse very quickly.
This type of speculation requires patience for the setup to develop and to be effective it should only be pursued in a very tiny segment of a portfolio. But when guided by the A.I. forecast the opportunity could be very lucrative.”
“The stock’s volatility is off the charts, making it one of the most tumultuous assets we’ve ever analyzed. We chose to scrutinize it primarily because it’s an asset that has shed 98% of its value in less than two years and we correctly anticipated a healthy bounce with the assistance of the ai forecasts in the Vantagepoint Software.
We’ll be closely following the Triple Cross for guidance. Brace for significant volatility post-earnings. For seasoned traders, this could be an excellent opportunity. However, newcomers should proceed with caution.”
You can read the entire $CVNA stock analysis here.
Today, I’ll provide an update from our most recent analysis on $CVNA which was done on 3/28/2024.
Over the past two weeks, Carvana (NYSE: CVNA) saw its stock soar by over 65%, marking yet another impressive surge for the online used car marketplace. Investors were abuzz as Carvana reported robust earnings for the first quarter of 2024, showcasing a return to growth and profitability after enduring challenging years. Year-to-date, Carvana’s stock has skyrocketed by a staggering 134%, significantly outpacing the broader S&P 500 index. Over the past 52 weeks $CVNA is up 865%.
After facing headwinds in 2022 and 2023 due to a retreat in online used car shopping amidst the pandemic, Carvana managed to stabilize its unit volumes late last year. The first quarter of 2024 witnessed a meaningful uptick in volumes, with retail units sold reaching 92,000, marking a notable 16% year-over-year increase and a sequential rise of 21%. Although still below its Q1 2021 levels, this uptick signaled a promising trajectory for Carvana.
Surprise Profitability: In a surprising turn of events, Carvana reported a profit of $48 million in Q1, a stark contrast to the $288 million net loss recorded in the same period last year. This blend of growth and profitability likely delighted investors, especially considering Carvana’s high short interest, estimated at 33% of its freely tradable shares. The positive earnings report may have triggered short sellers to scramble for shares, potentially fueling a short squeeze and propelling Carvana’s stock even higher.
Carvana Co. reported its revenue and earnings for each quarter of 2023 as follows:
1. **First Quarter**: Revenue of $2.4 billion with a net income of $22 million.
2. **Second Quarter**: Revenue of $2.9 billion with a net income of $52 million.
3. **Third Quarter**: Revenue of $2.5 billion with a net income of -$15 million.
4. **Fourth Quarter**: Revenue of $2.97 billion with a net income of -$162 million.
Cumulatively, for the entire year of 2023, Carvana’s revenue totaled approximately $10.77 billion, representing a decrease of about 20.82% compared to the previous year. The annual net income was -$103 million, reflecting challenges despite the quarterly revenues.
Now, sure, it’s been on a rocket ride since 2023, with shares skyrocketing over 2,000% in just a year and a half. But hold onto your hats because there’s more to this story than meets the eye. We’re talking about a company with a market cap of $25 billion and a debt load that would make your head spin at $5.5 billion. And while they may have pulled in $134 million in operating income in the first quarter of 2024, that barely puts a dent in their whopping $173 million interest expense. That’s not a good look. Plus, let’s not forget their historical struggle with free cash flow. With all that in mind, it’s hard to ignore the glaring overvaluation staring us right in the face. This isn’t a ride for the faint-hearted, folks.
Now, let’s rewind a bit. When Carvana first hit the scene, critics were quick to dismiss it as just another tech bubble waiting to burst. And with a short ratio hitting a whopping 88% back in 2023, it’s no wonder folks were skeptical. But lo and behold, Carvana didn’t just survive, it thrived. It carved out a niche in the used car market like nobody’s business, offering consumers something they didn’t even know they wanted: a hassle-free, online car-buying experience.
In an industry plagued by shady dealings and hidden fees, Carvana stood out like a beacon of transparency. With their one-click buying process and a seven-day free-return policy, they tapped into the frustrations of car buyers everywhere. And let’s not forget their savvy business model. By cutting out the intermediary and going straight to the source for inventory, they managed to outshine the competition in both margins and profits. It’s the kind of stuff that keeps investors up at night, folks.
But wait, there’s more. Carvana didn’t stop at just selling cars. They saw an opportunity in financing, and they seized it with both hands. Through some slick negotiating and savvy management, they managed to navigate the choppy waters of 2023 and come out on top. And now, they’re eyeing an even bigger prize: the lucrative world of online car marketplaces. With their acquisition of ADESA’s U.S. auction business, they’ve positioned themselves as a major player in the game. It’s a bold move, folks, but one that could pay off big time in the long run.
In contrast to its retail business, the marketplace segment promises higher profit margins, aligning with the industry trend exemplified by Copart, which commands a valuation nearly three times higher than Carvana despite selling fewer units. With marketplace revenue surging by 74% and gross profits skyrocketing by 290% in 2023, Carvana’s foray into this domain potentially heralds a transformative shift in its profit dynamics.
In essence, Carvana’s revival may just be on the cusp of a momentous breakthrough, fueled by its relentless innovation and strategic foresight.
One of the huge challenges on Wall Street is learning to read the fine print of earnings reports which are buried within income statements and financial reports. Currently there is a blissful craze surrounding $CVNA because it has positioned its news around a successful turnaround that beat the odds. Everybody wants to root for the underdog. But $CVNA has some serious financial burdens it is carrying.
Here are three pivotal considerations for prospective investors/traders eyeing this used car retailer –
Delving into Carvana’s Q4 2023 earnings report uncovers a telling disclaimer:
Net income for FY 2023 totaled $150 million and benefited by $878 million gain on debt extinguishment as a result of our corporate debt exchange.
There’s a lot to unpack in that little explainer.
Let’s dive deep into the numbers, folks, because there’s more to Carvana’s story than meets the eye. Sure, their financial statements might paint a rosy picture, but when you start peeling back the layers, you’ll find a tale of financial juggling and ongoing struggles.
First off, let’s talk about debt. Now, Carvana might have looked like it was turning a profit in 2023, but a big chunk of that was thanks to an $878 million gain. That’s like slapping a Band-Aid on a gaping wound, folks. See, Carvana was drowning in debt, staring down the barrel of bankruptcy. But instead of going under, they managed to renegotiate their debt terms, buying themselves some time. But make no mistake, their debt-to-equity ratio is still through the roof, sitting at over 25 times. That’s not a number you want to see if you’re thinking about investing.
Now, let’s talk about interest expenses. You’d think that with all that debt restructuring, Carvana would have managed to lighten the load a bit, right? Wrong. In the first quarter of 2024, their interest expenses went up, hitting $173 million compared to $159 million the year before. And when you factor in that their operating income barely covers those interest payments, well, you’ve got yourself a recipe for financial trouble.
And finally, let’s talk about profitability. Sure, Carvana might have managed to eke out a profit in the first quarter of 2024, but don’t let that fool you. A big chunk of that profit came from a $75 million gain. Take that away, and suddenly their profitability doesn’t look so hot. In fact, in the fourth quarter of 2023, they were still posting losses to the tune of $1 per share. So, yeah, folks, there’s some cause for concern when it comes to Carvana’s bottom line.
Investment Implications: Carvana’s ostensibly straightforward business model belies its intricate financial landscape. While gross profit metrics garner attention, sustained profitability remains elusive. For risk-averse investors, Carvana’s convoluted financials and lingering debt woes may warrant caution. Monitoring leverage, interest costs, and core profitability is imperative for those venturing into Carvana stock.
While Carvana’s turnaround might just be beginning traders and investors should chew on these details moving forward and trust the ai for future guidance.
Some concerning details which are emerging as this ai stock spotlight on Carvana is published is that numerous insiders have been selling some of their shares based upon its current valuation. When insiders start selling after a massive rally – pay attention.
You can read the details below by clicking on any of these graphics:

Wall Street must digest and confront all of these details. Earnings moving forward will determine whether the $CVNA turnaround story is for real or just a publicity ploy. The takeaway moving forward is that I suspect that $CVNA will present numerous swing trading opportunities over the coming months as volatility will increase moving forward.
As you digest this information my suggestion is to trust the guidance and trend analysis offered by VantagePoint’s artificial intelligence. It has been remarkable at defining these trends. As we have outlined in all of our stock studies, position sizing is key as there is tremendous risk in $CVNA at the present time. For the informed trader RISK spells opportunity. For the inexperienced trader, RISK is a threat to their survival.
In this weekly stock study, we will look at and analyze the following indicators and metrics as are our guidelines which dictate our behavior on a particular stock.
- Wall Street Analysts’ Estimates
- 52-week high and low boundaries
- Best Case – Worst Case Analysis
- Vantagepoint A.I. Triple Cross Forecast
- Neural Network Forecast
- Daily Range Forecast
- Intermarket Analysis
- Our trading suggestion
We don’t base our decisions on things like earnings or fundamental cash flow valuations. However, we do look at them to better understand the financial landscape that a company is operating under.
Analysts Ratings
Wall Street analysts are traditionally slow to update their forecasts. However, based upon the massive trend that $CVNA has had they are quickly and gradually upgrading their forecasts.
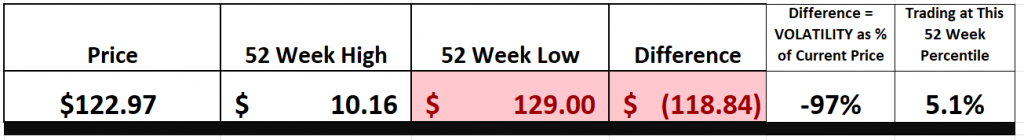
Based on 17 Wall Street analysts offering 12-month price targets for Carvana Co in the last 3 months. The average price target is $9433 with a high forecast of $135.00 and a low forecast of $45.00. The average price target represents a -23.29% change from the last price of $122.97.
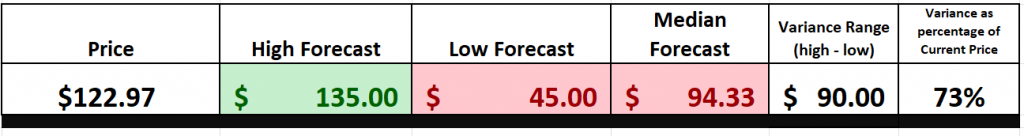
Make sure you also look at the variances between the most bullish and most bearish forecast. This variance is $90 or 73% of the current price. It is important to pay attention to this value as it often is a predictive precursor of anticipated volatility.
This giant variance in price estimates from Wall Street Analysts who watch the stock 24/7 show you how much volatility and uncertainty is baked into $CVNA at the present time.
While I always like to believe in an underdog story of a company that navigates a successful turnaround, you can see that among the analysts who monitor the stock 24/7, they share a great degree of skepticism.
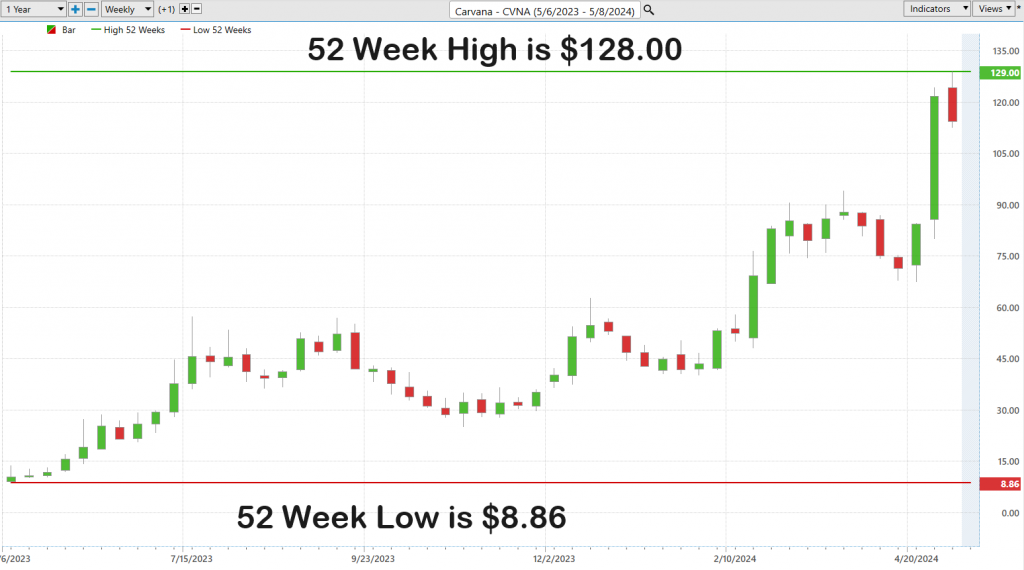
52-Week High-Low Boundaries
We always advise traders and investors to be aware of the 52-week trading range of any stock they are looking to get involved in. The reason is that the 52-week boundaries can often tell a very important story.
In the world of trading, savvy investors keep a close eye on stocks that are trending upward, and one key indicator they rely on is the 52-week high. When a stock hits a new high within that timeframe, it signals resilience and strength in the face of challenges.
Understanding the boundaries of a stock’s 52-week range is essential for traders, as it offers valuable insights into its historical performance. These highs and lows serve as psychological markers, indicating levels of support and resistance among investors. While conventional wisdom advises buying low and selling high, there’s often greater profit potential in identifying stocks on a strong upward trajectory and adopting a “buy high, sell higher” approach. This strategy takes advantage of the momentum generated by stocks consistently surpassing their 52-week highs, reflecting robust investor confidence and the likelihood of further gains.
The 52-week metric is a staple in financial analysis, providing a snapshot of a stock’s performance over a stable annual period. It offers a comprehensive view of a stock’s volatility and trend strength across various market conditions, enriching traders’ decision-making processes by leveraging these psychological benchmarks.
Turning our attention to $CVNA, a closer look at its long-term charts reveals its remarkable volatility and recent resurgence. Despite testing 52-week lows multiple times, the stock demonstrated resilience, consolidating its position, and ultimately surging significantly higher. This pattern underscores the importance of patience and strategic positioning in capitalizing on market opportunities.
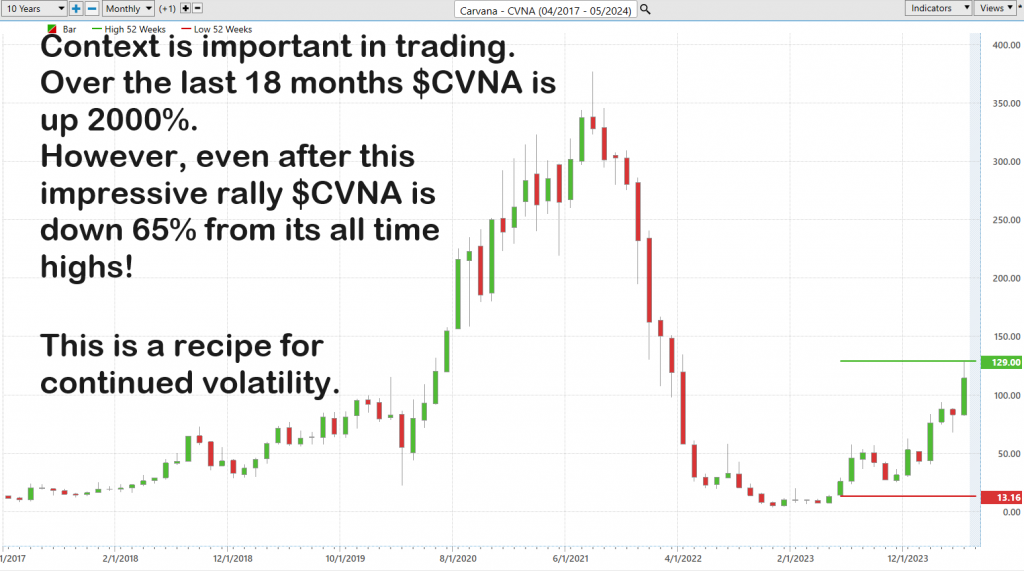
For further context we like to zoom out further and look at the 10-year chart. Upon doing so, you can see that $CVNA, even after its impressive rally is still down 65% from its all time high posted in August 2021.
Best Case/Worst Case Analysis
Striking the right balance between risk and reward is paramount for every investor. While various methods exist to navigate this delicate equilibrium, one approach that consistently yields insightful results is the best-case/worst-case analysis. Rooted in pragmatism and forward-looking perspective, this technique entails a practical examination of contrasting optimistic and pessimistic scenarios, all through the lens of historical chart analysis spanning the preceding year.
Executing this strategy demands a keen eye for chart analysis, adeptly discerning the correlations between rally peaks and economic downturn troughs. By juxtaposing periods of expansion with moments of contraction, traders gain a nuanced understanding of risk versus reward. It’s a straightforward yet practical approach, offering traders a clear insight into market outcomes over the past year.
Examining the magnitude of upward surges in relation to downward spirals on a chart provides invaluable insights into inherent risks and potential rewards. This comparison serves as a barometer of market volatility, decoding underlying currents and providing a clear-eyed view of the terrain ahead.
Far from being an academic exercise, this methodology serves as a practical blueprint for navigating financial markets. By comprehensively assessing both successes and setbacks, traders gain a holistic understanding of a stock’s potential outcomes. It’s not just about chasing profits; it’s about preparing for the full spectrum of possibilities.
Through this analysis, investors arm themselves against market fluctuations, crafting strategies that anticipate volatility with foresight and precision. And the charts we examine aren’t merely illustrative; they’re indispensable guides, leading the way through the complexities of market dynamics with clarity and insight.
Here is the best-case analysis:
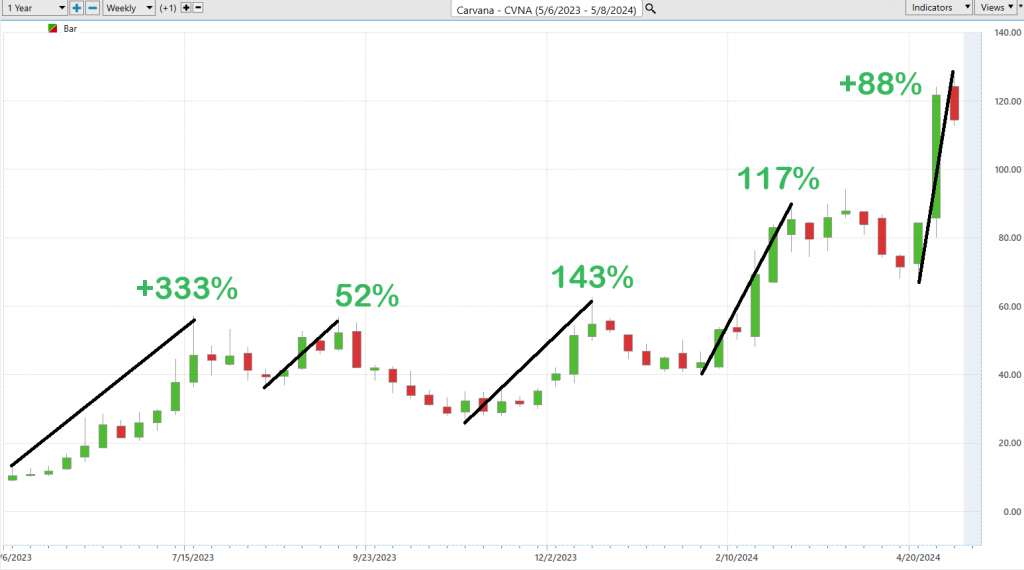
Followed by the worst-case analysis:
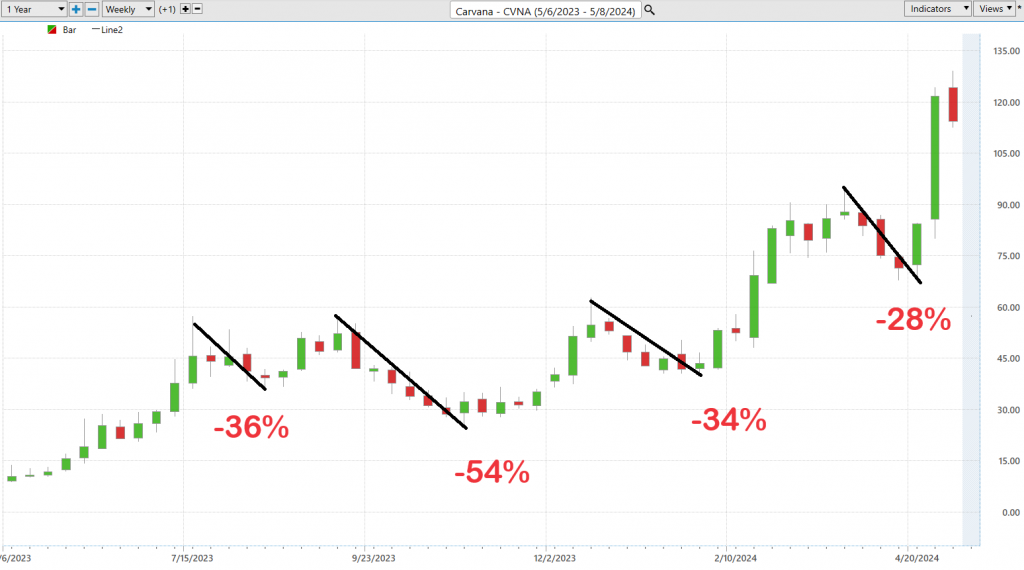
Clearly the bulls are in control. But what is also noteworthy for aggressive swing traders to note is the levels of these declines and noting to pay attention to the ai UP forecasts after declines have occurred.
Next, we compare $CVNA to all of the broader stock market indexes:
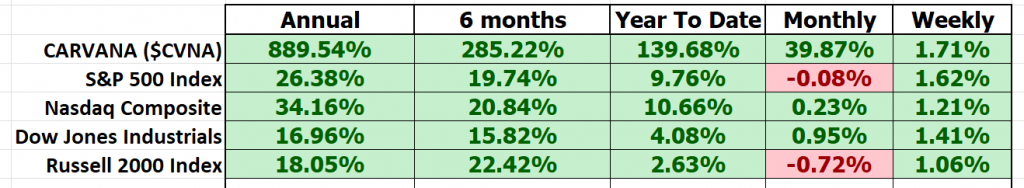
When discussing the performance of $CVNA, to say it has excelled would be an understatement of monumental proportions. It’s crucial to contextualize this comparative analysis, which began when $CVNA was at the precipice of its 52-week lows, a factor that may accentuate the metrics at play.
In our assessment, a critical aspect to consider is Carvana’s ($CVNA) volatility relative to the broader market, a dynamic effectively captured through the lens of Beta. Beta serves as a pivotal gauge, quantifying a stock’s volatility in comparison to the broader market. A Beta value of 1 denotes alignment with market movements. Conversely, a Beta exceeding 1 signifies heightened volatility, while a figure below 1 indicates relatively subdued volatility compared to the market average.
With a Beta of 3.28 over the past five years, Carvana ($CVNA) exhibits a volatility rate 238% higher than the broader market. This substantial Beta underscores Carvana’s status as a stock that not only has vastly outpaced market performance but also carries a heightened level of volatility and associated risk. For investors and analysts alike, recognizing this distinction is imperative, providing valuable insight into the risk-return profile inherent to $CVNA within the context of diversified investment strategies.
VantagePoint A.I. Predictive Blue Line Analysis
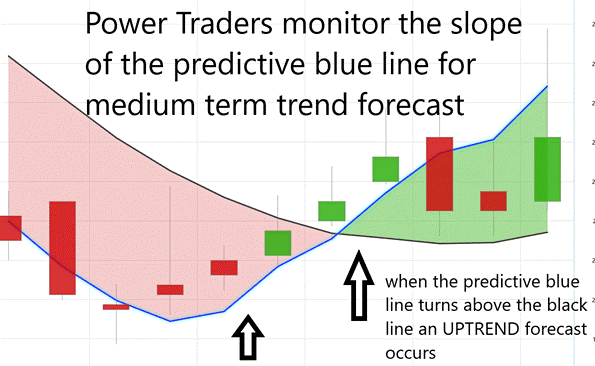
The significance of a predictive blue line as a leading indicator cannot be overstated. It serves as a cornerstone for traders, signaling opportune moments to engage in purchases at or below its value during upward market trajectories. This strategy underscores the importance of marrying historical market data, represented by the traditional black line, with forward-looking insights offered by the blue line. Such a nuanced comprehension is essential for traders committed to making well-informed decisions.
At the core of this pioneering forecasting lies VantagePoint’s proprietary technology, which integrates Neural Network capabilities with Intermarket Analysis to provide a cutting-edge perspective on an asset’s future trajectory. This technology delves into the most influential price drivers of the asset, employing a sophisticated blend of artificial intelligence and statistical methodologies to predict market movements. Instances where the predictive blue line crosses above the historical black line signify potential entry points for traders, often coinciding with upward trends (indicated by UP arrows) on the chart. Conversely, a descent of the blue line below the black line signals impending downward market trends, suggesting optimal moments for market exit or short positions.
This informed analysis and approach equips traders with a holistic understanding of both prevailing market trends and valuation zones. A retrospective analysis spanning three months of $CVNA stock, utilizing this A.I.-enhanced framework, underscores the significant role artificial intelligence plays in enhancing real-time trading decisions. Therefore, for investors seeking to blend traditional market wisdom with cutting-edge technological insights, VantagePoint Software emerges as an indispensable tool.
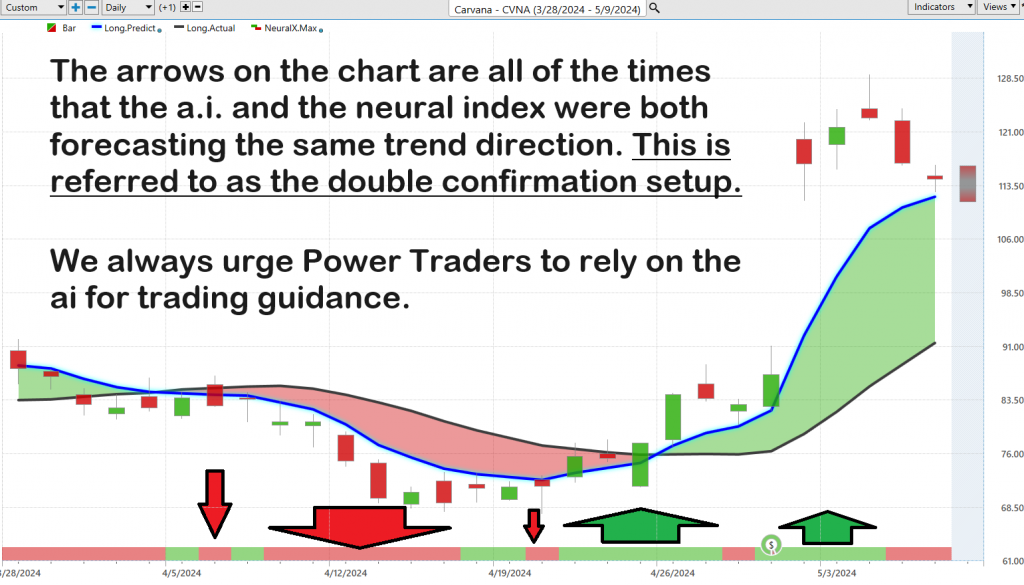
Neural Index (Machine Learning)
Neural networks epitomize the forefront of technological advancement, harnessing artificial intelligence to mimic the intricate problem-solving capabilities of the human brain. Constructed with layers of interconnected neurons, these networks analyze vast datasets, recognizing complex patterns and trends imperceptible to human traders. By assimilating historical data, neural networks refine their predictive accuracy, offering traders unparalleled insights into future market trends and dynamics. This evolutionary adaptability positions neural networks as indispensable tools for optimizing trading strategies, reducing risk exposure, and capitalizing on profit opportunities in today’s fast-paced and data-driven financial landscape.
Traders utilize this cutting-edge tool for “double confirmation,” aligning the trajectory of the predictive blue line with insights from the Neural Net Indicator to formulate data-driven analyses and forecasts. These instances of double confirmation, indicated by arrows on the chart, signify moments when both artificial intelligence and the neural index forecast the same future trend direction, offering traders high-probability trading opportunities. As financial markets become increasingly complex and data-centric, the adoption of neural networks in trading provides traders with a critical advantage, offering the promise of improved profitability through enhanced predictions and risk management. Looking ahead, the continued evolution and refinement of neural network technology are expected to drive its widespread adoption in trading, making familiarity with these advanced tools essential for traders seeking to remain competitive in the ever-evolving financial landscape.
VantagePoint A.I. Daily Range Forecast
Navigating the dynamic landscape of swing trading presents traders with the formidable challenge of precisely timing market entry and exit points amidst heightened volatility. This strategic precision is paramount for capitalizing on short-term price fluctuations while mitigating inherent market risks. However, the task of pinpointing optimal buying and selling thresholds demands not only a profound understanding of market dynamics but also the ability to forecast future movements with exceptional accuracy. Conventional methodologies, although valuable, often lack the granularity and foresight necessary to instill confidence in decision-making. Consequently, traders seek tools capable of delivering definitive guidance to optimize trade timing and maximize potential gains while minimizing exposure to risks.
Enter VantagePoint’s A.I. and its revolutionary daily range forecast, offering swing traders a cutting-edge solution to this perennial challenge. Harnessing advanced artificial intelligence, including neural networks, VantagePoint meticulously analyzes vast troves of market data to predict forthcoming price movements. Setting it apart is its unique capability to furnish precise daily price range forecasts, furnishing traders with actionable insights into anticipated high and low-price points for the upcoming trading day. This predictive prowess enables traders to establish informed buy and sell thresholds, elevating their strategies with evidence-based decision-making grounded in predictive analytics. Positioned as a guiding compass in the tumultuous sea of market trading, the daily range forecast empowers traders with a newfound sense of confidence and strategic advantage, cementing its status as an indispensable asset in the trader’s toolkit.
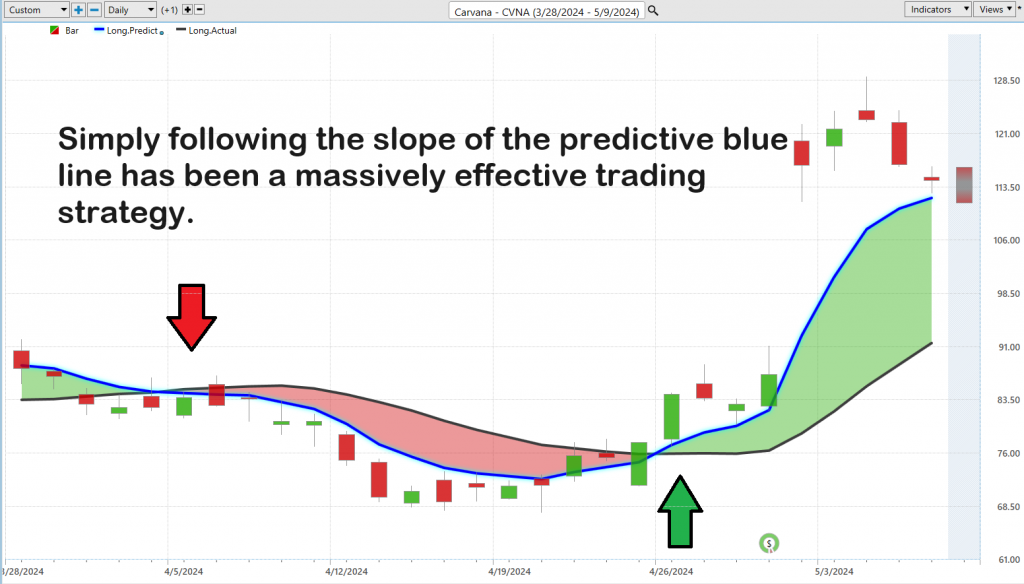
Transitioning to the VantagePoint’s A.I. Daily Range Forecast chart unveils a transformative tool that transcends conventional market analysis, serving as an essential navigator for practitioners of short-term swing trading. With a sophisticated forecast of daily market movements at their disposal, traders are equipped to navigate the choppy waters of financial markets with precision and clarity. In the fast-paced realm of short-term swing trading, where precision is paramount and the margin for error is narrow, the Daily Range Forecast, powered by VantagePoint, emerges as a game-changing resource. By harnessing the collective power of artificial intelligence, machine learning, and advanced neural networks, this tool anticipates daily market fluctuations, empowering traders—dubbed Power Traders—to expertly chart their course and execute strategies with unparalleled precision.
As you look over the following chart, keep in mind that earnings were released on May 1st. We advised traders that if earnings were less negative than Wall Street expected that the probabilities would favor an extension of the massive uptrend that was already in place. The ai forecast (predictive blue line was positive on April 24, 2024, at a price of $75.35. Using the predictive blue line as a value zone traders were buying at $75.13 or better.

Earnings showed a loss of -41 cents per share, while the expectations were for a loss of -76 cents a share. The price explosion ensued.
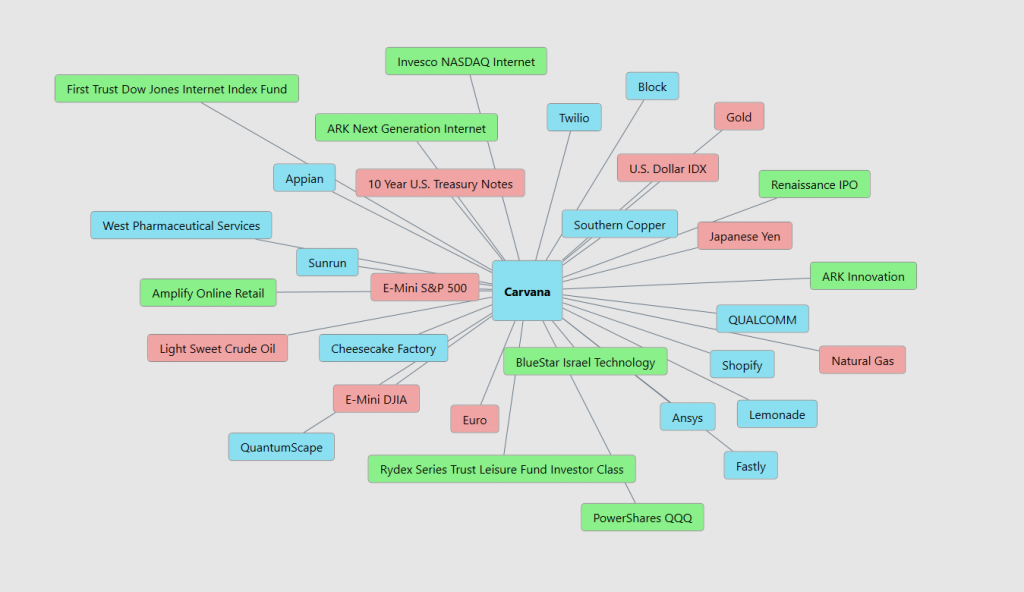
Intermarket Analysis
Intermarket analysis, a cornerstone of trading methodology, delves into the intricate web of connections among diverse financial markets, spanning stocks, bonds, commodities, and currencies. Central to this approach is the recognition that these markets operate in tandem, influencing one another in multifaceted ways. Take, for instance, the profound impact of central bank interest rate adjustments, which reverberate across currency values, subsequently affecting commodity prices and global stock markets. By dissecting these interrelationships, traders glean a panoramic understanding of the financial terrain, enhancing their ability to forecast market movements with precision. For novice traders, grasping intermarket analysis unveils the interconnected nature of financial markets, where shifts in one realm cascade through others, offering invaluable insights into future market trends.
The allure of intermarket analysis for newcomers lies in its capacity to furnish a holistic framework for trading decisions. Rather than fixating solely on individual stock performances or sectoral movements, this approach encourages a broader outlook, considering the intricate interplay of global economic dynamics and market correlations. This panoramic perspective not only unveils overlooked opportunities but also serves as a risk mitigation tool, alerting traders to potential market downturns signaled by shifts in related markets. In essence, intermarket analysis equips traders with a macro-level comprehension of market dynamics, indispensable for navigating the complexities of trading.
Here are the 31 key drivers of Carvana’s stock price:
Our Suggestion
Investor sentiment towards Carvana appears to be strengthening as the company endeavors to fortify its balance sheet. With management projecting an uptick in unit sales for the coming year, there’s an emerging belief that earnings will become the pivotal force driving Carvana’s trajectory.
Mark your calendars: the next earnings call for Carvana is scheduled for July 17, 2024. Current analyst forecasts anticipate a loss of -$0.13 per share. Should these projections hold true, it’s conceivable the case for the turnaround should continue to propel the stock higher. However, be very aware that the company has some serious financial hurdles to overcome before we can say they are out of the woods.
Currently, Carvana exhibits a high degree of volatility, as reflected by the beta value of 3.28. This indicates that the stock is currently 2.28 times more volatile than the broader market, signifying a high-risk level for investors who might be affected by wide price swings.
Given these observations, Carvana’s stock volatility is categorized as extremely high at present. This analysis suggests that Carvana is more sensitive to market swings than typical stocks, making it a potentially higher risk and higher reward investment option. The company has $6.7 billion in debt and only $243 million in shareholder equity. This means the debt-to-equity ratio is 27.60. That metric claims that $CVNA has $27.60 in debt for every dollar of shareholder equity. This is normal for high growth stocks, but it also communicates how highly leveraged the balance sheet is.
Also, the company has $1.76 billion in cash on hand, but total debt of $6.7 billion.
Cash to Debt Ratio measures the financial strength of a company. It is calculated as a company’s cash, cash equivalents, and marketable securities divide by its debt. Carvana Co’s cash to debt ratio for the quarter that ended in Mar. 2024 was 0.26.
If the Cash to Debt ratio is less than 1, the company cannot pay off its debt using the cash in hand.
Once again this shows the level of debt that $CVNA has on its books and the leverage it has accumulated.
Traders are advised to leverage AI-driven forecasts for daily market insights.
Moving into the next earnings call on July 17, 2024, monitor the monthly and quarterly highs for hints of the stock’s future trajectory.
Investors steer clear. In our estimation, $CVNA is clearly a short term hit and run trading opportunity moving forward.
In navigating Carvana’s shares, a disciplined approach to money management and position sizing is indispensable, especially as the company continues its journey towards financial stability amidst expected volatility.
We advise that you practice good money management on all your trades and that you follow the A.I. forecast for your trend analysis to determine optimal entries and exits.
Let’s Be Careful Out There!
Remember, It’s Not Magic.
It’s Machine Learning.
Disclaimer: THERE IS A HIGH DEGREE OF RISK INVOLVED IN TRADING. IT IS NOT PRUDENT OR ADVISABLE TO MAKE TRADING DECISIONS THAT ARE BEYOND YOUR FINANCIAL MEANS OR INVOLVE TRADING CAPITAL THAT YOU ARE NOT WILLING AND CAPABLE OF LOSING.
VANTAGEPOINT’S MARKETING CAMPAIGNS, OF ANY KIND, DO NOT CONSTITUTE TRADING ADVICE OR AN ENDORSEMENT OR RECOMMENDATION BY VANTAGEPOINT AI OR ANY ASSOCIATED AFFILIATES OF ANY TRADING METHODS, PROGRAMS, SYSTEMS OR ROUTINES. VANTAGEPOINT’S PERSONNEL ARE NOT LICENSED BROKERS OR ADVISORS AND DO NOT OFFER TRADING ADVICE.