This week’s ai stock spotlight is Brinker International ($EAT)
Brinker International is the proud owner of Chili’s and Maggiano’s, two restaurant chains that have survived recessions, food fads, kale-based moral crusades, and a pandemic. The company began in Dallas, Texas, back when restaurants saw customers more than DoorDash drivers. Today, Brinker runs more than 1,600 restaurants worldwide with roughly 62,000 employees. The current leadership includes CEO Kevin Hochman, an ex-Yum! Brands executive who understands the dangerous world of American chain dining better than most policymakers understand economics.
The business model is simple: Chili’s sells burgers, fajitas, and margaritas the size of small aquariums. Maggiano’s sells pasta, meatballs, and that “family-style” that Americans use as permission to eat for four. Brinker makes money by persuading millions of people that they deserve a night out, even if they just had a night out last night.
Somehow, revenue keeps climbing, margins continue to improve, and diners still show up in person despite inflation, shrinking wallets, and the general sense that society is held together with duct tape. Yes, the company carries enough debt to give any CFO heartburn, but its cash flow remains solid; solid enough to keep the queso fountain flowing without interruption. Competitors may be bigger, trendier, and far more eager to brag about their loyalty apps, yet $EAT continues to squeeze out real traffic gains and remind everyone that fajitas and pasta don’t go out of style. It’s no wonder traders are treating this stock like a genuine comeback story — because at this point, that’s exactly what it is.
In exchange, customers hand over cash so the company can pay suppliers, staff, landlords, and the guy who invented the molten chocolate cake. After that, whatever’s left is called profit. As models go, it’s more relatable than most tech IPOs.
The strategy is painfully straightforward: improve service speed, charge slightly more without customers rioting, boost margins by tweaking the menu, and try not to get annihilated by rivals. $EAT also experiments with virtual brands and off-premise dining.
Competition in the restaurant sector is like a family reunion food fight — everyone’s swinging elbows, hurling fries, and hoping customers don’t defect to the cooler cousin. $EAT competes with Darden (the Olive Garden empire), Bloomin’ Brands (the Outback Steakhouse empire), Cheesecake Factory, and Red Robin. These companies either dwarf $EAT in size or beat it in brand prestige, but Brinker beats them in one important category: menu items that taste great, even after three margaritas.
$EAT sits in the middle — not the biggest, not the smallest, but absolutely the chain you end up at when every other restaurant has a two-hour wait.
Financially, Brinker looks better than many traders expect. Revenue growth has returned, restaurant-level margins are improving, and traffic has stabilized. Even inflation hasn’t crushed their ability to serve you fajitas so hot they could power a small city.
Over the last five years Revenue is up 61% and earnings up 191% over the same time frame. To grow revenue and earnings simultaneously post-pandemic is quite a feat in the restaurant niche.

Debt exists, and it’s a lot. But $EAT generates enough cash flow to pay interest without having to pawn off barstools. The company has made progress reducing leverage, though it still carries the kind of balance sheet weight that suggests someone in accounting whispers “don’t look down” every morning.
The trend is obvious even for those of you reading this between trades: revenue up, margins up, cash up, debt slowly down. In trader terms, that’s the equivalent of someone actually following their New Year’s resolutions for more than a week.
Opportunities for $EAT mostly revolve around the shockingly durable Chili’s brand. The chain is so ingrained in American culture that even economic fear can’t kill it. People find comfort in sizzling plates, enormous burgers, and drinks that come with souvenir cups. That predictability matters when consumers are cutting back on vacations but still want to feel like they’re treating themselves.
Another tailwind is traffic recovery. As delivery fatigue sets in and fees climb to ridiculous levels, customers rediscover the ancient ritual known as “going inside the restaurant.”
Chili’s benefits from this because it offers relatively affordable sit-down meals at a time when “affordable” and “dining” rarely appear in the same sentence.
Menu optimization is also paying off. Raising prices strategically without denting demand is practically a superpower in this inflationary age. Brinker has been pulling this off with surprising finesse. Add in operational improvements and digital ordering efficiencies and suddenly $EAT looks like that underdog stock that refuses to die.
And don’t overlook the concept of share gains. Chili’s is taking market share from weaker mid-tier dining chains that can no longer keep up. In an era where consumer loyalty lasts about as long as a TikTok video, any share gain is meaningful.
Risks, on the other hand, are the same risks every restaurant chain faces: food inflation, wage pressure, fickle consumers, and the constant threat of someone posting a viral video about a customer yelling at a waiter. $EAT has to fight rising beef prices, rising labor costs, rising rent, and rising expectations from diners who now expect every chain to serve Michelin-level food at Dollar Menu prices.
Debt remains the elephant in the dining room. While manageable, it limits flexibility. If a recession hits hard, $EAT won’t have the balance sheet strength of Darden or the brand versatility of Cheesecake Factory. Chili’s is popular, but it’s not recession-proof. The company must also navigate an environment where consumers are increasingly unpredictable — one month they’re splurging on fajitas, the next they’re panic-reading financial doom posts and staying home.
Competition is another risk. Darden’s endless breadsticks are a weapon of mass destruction. Outback’s Bloomin’ Onion has a fanbase that borders on cultish. Cheesecake Factory’s menu is basically a phone book of temptation. To stand out, Chili’s has to stay relevant while maintaining margins — a delicate balancing act requiring equal parts strategy and prayer.
And let us not ignore the “trend fatigue” factor. Fast-casual chains and drive-thru concepts keep stealing share because people want speed, convenience, and the ability to eat without talking to waitstaff. Chili’s must adapt without losing the dine-in experience that made it what it is.
Despite these challenges, traders have rediscovered $EAT as one of the more compelling mid-cap restaurant comeback stories. The stock’s rally has been driven by improving margins, stabilizing traffic, and operating discipline. While the industry remains chaotic, Brinker has shown that a simple formula — solid food, consistent execution, and reasonable prices — still has real power in the American market.
The catalyst landscape for EAT is surprisingly lively for a chain best known for sizzling fajitas and margaritas with their own gravitational pull. The upcoming earnings cycles in early 2025 remain the main event, because margin performance will determine whether this rally is just a warm-up act or the full rock concert. Traders want to see traffic stability, disciplined pricing, and continued improvement in restaurant-level profitability; if those boxes get checked, analysts will start upgrading faster than Chili’s can refill a chips-and-salsa basket. Summer brings another important moment with menu pricing adjustments — those delicate little tweaks that can either lift revenue or scare customers back to their microwaves. If Chili’s can raise prices without losing bodies in seats, that’s a genuine bullish signal.
Meanwhile, debt refinancing hangs quietly in the background like a moral lesson in an 8th-grade health class. Any progress here will not only lower financial stress but also earn Wall Street’s applause, since $EAT’s balance sheet remains its most obvious weak spot. And then there’s the holiday dining season, the perennial wildcard. This is when Americans rediscover the joys of comfort food, oversized portions, and escaping family arguments by going out to dinner. Historically, Chili’s benefits from this predictable winter migration pattern. If seasonal traffic comes in strong again, it will reinforce the idea that the brand still resonates with consumers even when wallets are tight.
Taken together, these catalysts create a runway of potential upside. They won’t eliminate risk — nothing in the restaurant sector does — but they do offer several clear checkpoints where traders can reassess whether $EAT’s momentum is holding firm or starting to wobble.
Each of these catalysts will help determine whether $EAT continues its victory lap or runs headfirst into a brick wall of inflation, consumer weakness, or operational hiccups.
The final verdict for traders is this: $EAT is a mid-cap comeback kid in an industry where most comeback attempts fail harder than New Coke. The stock’s rally is supported by real fundamentals — not hallucinations, hype cycles, or wishful thinking. Revenue is up, margins are improving, operations are tighter, cost control is working, and customers keep coming back for more sizzling fajitas.
Is the stock risk-free? Of course not. This is the restaurant sector — danger is baked into the business model like calories into a Chili’s triple-dip appetizer. But for traders looking for names with genuine momentum and improving fundamentals, $EAT deserves a spot on the watchlist. It isn’t a moonshot, and it isn’t a falling knife. It’s a steady operator in an industry full of circus acts.
A trader’s takeaway should be simple enough to absorb while refreshing your charts: $EAT is a stock with improving fundamentals, expanding margins, better traffic trends, and a management team that finally seems awake at the wheel. The rally isn’t smoke and mirrors — it’s the market rewarding a company that spent years in the penalty box and finally found its footing again. If trends continue, this could remain one of the more dependable restaurant names for active traders. Just keep an eye on consumer softness, debt levels, and menu pricing. As long as those stay rational, the stock has room to keep cooking.
In this stock study, the goal isn’t to canonize tickers or get swept up in whatever narrative Wall Street happens to be peddling this week. It’s to understand the forces actually moving the tape. Markets don’t operate on coincidence; they operate on incentives, pressures, and patterns—often long before the headlines catch up. Every chart is a narrative in motion, and every data point carries intent. What we’re doing here is determining whether this stock merits your capital, your attention, or a polite pass. And the tools behind that judgment aren’t hunches — they’re the product of years of data, behavioral analysis, and predictive intelligence working beneath the surface to reveal what the market itself already knows.
- Wall Street Analysts Ratings and Forecasts
- 52 Week High and Low Boundaries
- Best-Case / Worst-Case Scenario Analysis
- VantagePoint A.I. Predictive Blue Line
- Neural Network Forecast (Machine Learning)
- VantagePoint A.I. Daily Range Forecast
- Intermarket Analysis
- Our Suggestion
Artificial intelligence may set the tone for the forecast, but let’s be clear — it’s not the whole story. Before you put real money behind any signal, you’ve got to step back and feel the company’s heartbeat. I’m talking about the fundamentals, the risk pulse, and the macro environment pressing in from every angle. For $EAT, that backdrop matters now more than ever. It explains not just what the algorithm is detecting, but why the odds are shifting the way they are — and whether the market’s next move is shaping up to be a moment of conviction… or a burst of pure confusion.
Wall Street Analysts Price Forecasts
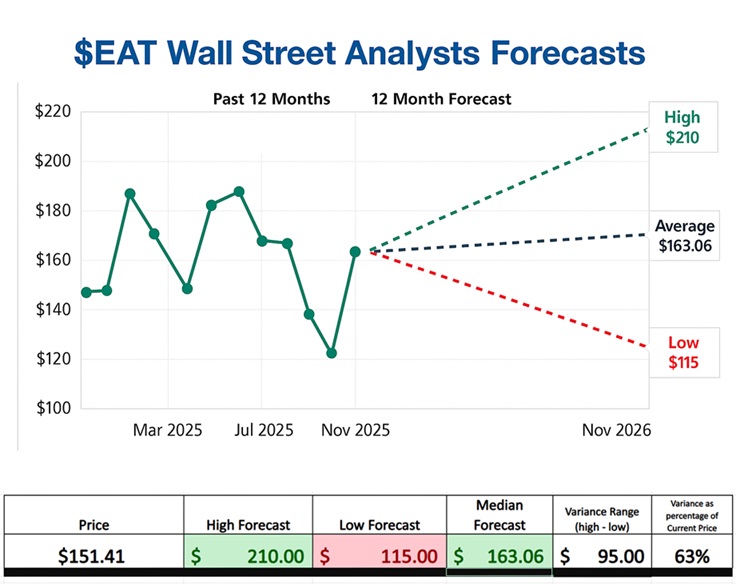
Brinker International’s outlook is shaping up to be a study in cautious optimism. Among the 16 analysts who cover the stock, the consensus lands firmly in “Buy” territory, supported by an average price target of $163.06 — implying a measured 6.91% upside over the next 12 months. But the spread tells a deeper story: the most bearish view sits at $115, while the most bullish stretches all the way to $210. It’s a range that reflects both the fragility and the potential of a company navigating a rapidly shifting consumer landscape.
When we look at Wall Street’s forecasts, the average price target often gets all the attention. But the truth is, the real story — the market’s emotional range, its anxiety level, its appetite for risk — is found at the extremes. The most bullish and most bearish analyst targets aren’t just outliers; they form the outer edges of expected volatility. They tell us how wide the battlefield really is.
The highest forecast ($210) represents the market at its most optimistic, analysts imagining a world where everything goes right, margins expand, consumers stay resilient, and operational improvements hit their mark. The lowest forecast $115 captures the opposite narrative: a scenario where the company stumbles, macro pressures intensify, or sentiment collapses.
That spread between the top and bottom isn’t noise. It’s a map of the potential price swing traders should expect. Whether you’re managing risk, sizing positions, or setting stop levels, those extremes matter because they reflect the full range of plausible outcomes — not just the comfortable middle. Currently this variance is $95 which is the equivalent of 62.9% of the current price.
In other words, the highs and lows aren’t trivia. They’re the volatility blueprint. And smart traders always study the edges before they commit capital.
52 Week High and Low Boundaries

What the two charts make unmistakably clear is that Brinker International has been living inside a remarkably wide trading corridor — one that tells a deeper story about the market’s perception of both risk and reward. The 52-week data shows a stock that has traveled from a high of $192.22 down to a low of $100.30, a near-$92 spread that amounts to roughly 61% of the current price. That kind of variance is a measure of historical volatility that speaks to the uncertainty surrounding a restaurant chain trying to redefine itself in real time.
And yet, when you overlay that reality with the Wall Street price targets, the correlation becomes almost uncanny. Analysts see an upper boundary at $210 and a lower boundary at $115, effectively mirroring the same amplitude the stock has already demonstrated over the past year. In other words, the professional forecasters are bracketing the future within almost the exact dimensions of the past. Their high target — just modestly above the 52-week high — suggests the belief that Brinker can push through previous resistance if operational momentum continues. Their low target — hovering just above the recent floor — signals that the worst-case scenario, in their view, isn’t a collapse, but a retest of levels the stock has already survived.
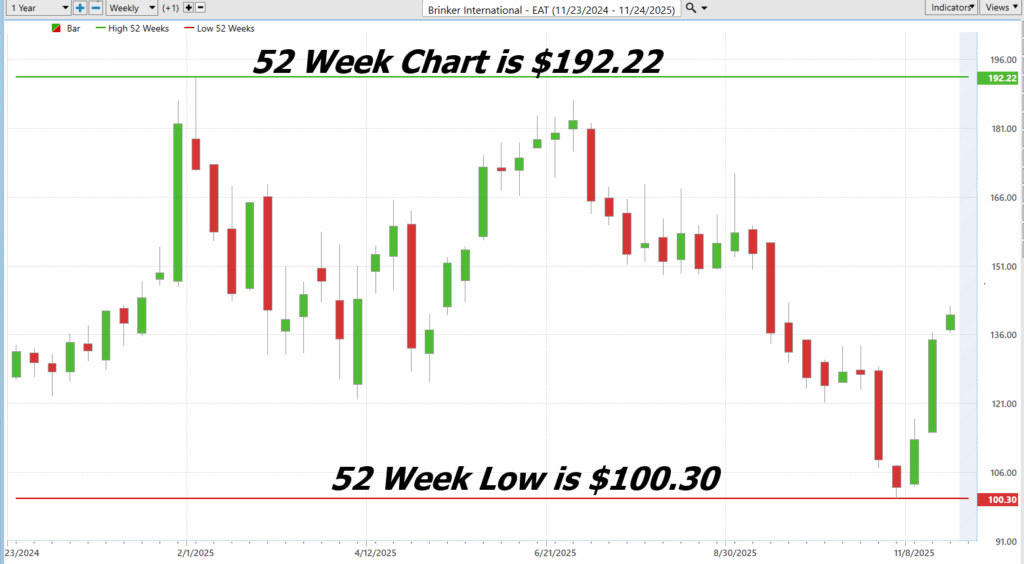
The weekly chart reinforces this narrative visually. The stock has swung violently between optimism and fear, carving out a volatile but recognizable rhythm. As it rebounds off the $100 area and pushes higher, we’re watching a market that is trying to decide whether this latest recovery is simply another counter-trend rally or the early stages of a more durable shift. The fact that the current price places EAT almost perfectly in the middle of its 52-week percentile — 55.6% — is telling. The market is neither fully convinced nor dismissive. It’s waiting for a catalyst strong enough to break the symmetry.
When viewed together, the historical range and the forecasted range tell a singular story: analysts aren’t predicting a different world; they’re predicting a continuation of the one we’ve just lived through. The volatility that defined EAT’s last year is the same volatility Wall Street expects in the year ahead. And for traders, that tight alignment between history and expectation is invaluable. It tells us that risk isn’t theoretical — it’s quantifiable, observable, and very much alive inside this stock’s DNA.
The market, in essence, is signaling that the next major move for Brinker won’t be subtle. The past year’s volatility has already drawn the boundaries. Whether the stock breaks toward the top end of that range or slips back toward the bottom will depend on whether the company can turn this recent rebound into a sustainable trend — something that neither the charts nor the analysts are willing to assume without evidence.
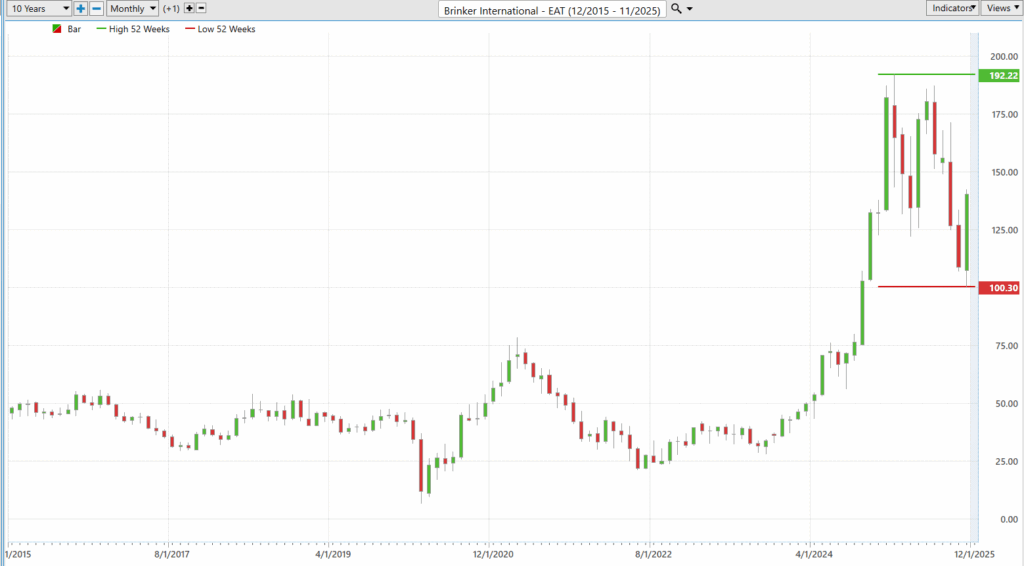
Viewed through the lens of the last decade, Brinker International’s chart tells a story far more dramatic than the typical restaurant-stock narrative. For years, $EAT traded in a broad, monotonous consolidation range — an extended lull marked by cautious investors and muted expectations. But the recent breakout, a surge that carried the stock from the doldrums of sub-$50 trading to highs near $192, suggests something more significant: a structural shift in how the market perceives the company. Even with the volatility of the past year and the sharp pullbacks that followed, the stock remains anchored near the upper end of its long-term range. And that’s what makes the turnaround narrative compelling. Whether you compare it to the 52-week spread or the Wall Street forecast bands, the conclusion is the same: $EAT is trading in territory it simply hasn’t occupied in years. The market doesn’t assign that kind of altitude casually. It’s a signal that the breakout wasn’t a fluke — it was the first chapter of a company rebuilding momentum, reclaiming relevance, and forcing traders to recalibrate what “normal” means for this stock.
Best-Case/ Worst-Case Scenario Analysis
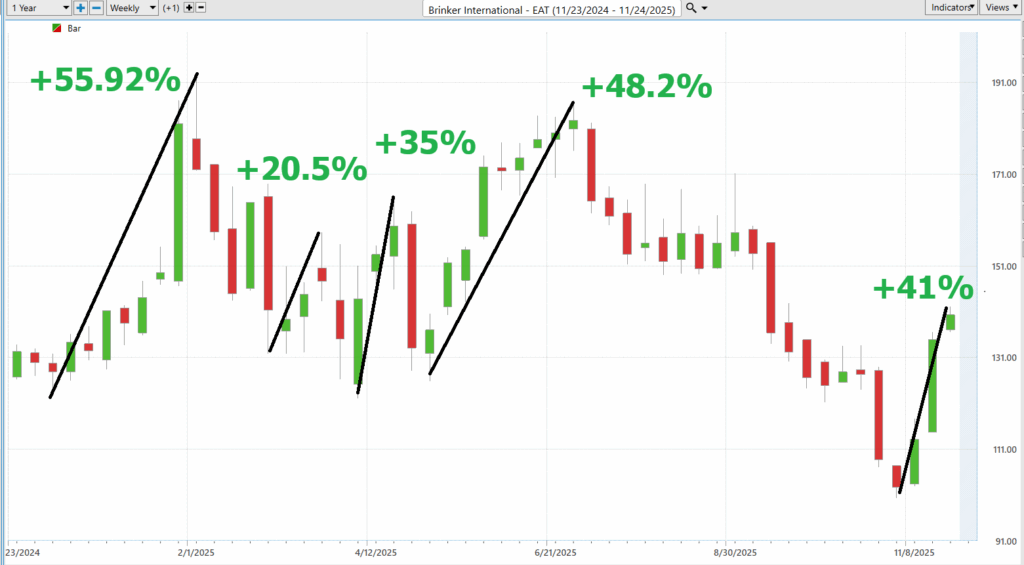
Volatility is one of those words Wall Street likes to dress up in expensive suits and pretend is a gentleman. It’s not. It’s a bar brawl in a fog machine. And the easiest, most honest way to understand it isn’t by memorizing equations or pretending you enjoy reading footnotes from the Chicago Board Options Exchange. No, the real way is to look at the biggest, ugliest, most uninterrupted rallies and face-plants the stock has thrown at you.
Take $EAT. In the last year, this thing has swung around like a caffeinated rodeo bull: rallies of 56%, 20%, 35%, 48%, and 41%… followed by face-melting drops of 58%, 22%, 23%, 18%, and 41%. That’s not a trading range. That’s a stress test for your sanity. But here’s the beauty of it: once you’ve measured the farthest the stock can lurch in either direction without stopping to catch its breath, you now possess the simplest — and frankly, the only— volatility model that matters.
Forget theoretical sigma curves. Forget academic papers written by people who have never placed a trade. You want to know what $EAT can do to you? Just look at what it has done. These swings are your roadmap. They tell you the size of the monster you’re wrestling. They prepare you for the day $EAT wakes up in a bad mood or goes on a tear like it just won the lottery.
You don’t need prophecy. You need perspective. Measure the biggest rallies. Measure the biggest dumps. Add coffee. That’s volatility. And if you can stomach those extremes, you’ll be prepared for just about anything EAT can throw at you — short of the CEO announcing Chili’s is pivoting into cryptocurrency mining.
First, we start with the best-case scenario analysis:
Followed by the worst-case scenario analysis:
When you place Brinker International side by side with the major market benchmarks, the picture that emerges is less about raw performance and more about understanding the character of the stock itself — its rhythm, its temperament, its volatility profile. Most investors know the Nasdaq, the S&P 500, the Dow, and even the Russell 2000 the way they know the weather: familiar, predictable in tone, and broadly reflective of the economic climate. By contrast, $EAT is a newer name for many traders, and this simple comparison chart serves as a way to calibrate expectations.
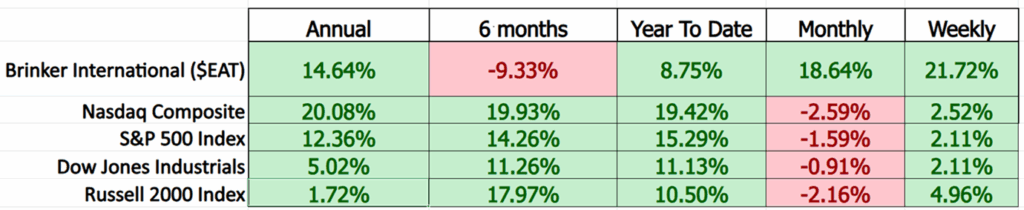
What stands out immediately is how uneven the stock’s performance is across time frames. On an annual basis, $EAT’s 14.64% return holds its own against the S&P and Dow and even edges out the Russell 2000. Yet the six-month window tells a very different story, with the stock down 9.33% while every major index posted a substantial gain. It’s a reminder that EAT doesn’t move with the market’s tide — it moves in waves of its own making, sometimes dramatically. Year-to-date and shorter time frames, however, show a resurgence: a strong monthly gain of 18.64% and a weekly jump of 21.72%, far surpassing every benchmark in the lineup.
This kind of comparative analysis isn’t meant to declare winners and losers. What it does, far more importantly, is reveal volatility in context. Traders familiar with the smoother, more diversified behavior of the big indices can instantly see that EAT swings harder, faster, and more unpredictably. The magnitude of its outperformance in short bursts and its sharp underperformance during corrections create a volatility fingerprint that tells you exactly what kind of stock you’re dealing with.
And that is the real value here. Without needing formulas or theory, the table shows where EAT excelled and where it struggled, and it gives traders a practical frame of reference for understanding how this stock behaves relative to the market they already know. It’s a simple comparison — but within it is everything you need to gauge whether EAT’s volatility is an asset, a risk, or, most likely, both.
Vantagepoint A.I. Predictive Blue Line
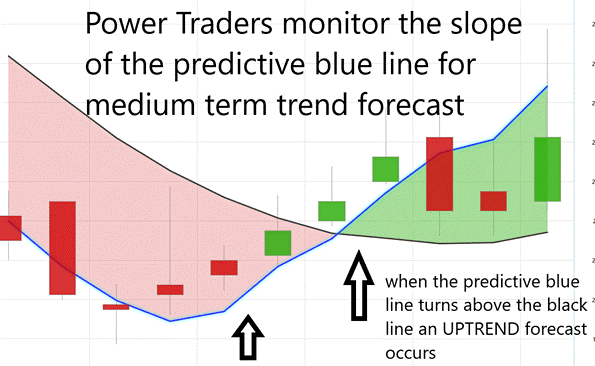
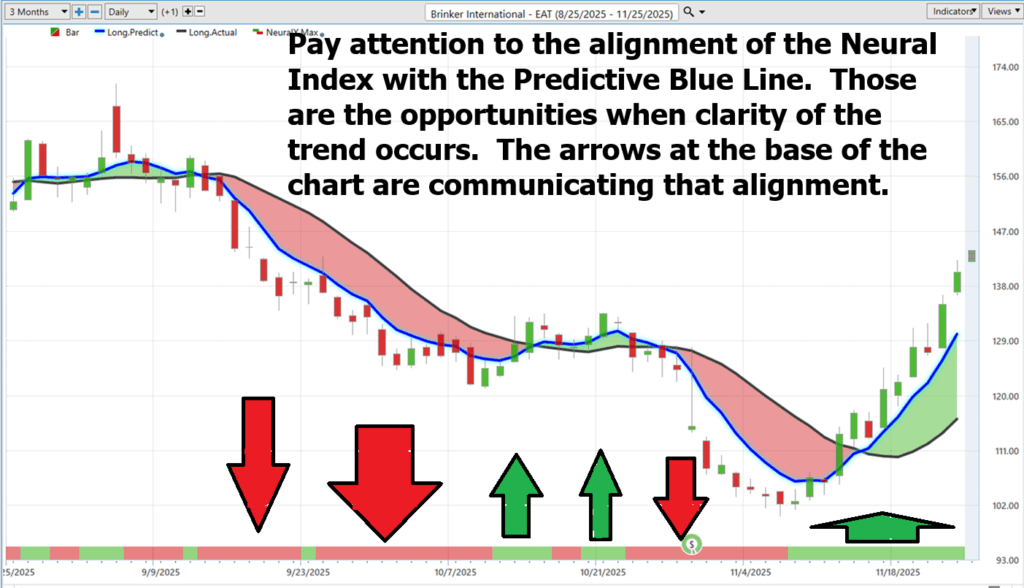
When you trade with the VantagePoint A.I. Predictive Blue Line, you’re not guessing — you’re reading the market’s weather report before anyone else sees the clouds. The rule is beautifully simple: when price closes above the Blue Line, the trend is expected to move higher; when it closes below, the trend is expected to weaken. But the real magic isn’t just the crossover, it’s the slope. A rising Blue Line tells you momentum is building beneath the surface, even when the chart looks sluggish. A declining Blue Line warns you the floorboards are creaking, no matter how strong the last candle looked. It’s trend identification with the clutter removed, a clarity most traders don’t realize they’ve been missing.
And here’s the part most people underestimate: the slope of that Blue Line becomes your short-term compass. A steep upward slope signals acceleration — buyers aren’t just showing up; they’re showing up with conviction. A flattening slope tells you the party’s slowing down. A downward slope? That’s the market quietly clearing its throat before giving you the bad news. When you combine crossovers with slope, you’re effectively trading in harmony with the underlying forces instead of reacting after the fact. It’s practical, it’s disciplined, and once you get used to it, you’ll wonder how you ever trusted a chart without it.
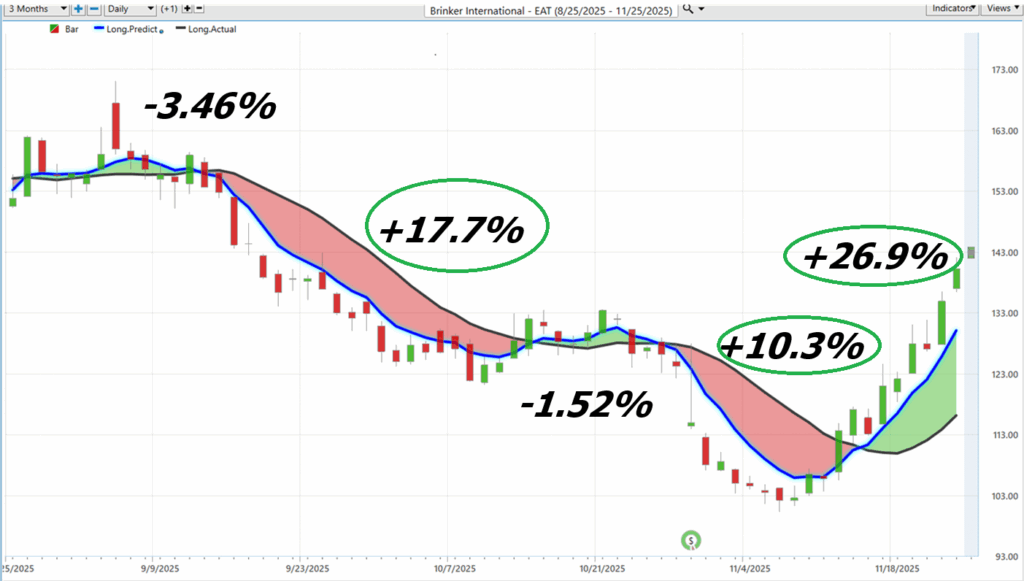
If you want a crash course in how markets really behave, take a long, honest look at this chart. In the past three months, the Predictive Blue Line has spat out five trend forecasts — each one like a weather report for traders who insist on sailing directly into storms. Three of those signals were winners, and not polite, button-down, “thank-you-sir-may-I-have-another” winners. No, these were full-throttle, hair-on-fire rallies totaling a combined +54.9%. That’s the kind of performance that makes you think the market might actually like you.
And then there were the losers — two of them. Small ones. The kind of losses that barely qualify as inconveniences, amounting to a measly 4.98% in total. These are the trading equivalent of stubbing your toe: it hurts, but you don’t lose the leg. Meanwhile, the winners are the fireworks. The moonshots. The reminders that when the slope of the Blue Line turns in your favor, you’re not just following a trend — you’re catching a trend with the wind at your back and a margarita in hand. The most important adage in trading is to keep your losses small and the A.I. manages to navigate the market volatility like a pro.
This whole graphic is volatility dressed up as opportunity. And if you can stomach the tiny dings, the payoff is clear: the Blue Line doesn’t have to be perfect — it just has to be better than the chaos it’s predicting.
VantagePoint A.I. Neural Index (Machine Learning)
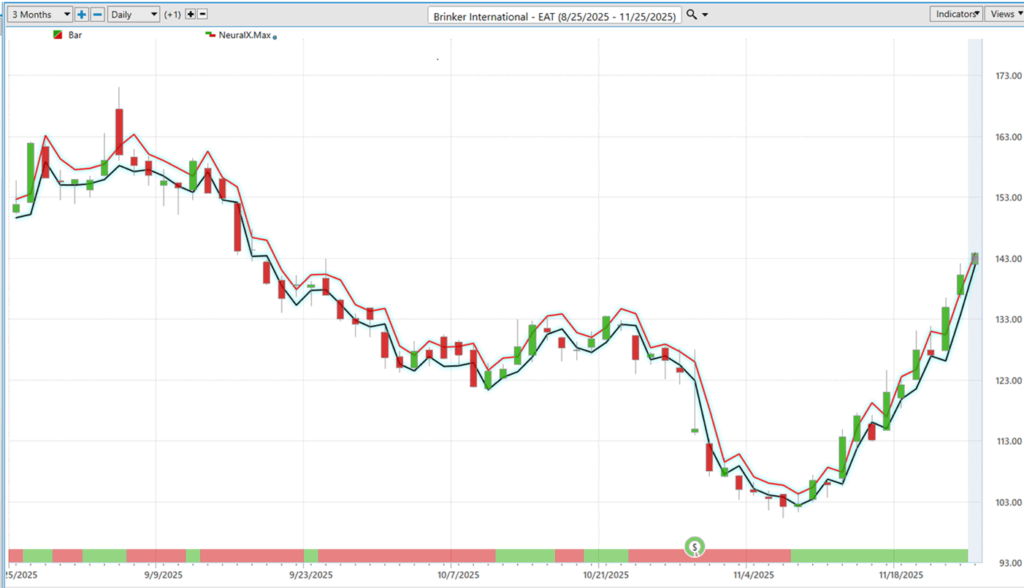
A neural network, in trading terms, is essentially a digital brain built to recognize the things humans are terrible at noticing — patterns buried inside patterns, relationships that shift in real time, and subtle signals scattered across dozens of markets all at once. It studies how markets behave the way a seasoned trader would, except it doesn’t get tired, biased, emotional, or bored. It processes price, momentum, intermarket relationships, volatility, and time-based behaviors to produce clean, actionable insight. And while it doesn’t predict the future in some mystical, crystal-ball sense, it does help traders make sharper decisions by weighing probabilities with a level of consistency no human could imitate.
The neural index sits at the base of the chart and delivers two simple but powerful signals. When it turns red, it’s anticipating short-term weakness over the next 48–72 hours; when it flips green, it’s signaling short-term strength over that same window. Traders watch for moments when the neural index lines up with the Predictive Blue Line, because that alignment often marks the highest-probability opportunities. Think of the neural index as a short-term GPS — it doesn’t tell you the whole journey, but it does warn you when to expect bumps, detours, or acceleration. And when a red forecast appears, price has a habit of drifting back toward the Predictive Blue Line, almost as if the market is being pulled to its equilibrium point.
VantagePoint A.I. Daily Range Forecast
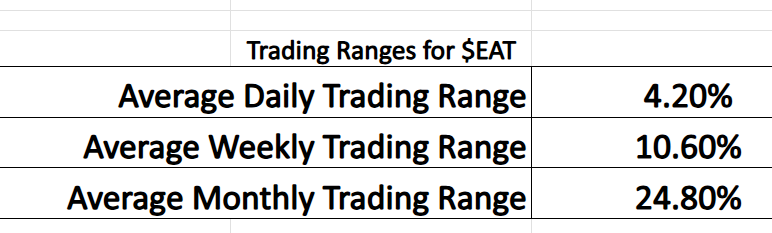
If you ever needed proof that volatility is not dead, these two charts serve it up like a sizzling plate of Chili’s fajitas. First, look at the trading range stats: $EAT swings an average of 4.20% a day, 10.60% a week, and 24.80% a month. That’s not a stock — it’s a roller coaster built by someone who failed the safety inspection. But in a good way. For traders, this is the dream: plenty of movement on every timeframe, enough chaos to generate real opportunity, and just enough predictability to keep your heart rate below “medical emergency.” In short, $EAT gives you room to work. Lots of it.
Then the Daily Range Forecast steps in like the only sober person at the party, calmly pointing out the expected high and low before the day even starts. And the remarkable thing? Price actually behaves. Look at the second chart — the red and green bands practically hug the candles like they’re long-lost relatives. Price bounces off these projected highs and lows with almost clinical obedience. It’s as if the A.I. whispers, “The market will misbehave here,” and the market replies, “Yes sir, absolutely, right away.” Traders in the VP community trust this tool because it keeps earning that trust. Day after day, it nails the boundaries of volatility with uncomfortable accuracy, turning all this wild price action into something usable, tradable, and dare I say, almost civilized.
Intermarket Analysis
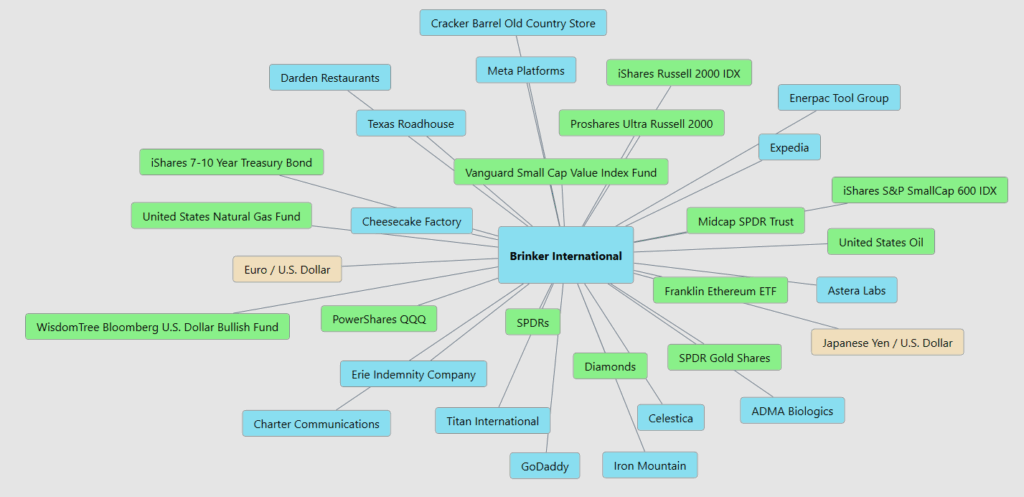
If you really want to understand why a stock moves, don’t stare at it like it’s the Mona Lisa. Look at the world around it. Markets don’t operate in isolation — they behave like a neighborhood. Some neighbors lift you up, some drag you down, and some just make a lot of noise at 3 a.m. That’s what this intermarket map shows: the ecosystem surrounding Brinker International. It’s not just restaurants. It’s interest rates, energy markets, currencies, growth stocks, value funds, and everything in between. One giant web of influence.
Start with the obvious neighbors — Darden, Cheesecake Factory, Texas Roadhouse, Cracker Barrel. These are the rivals across the street. When they’re thriving, it usually means the consumer is still spending money on “going out” instead of rationing cans of soup. But look wider. The Russell 2000, S&P SmallCap 600, Vanguard Value Funds—these tell you what’s happening with risk appetite. If small caps are catching a bid, $EAT suddenly gets a tailwind. If they’re getting steamrolled, well… you know how the story goes.
Then come the commodities and currencies — oil, natural gas, gold, the euro, the yen, the U.S. dollar index. This is where things get interesting. Rising oil prices squeeze margins. A strong dollar pressures international spending. Natural gas spikes change restaurant overhead faster than you can say “bottom line.” These forces don’t just nudge $EAT — they shape the very environment the company has to survive in. And if you don’t think a restaurant depends on energy prices, try heating an oven without electricity.
Finally, you’ve got the ETFs — the QQQs, SPDRs, midcap funds, growth funds. These represent the tidal flows of capital. When money pours into these vehicles, EAT gets picked up with the current. When money pours out, it’s like watching the tide go out and realizing your boat might not be tied to anything.
Intermarket analysis isn’t theory. It’s the roadmap. It tells you why a stock like $EAT might turn before earnings, why it trends when it “shouldn’t,” and why price sometimes behaves like it has inside information. The truth is, it does — the information is hiding in all these interconnected markets. Your job is simply to notice the relationships before everyone else wakes up.
That’s why we study this map. It shows you the weather patterns. It shows you the atmospheric pressure. It shows you the storm fronts forming in the distance. If you can read these connections, you’re no longer reacting to the market… you’re anticipating it. And that’s how traders stay on the right side of the right move at the right time.
Our Suggestion
In the Q4 2025 earnings call, the leaders of Brinker International sounded really excited and proud. They said they finished a big three-year plan to fix Chili’s, and it worked. Chili’s grew its sales by 40% over three years, made more money per restaurant, and brought in way more customers — 16.3% more traffic, which beat the rest of the restaurant industry for almost two years in a row. They also paid down a lot of debt, which helped make the company stronger. The CEO, Kevin Hochman, explained that the average Chili’s now brings in $4.5 million per year, which is way higher than before. The overall mood was confident, like the company finally had real momentum.
In the Q1 2026 call, the leaders were still positive, but also a little more careful. Chili’s continued to do great, with over 21% same-store sales growth and lots of new customers. But Maggiano’s was having a harder time, and food costs were rising because of tariffs. That meant the company lowered some of its expectations for profit growth in the short term. Still, they stayed confident about the long-term plan. They even pointed out that Chili’s was growing across all types of families, including people making under $60,000 a year.
So what are the big goals for 2026?
Management laid out several clear plans:
Keep Chili’s growing. They want Chili’s to keep increasing sales by focusing on good deals (like $10.99 meals and $6 margaritas), new menu ideas (like a big chicken sandwich launch in 2027), and better digital tools to understand what customers like.
Fix Maggiano’s.
They have a four-part plan to improve Maggiano’s: Make the menu feel bigger and fresher, improve teamwork and service, upgrade things customers see, get managers more involved again.
Basically, they want to do for Maggiano’s what already worked at Chili’s.
Make restaurants run better. This means using Chili’s “high-volume” systems in every restaurant, simplifying menus, improving technology (like iPads and Wi-Fi), and investing in staff and maintenance so customers have a better experience.
Remodel and expand. They plan to update 10% of Chili’s restaurants every year starting in 2027 and start opening more new locations, using a modern design called the “Modern Greenville” prototype.
Stay smart with money. Food costs are going up, so they’ll raise prices a little (around 1% early in 2026), continue buying back stock, and keep margins steady while aiming for earnings of $9.90–$10.50 in 2026.
Place $EAT on your trading radar.
There is plenty of tradeable volatility here to exploit, and it will provide numerous trading opportunities in the weeks ahead. Use the VantagePoint A.I. Daily Range Forecast to locate short-term trading opportunities.
Position sizing is crucial here. Practice great money management on all of your trades.
It’s not magic.
It’s machine learning.
Disclaimer: THERE IS A HIGH DEGREE OF RISK INVOLVED IN TRADING. IT IS NOT PRUDENT OR ADVISABLE TO MAKE TRADING DECISIONS THAT ARE BEYOND YOUR FINANCIAL MEANS OR INVOLVE TRADING CAPITAL THAT YOU ARE NOT WILLING AND CAPABLE OF LOSING.
VANTAGEPOINT’S MARKETING CAMPAIGNS, OF ANY KIND, DO NOT CONSTITUTE TRADING ADVICE OR AN ENDORSEMENT OR RECOMMENDATION BY VANTAGEPOINT AI OR ANY ASSOCIATED AFFILIATES OF ANY TRADING METHODS, PROGRAMS, SYSTEMS OR ROUTINES. VANTAGEPOINT’S PERSONNEL ARE NOT LICENSED BROKERS OR ADVISORS AND DO NOT OFFER TRADING ADVICE.