


This week’s ai stock spotlight is Google ($GOOGL)
Google, or as the corporate adults now insist, “Alphabet,” is headquartered in a California suburb where genius goes to either flourish or develop lower-back pain. The company began when two Stanford grad students, Larry Page and Sergey Brin, discovered the internet desperately needed a giant vacuum cleaner to suck up data and spit out search results that didn’t stink. That vacuum cleaner became the most successful digital tollbooth in human history.
Today, the company employs roughly enough people to populate a small Nordic country. Sundar Pichai runs the place with a calm that suggests he’s either enlightened or dangerously accustomed to annual revenue north of $300 billion. Google’s empire spans search, cloud computing, artificial intelligence, ads, hardware, self-driving cars, and whatever is happening in Google X behind those tinted windows. Traders don’t care about all of that. Traders care about the earnings per share, the margins, and whether it will go up more next week.
Google makes its money by turning human curiosity into ad revenue. Every time someone types “best investing tips” or “is it bad if the dog eats a candle,” Google earns a fraction of a penny. Multiply that fraction by billions of clicks, add some YouTube ads showing people unboxing stuff, mix in a rapidly growing cloud business, and you have the world’s most elegant money-spitting machine.
Their business model is simple: offer services free, trap users in the ecosystem, collect data, and then serve ads so well-targeted they often feel like mind-reading. It is capitalism’s version of magic: give away everything except the thing you actually sell. In Google’s case, that is infinitely scalable advertising. The brilliance is in the margins. Search ads are one of the highest-margin products ever created. A.I. is making them better. And better ads mean more revenue, which means the chart keeps climbing, which means traders keep pretending they’re geniuses.
The core segments still define the company. Search is the dinosaur that refuses to die and instead keeps growing stronger. YouTube acts as the cool cousin who crashes on your couch, eats all your snacks, and somehow still brings in billions. Google Cloud has gone from “please clap” to “maybe we’ll challenge Amazon someday.” And then there’s “Other Bets,” which is Silicon Valley speak for “science fair projects with infinite funding.”
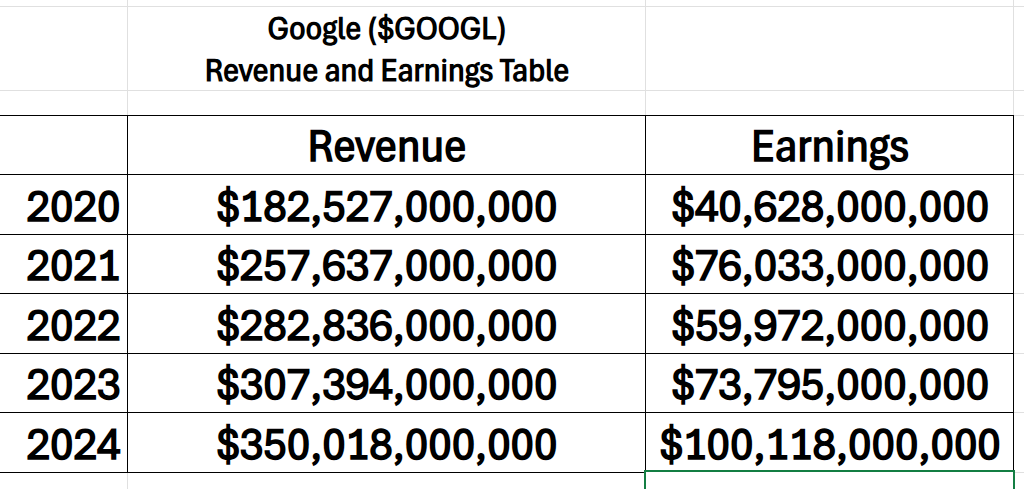
The numbers tell a story that is difficult to ignore. Over the past five years, Alphabet has added nearly $168 billion in annual revenue, a 92 percent increase that would be remarkable on its own. But what stands out even more is what happened to earnings during that same period. Profit surged from roughly $40.6 billion in 2020 to more than $100 billion in 2024 — a 146 percent increase that far outpaces the company’s already extraordinary top-line expansion.
This is the kind of trajectory that signals not just growth, but structural improvement. Alphabet is not simply getting larger; it is becoming more profitable as it scales, an increasingly rare dynamic in a sector where rising investment in A.I., cloud infrastructure, and content moderation has pressured margins for many. The fact that earnings are accelerating faster than revenue suggests that the company is extracting more operating leverage from its businesses, streamlining costs, and monetizing its assets with greater precision.
Taken together, the data paints a clear picture. Alphabet is moving through a period of expansion in which revenue growth and margin expansion are occurring simultaneously. For a company already operating at global scale, that combination is exceptionally impressive — and it goes a long way toward explaining why investors have continued to reward the stock.
Financially, Google is what happens when a company becomes so dominant the hardest part of earnings season is finding new ways to say everything’s fine. The revenue machine keeps humming. Margins stay wide enough to host a county fair. Cash piles up like Google is prepping for an alien invasion. Debt exists, but it is so tiny compared to cash that it might as well be a rounding error.
Google’s opportunities revolve around A.I., cloud growth, monetizing YouTube more aggressively, and replacing the world’s remaining unmonetized eyeballs with monetized ones. The arrival of Gemini, the A.I. suite that wants to run your life, your business, and possibly your toaster, signals a shift toward A.I.-powered everything. Traders drooled over the idea of more automation, more data, more enterprise adoption, and more reasons for Wall Street to add another round of price target upgrades.
YouTube Shorts is another catalyst, a direct punch at TikTok with far more monetization potential. If regulators decide TikTok is too spooky to exist, Google becomes the automatic winner by default, like the kid who wins class president because the other candidate transferred schools.
Cloud continues to grow at double-digit rates. Every business on Earth is migrating data to cloud platforms, and while Amazon still dominates, Google is climbing in with A.I. features that are useful. A.I.-enhanced cloud platforms tend to create sticky customers, which translates into recurring revenue, which in trader-speak means “multiple expansion.”
Then we get to Waymo, the self-driving car project that oscillates between genius and “are we still doing this?” Waymo’s success would be a massive optionality bonus, a free lottery ticket hiding inside Google’s conglomerate shell.
Still, risks loom like storm clouds over a picnic. Regulation is the biggest threat. Dozens of governments wake up every day wondering if today is the day they sue Google again. Antitrust battles, privacy battles, content moderation battles, take your pick. Google fights in more courts than Matlock.
A.I. misfires are another risk. The company’s reputation took a hit when early A.I. rollouts went sideways. If they botch the next major upgrade, traders might punish the stock, even if regular users don’t notice or care.
Macroeconomic risks still exist, including slowdowns in ad budgets, enterprise pullbacks, and potential recessions, but Google tends to skate through downturns better than most. People don’t stop Googling things just because GDP looks gloomy. They Google more, in fact, mostly questions like “what is stagflation?” and “should I be worried?”
For traders, the verdict is simple. Google remains one of the most structurally sound, financially indestructible, annoyingly efficient businesses on the planet. Momentum favors the upside, especially as A.I. hype continues pouring gasoline on megacap tech valuations. Every dip so far has turned into a buyable opportunity. Every call from the “Google is dead” crowd has aged like unrefrigerated shrimp.
Google’s staying power comes from its ability to reinvent itself while still milking its oldest business lines like prize dairy cows. Search continues dominating. YouTube remains the only platform where creators can survive without dancing. A.I. is becoming more competent. And Cloud is moving from “cute” to “serious threat.”
The company’s biggest risk is that success breeds enemies, regulators, competitors, and politicians who suddenly decide their TikTok feed is filled with too many Google ads. But the company has so much cash and so many defensive moats that it is hard to see a real threat emerging anytime soon.
For traders, the story boils down to two things. Google has momentum. And Google has margins. Those two ingredients make for the kind of chart pattern traders love, the slow, relentless grind upward that feels boring right up until it goes vertical. AI upgrades create spikes. Cloud reaccelerations create spikes. YouTube monetization improvements create spikes. Antitrust rulings create dips that usually do not last long enough to matter.
This is not a meme stock. It is not a rumor stock. It is not a hope and pray stock. It is a machine. A giant, humming, unstoppable machine that takes global human behavior and turns it into revenue so euphoric that Wall Street analysts run out of synonyms for “robust growth.”
Google still prints money like it’s the U.S. Treasury, only with better marketing and fewer congressional hearings. Search remains the cash cow that never stops chewing, YouTube behaves like the hyperactive teenager who somehow keeps bringing home straight A’s, and Cloud is the late bloomer finally showing up to the game ready to win. The so-called competition is mostly busy lighting piles of cash on fire in a desperate attempt to keep up. Sure, the risks are real, from regulators sharpening their knives to A.I. faceplants to the horrifying possibility that teenagers might one day stop watching ads altogether. But traders keep piling in for one simple reason: momentum, fat margins, and machine learning keep shoving this thing higher.
The final trader takeaway is refreshing in its simplicity. Google is still Google. It keeps winning. It keeps expanding. It keeps making money in ways that feel both inevitable and slightly creepy. It is a stock that rewards people who hold it, trade it, swing it, scalp it, and forget about it entirely. You can try to overthink it, but the easiest explanation is often the best: Google keeps going up because Google keeps doing what Google does, extracting ad dollars from every corner of the digital universe.
And until something breaks that magic, traders may as well surf the wave. There are harder ways to make money, but few easier than riding the upward drift of a company whose business model is essentially monetizing curiosity itself.
That is why it rallies.
The indicators we’re using aren’t hunches, guesses, or anybody’s gut feelings. They’re cold, hard numbers with the steel behind them to prove it. Every signal comes straight from real market behavior, not the latest spin from Wall Street’s chatter class. These tools are built on historical probabilities, patterns that have shown up again and again because investor psychology hasn’t changed in a hundred years. And behind all of it, you’ll find machine learning models tuned to catch the turn long before the headlines ever acknowledge it. By the time the rest of the market wakes up, we’ve already seen the shift coming.
- Wall Street Analysts Ratings and Forecasts
- 52 Week High and Low Boundaries
- Best-Case / Worst-Case Scenario Analysis
- VantagePoint A.I. Predictive Blue Line
- Neural Network Forecast (Machine Learning)
- VantagePoint A.I. Daily Range Forecast
- Intermarket Analysis
- Our Suggestion
Now, artificial intelligence gives us a powerful anchor — no question about it. But it’s still no replacement for straight, common-sense judgment. Before we act on any signal, we head right back to the fundamentals: the company’s financial strength, its competitive position, and the risks that could rattle its footing.
And for $GOOGL, that context matters enormously, especially at this moment. This is a stock where the narrative behind the numbers is just as critical as the numbers themselves. When you understand that full picture, you can see not only what the models are projecting, but why they’re projecting it. You can tell whether the next move is built on genuine institutional conviction, or whether the market’s simply warming up for another round of confusion.
In a market this dynamic, the ability to separate real strength from all the surrounding noise is everything. And right now, $GOOGL is standing directly at that crossroads.
Wall Street Analysts Price Forecasts
The first thing we do is look at what Wall Street’s brightest analysts are forecasting for the stock because the real insight comes from studying the wide divergence in their opinions.
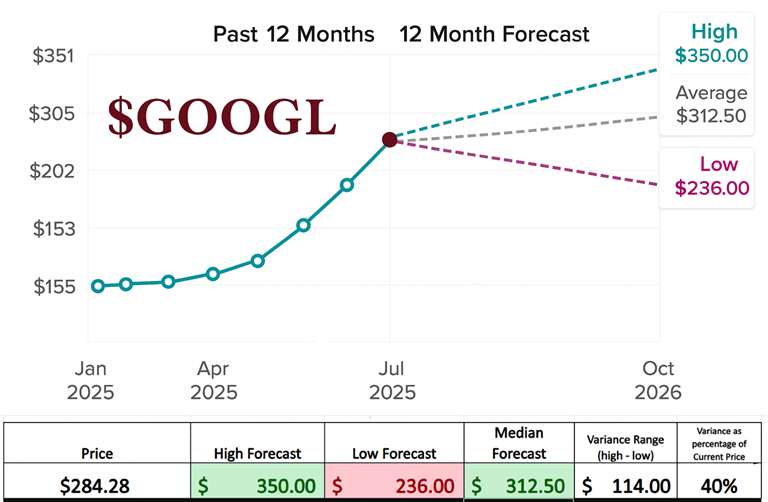
The chart tells the kind of story traders instinctively lean in for: a quiet, steady climb that suddenly finds its stride and turns into a full-fledged breakout. Over the past year, GOOGL didn’t simply drift higher; it advanced with the confidence of a company that looks increasingly difficult to bet against. What began near the subdued $155 level in early 2025 gradually tightened, then accelerated, then surged into summer, a reminder that Alphabet still controls one of the most powerful business engines in the global markets.
What matters as much as the forecasts themselves is the distance between them. The spread from the highest estimate to the lowest is a full $114, a variance wide enough to demand attention. In analyst circles, that spread is often treated as a proxy for expected volatility. It is a quiet acknowledgment that even the most seasoned market forecasters see a landscape defined not just by direction, but by magnitude. A 40% range around the current price signals a stock poised for meaningful movement, even if the direction remains a matter of debate.
According to the most recent round of analyst updates, the average 12-month price target stands at $312.50, with projections stretching from $236.00 on the low end to $350.00 at the high. On balance, the average target implies roughly a 9.93 percent increase from the latest closing price of $284.28. It is a portrait of a company that continues to command broad optimism with just enough uncertainty to keep traders sharply focused.
And that tension — between proven momentum and a wide forecast envelope — is precisely what makes this setup so compelling. The past year shows a clean, powerful trend. The next year shows a battlefield of possibilities. Together, they outline exactly the kind of environment where traders begin asking not just where the stock is headed, but how far and how fast it might get there.
52 Week High and Low Boundaries
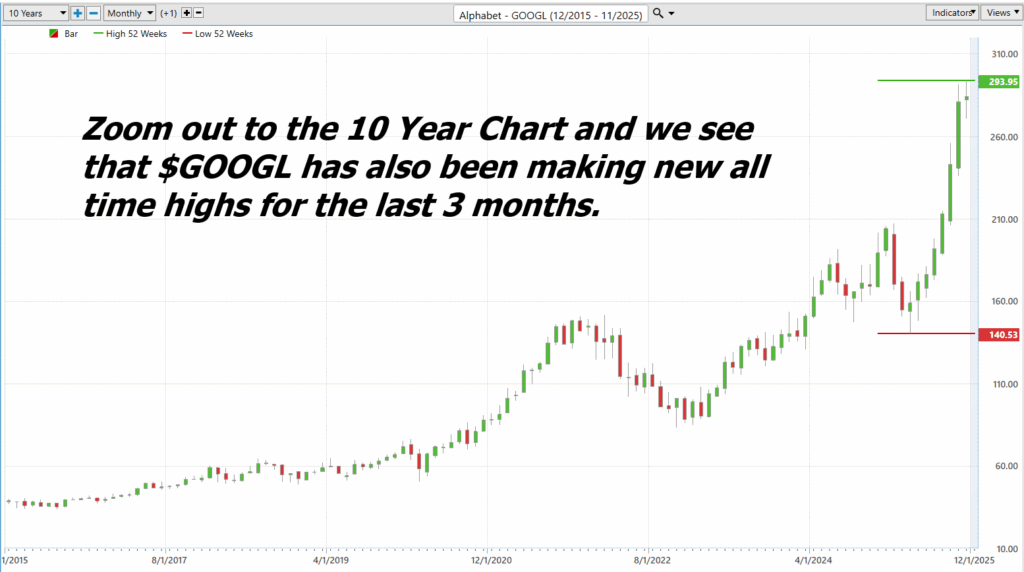
If you want to understand the true personality of a stock, don’t listen to the commercials, the annual report, or the PR team that makes everything sound like a children’s book about cooperation and sunshine. Look at its price chart. That’s where the real biography lives. And in the case of $GOOGL, the 52-week chart reads like the life story of a creature that spent half the year hibernating and the other half setting small fires.
The first graphic tells the tale plainly. After a sleepy, red-candle shuffle through early 2025, $GOOGL suddenly remembered what it was — a tech giant with more cash than some countries — and launched into a weekly climb that looks like it was drawn by a fitness influencer shouting “one more rep.” Green bar after green bar, pausing only long enough to catch its breath, the stock moved from the $140 neighborhood all the way to the doorstep of $294. And it did it with the kind of aggressive enthusiasm that would normally require an FDA warning label.

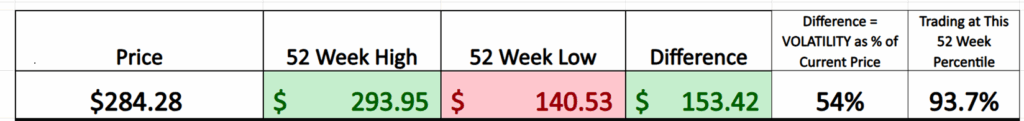
The second graphic quantifies the madness. The 52-week high sits at $293.95. The 52-week low lurks all the way down at $140.53. The difference between those numbers is $153.42, which amounts to a 54 percent swing based on the current price. And if a 54 percent range doesn’t qualify as “volatility,” then neither do roller coasters, hurricanes, or family reunions.
What makes this especially interesting is what we saw in the earlier analysis: Wall Street’s finest forecasters estimate an “expected volatility” of 40% over the next 12 months.
And yet the market itself, which couldn’t care less about forecasts, memos, or investment committees, has already delivered 54% volatility just from raw price action over the past year. In other words, Google’s statistical behavior outkicks the coverage.
The stock moves more than the analysts expect, not less. It is the financial equivalent of that one friend who promises to “keep it low-key tonight” and somehow ends up lighting a tiki torch in the neighbor’s driveway.
This is what traders lovingly call a volatility monster. Big enough to run over you if you’re careless, but glorious to ride if you catch it at the right angle. High enough in its 52-week percentile — 93.7%, to be exact — that you know the stock is sprinting near its recent highs, not skulking around in the basement.
Taken together, the images paint a picture that’s unmistakable: $GOOGL is not some somber blue-chip relic gently drifting upward like a retirement commercial. It is a high-powered machine with a wide trading range, strong momentum, and a habit of making analysts’ forecasts look like polite suggestions.
If your goal is excitement, opportunity, and just enough danger to keep things interesting, this is your kind of stock.
Best-Case/Worst-Case Scenario Analysis
If you really want to understand volatility, forget the PhD equations, the Greek letters, and the Wall Street word salad. Stop pretending you need a lab coat to trade a stock. All you need is a scoreboard and the courage to look at what it’s already screaming at you. And in $GOOGL’s case, the scoreboard is practically waving its arms like a traffic cop during rush hour.

Now realy look at the first chart. This is where the fun starts. GOOGL ripped higher by 22%, then 79.8%, then another 24.3% — like a heavyweight fighter who decides halfway through the match that he actually likes getting punched because it gives him an excuse to hit back harder. These aren’t polite rallies. These are tidal waves. These are “strap in, hold your breath, and don’t sneeze or you’ll fall off the trendline” type moves.

Next look at that second chart. This thing didn’t just dip; it collapsed 31.5% in one swing. That’s not a gentle pullback. That’s the market grabbing the stock by the collar and slamming it down the stairs. Then, after the dust settled, GOOGL pulled another classic move: a smaller but still sharp 7.9% drop, because volatility never shows up alone. It always brings a friend.
And here’s the point most traders miss: you don’t need to predict volatility when it’s already advertising itself like a neon sign outside a Vegas casino. The biggest rallies. The biggest declines. They’re all right there on the chart. They’ve already happened. They’re real. They’re measurable. And they’re telling you exactly what Google is capable of doing when the market decides to get emotional.
Understanding volatility isn’t about calculating it. It’s about anticipating it — and the easiest way to anticipate it is by studying the magnitude of the swings the stock has already survived. %GOOGL has shown you that it can fall 31.5% when it wants to. It can surge nearly 80% when the wind shifts. It can snap back 24% just because it feels like reminding everyone who’s boss.
This simple exercise gives you the clearest, most brutally honest risk/reward profile you’ll ever get. No theory. No guessing. Just the truth: Google is a stock that punishes the timid and rewards the prepared. If you respect the size of its punches and its rallies, you’ll trade it well. If you underestimate it, it will clean your clock and leave your portfolio asking what just happened.
That’s the real story here. The scoreboard doesn’t lie. $GOOGL is a volatility machine — dangerous if mishandled, but incredibly profitable when you know what you’re dealing with.
Next, we compare $GOOGL to the broader stock market averages.

The picture that emerges from this comparison is unmistakable. Google is not just outperforming the market — it is outpacing it by a wide margin and doing so across almost every major time frame. While the Nasdaq, S&P 500, Dow, and Russell 2000 all show respectable gains over the past year, Google’s 59.6% surge stands in a league of its own. Even when you narrow the lens to the past six months, the gap widens dramatically: Google is up more than 70% during a period when its closest benchmark, the Nasdaq, rose just 16.7%.
What this tells us is that Google has been exhibiting a level of volatility and momentum that simply does not exist in the major indices. Year-to-date, the company has gained 50% — more than triple the broader market. And monthly, it continues to push higher even as other benchmarks have slipped into negative territory. Google is moving with both greater force and greater frequency than the rest of the market, reflecting a combination of strong investor appetite and rapidly shifting expectations around A.I., cloud adoption, and digital advertising strength.
But the weekly numbers add an important layer of nuance. Google posted a modest decline of 2.54% at a time when all major indices were also pulling back, and in some cases by an even larger margin. That alignment suggests that despite its higher volatility on the upside, Google remains sensitive to broader market shifts — but it tends to recover faster and move farther once conditions stabilize.
Taken together, this comparison underscores that Google is behaving less like a traditional mega-cap and more like a high-velocity growth asset — outperforming the market’s advances, reacting sharply to short-term pressures, and consistently regaining momentum once those pressures ease. For traders, it’s a reminder that Google is one of the few large-cap stocks capable of generating outsized returns in a relatively short period of time, but it also demands a willingness to navigate elevated swings along the way.
Vantagepoint A.I. Predictive Blue Line
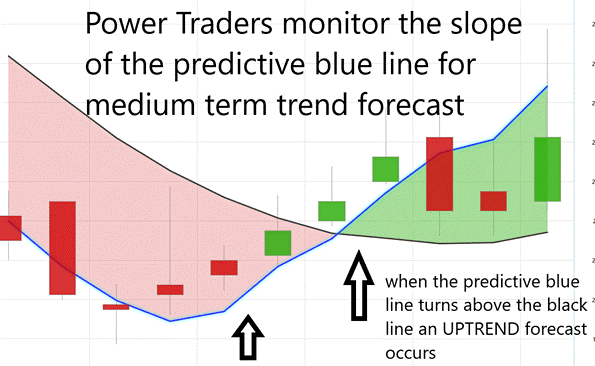
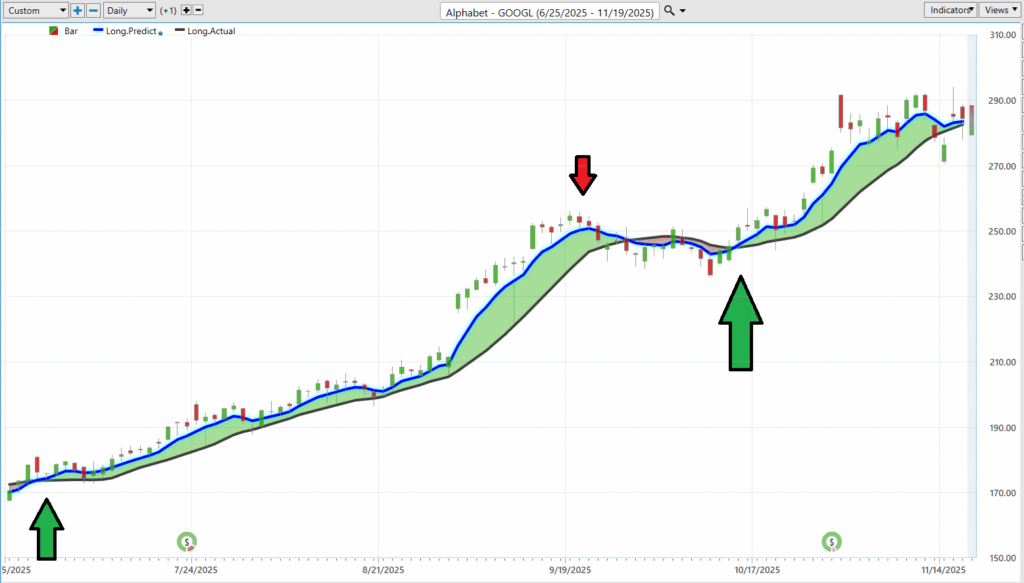
The first thing to understand when looking at the VantagePoint A.I. Predictive Blue Line is that it is not simply another moving average. It is designed to function as a forward-looking indicator — a model-driven forecast of where momentum is expected to shift before conventional indicators catch up. And the rules for trading it are remarkably straightforward. When the blue line is sloping upward, the trend is strengthening and buyers have the advantage. When it slopes downward, the momentum is deteriorating and risk is increasing. But the most consequential signal comes when the blue line crosses the black line, which in this case represents a standard 10-day simple moving average.
A slope change is often the earliest indication that something material is happening beneath the surface. It can precede a trend reversal, flag a deceleration in buying pressure, or reveal that institutional flows are beginning to shift. Traders who follow the model closely tend to watch these subtle inflections with the same intensity analysts reserve for early revisions in economic data — because slope changes often show up days before price itself fully reflects the shift.
A full-fledged crossover, however, carries far stronger implications. When the blue line crosses above the black line, it signals that the predictive momentum has turned definitively higher and that the market’s short-term trend is aligning with the A.I. forecast. Conversely, when the blue line crosses below, the model is signaling a meaningful transition — one that often marks the beginning of a broader pullback or a pause in the prevailing trend.
In the chart, the dynamic between the predictive blue line and the 10-day simple moving average illustrates this interaction clearly. The model doesn’t just react to price; it anticipates it. And the crossovers, combined with the direction of the slope, provide traders with a structured framework: follow the blue line’s lead when it begins to turn, and pay close attention when it crosses the black line entirely. Because in markets where speed matters, the difference between recognizing the shift early and reacting after the fact can be the difference between capturing the move or simply reading about it in tomorrow’s headlines.
VantagePoint A.I. Neural Index (Machine Learning)
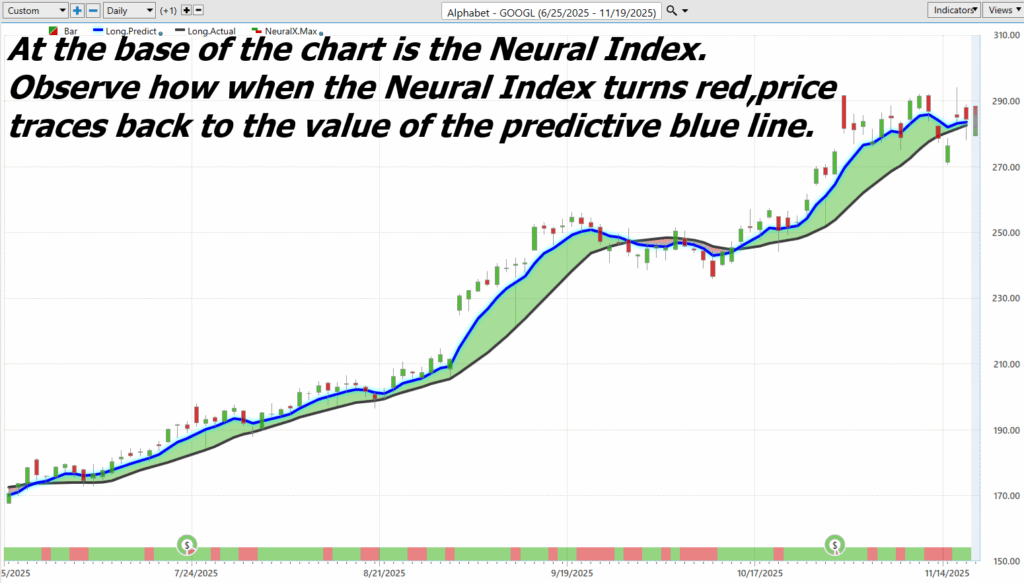
A neural network in trading is basically your smartest friend — the one who doesn’t talk much, doesn’t guess, doesn’t brag about their gut feeling, and just quietly analyzes a thousand things you didn’t even notice… then taps you on the shoulder when something important is about to happen. It’s built the same way your own brain is built: lots of tiny “neurons” connected together, each weighing information, each making micro-judgments, and each passing those judgments on to the next layer. One neuron doesn’t know much. But hundreds of them, stacked and trained on mountains of price data, volume, intermarket relationships, and historical patterns? Now you’ve got something dangerous. Something useful.
Constructing one isn’t romantic. It’s not one genius sipping coffee at 3 a.m. sketching equations on a napkin. It’s engineers feeding the network ridiculous amounts of historical data — years of price movement, volatility spikes, correlations between markets, even the weird little patterns nobody ever talks about but the market repeats anyway. The machine tests itself over and over. Makes predictions. Gets them wrong. Adjusts its weights. Learns from the mistake. Learns again. And again. After millions of these “reps,” the network starts doing what humans struggle with: recognizing patterns hidden so deep in the noise you wouldn’t spot them with a microscope.
And that brings us to the value. A neural network doesn’t replace your decision-making — it sharpens it. It tells you, “Hey, something underneath the price action just shifted.” In the chart you’re looking at, the Neural Index turns red right before price snaps back to the Predictive Blue Line. That’s the network whispering, “Pressure is building. Don’t get cute. Expect a pullback.”
The magic isn’t that the neural network is smarter than you. It’s that it sees what you can’t see. That’s the whole edge: You stay human, with judgment and context. The machine stays the machine, with cold vision and no ego. And together, you get decisions that are clearer, earlier, and a whole lot less emotional than the crowd chasing candles on Twitter.
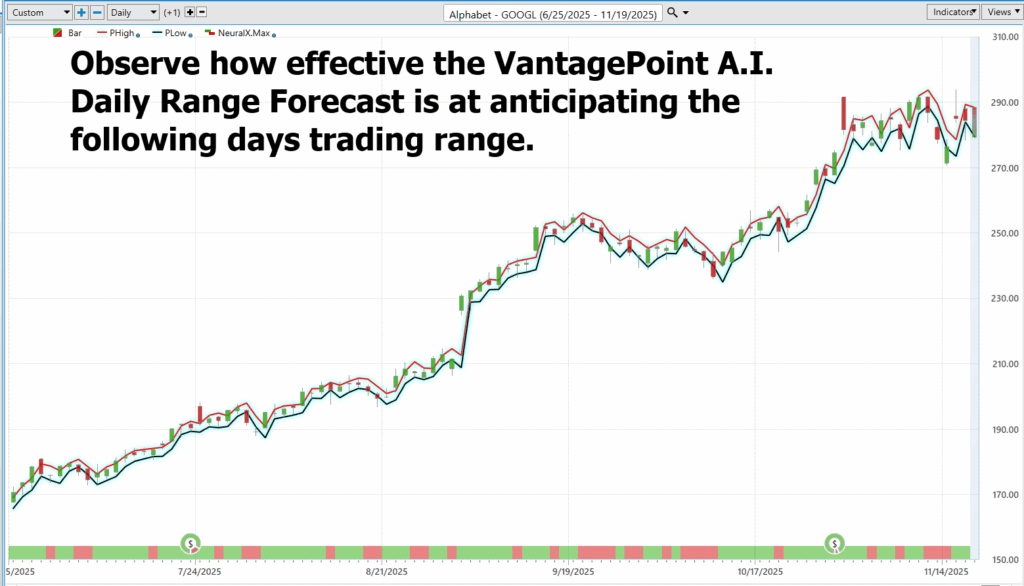
VantagePoint A.I. Daily Range Forecast
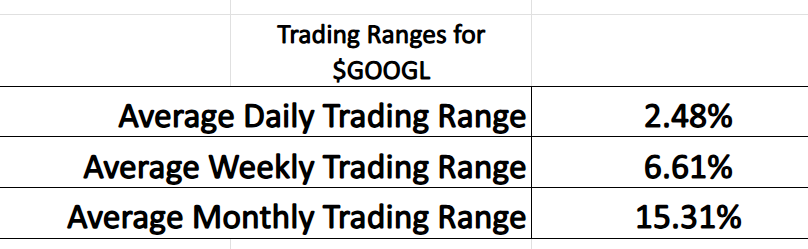
The data illustrates a simple but important reality: Google’s current volatility is creating a wide, tradeable landscape for short-term traders. With an average daily trading range of 2.48%, a weekly range exceeding 6.6 percent, and monthly swings averaging more than 15%, there is clearly enough movement in this stock to generate meaningful opportunity. These aren’t marginal fluctuations. They’re material ranges that allow disciplined traders to participate in directional moves without needing to predict long-term outcomes. For traders looking for activity, Google is providing it in abundance.
That context makes the Daily Range Forecast particularly important. Its purpose is straightforward: to anticipate the next day’s expected high-low boundaries with precision. In the chart below, those predicted ranges (marked in red and teal) consistently wrap around the following day’s price action, providing a visual framework of what is statistically likely to unfold. When volatility is elevated, tools like this become especially valuable, because they replace guesswork with clear parameters. Instead of reacting emotionally to intraday swings, traders can anchor themselves to a forward-looking forecast designed to clarify the boundaries of expected movement.
For managing a portfolio, this type of guidance becomes indispensable. The Daily Range Forecast doesn’t eliminate volatility — it helps you navigate it. It highlights where risk intensifies, where opportunities emerge, and where price action is likely to retrace or extend. In a market environment where Google is offering sizable swings and rapid shifts, having a model that outlines tomorrow’s expected trading envelope gives traders the structure they need to size positions appropriately, tighten or widen stops intelligently, and manage exposure with confidence.
Intermarket Analysis
Imagine Google’s stock price ($GOOGL) as a scoreboard that never stops blinking — up, down, sideways, back up again. And behind every twitch on that screen are live big forces nudging, shoving, or straight-up launching that number.
Google runs with the heaviest hitters in the game; Apple, Microsoft, Nvidia, Amazon. When these giants flex, Google surges. If the tech tribe wakes up in a good mood, Google usually ends the day wearing a grin too.
Long-Term Bonds – (the financial equivalent of decaf tea). When interest rates drop, long-term bonds perk up. And when bonds perk up, growth stocks like Google suddenly look irresistible. Cheaper money, easier borrowing, more investor appetite, think of bonds as the boring uncle who unexpectedly hands Google the car keys.
The U.S. Dollar – Half of Google’s revenue comes from everywhere but the United States. When the dollar gets too strong, all those foreign earnings shrink on the ride home. Strong dollar = headwind. Not catastrophic, just enough to muss the hair.
Oil – Rising oil prices can mean the global economy is humming. Businesses are active, budgets loosen, and ad dollars start flowing. That’s Google’s happy place. Oil doesn’t move Google’s stock like a tidal wave, but it does toss a little wind into the sails.
So, here’s the quick-and-dirty takeaway:
If you watch only one thing, watch the Tech sector.
That’s the heartbeat. After that, glance at bonds, the dollar, and oil. If most of these players are leaning in Google’s direction, odds are Google’s price is about to wink back.
Here are the 31 key drivers of $GOOGL’s price action:

Our Suggestion
If you’re serious about getting sharper as a trader, do yourself one favor starting today:
Put $GOOGL on your radar and keep it there.
Watching Google move is like getting front-row seats to a master class in market behavior. Every twist, every surge, every pullback is a lesson in momentum, leadership, liquidity, and how big money flows. You don’t even need to trade it every day, just watching it will make you better. It’s like having a world-class professor who teaches in real time with real money on the line.
$GOOGL is gearing up to deliver a parade of trading setups in the months ahead. Lean on the VantagePoint A.I. Daily Range Forecast to zero in on the short-term opportunities with precision.
Trade smart. Guard your capital like it’s your lifeline.
Let’s be careful out there.
It’s not magic.
It’s machine learning.
Disclaimer: THERE IS A HIGH DEGREE OF RISK INVOLVED IN TRADING. IT IS NOT PRUDENT OR ADVISABLE TO MAKE TRADING DECISIONS THAT ARE BEYOND YOUR FINANCIAL MEANS OR INVOLVE TRADING CAPITAL THAT YOU ARE NOT WILLING AND CAPABLE OF LOSING.
VANTAGEPOINT’S MARKETING CAMPAIGNS, OF ANY KIND, DO NOT CONSTITUTE TRADING ADVICE OR AN ENDORSEMENT OR RECOMMENDATION BY VANTAGEPOINT AI OR ANY ASSOCIATED AFFILIATES OF ANY TRADING METHODS, PROGRAMS, SYSTEMS OR ROUTINES. VANTAGEPOINT’S PERSONNEL ARE NOT LICENSED BROKERS OR ADVISORS AND DO NOT OFFER TRADING ADVICE.


