


| This week’s stock analysis is Hershey ($HSY) |
The Hershey Company is an iconic manufacturer of chocolate and snacks. They recently increased their dividend payment by a whopping 15% which is making investors take a second look at the company’s financials.
You see, when you find a company that consistently raises its dividend payout, you’re looking at a winner. It’s a surefire sign that the company is on a steady path of revenue and profit growth. And let me tell you, folks, that’s the kind of quality we should be looking for in our investments.
Hershey is not just about sweet treats anymore. They’ve been busy, busy, gobbling up companies like Dot’s Homestyle Pretzels and SkinnyPop popcorn. They’ve become a major player in the snacking category, securing the number two spot in the U.S.
And guess what? It’s paying off big time. In the second quarter, Hershey raked in a whopping $2.5 billion in net sales, a solid 5% increase from the previous year. Now, in these times of rising costs and inflation, most companies would be sweating bullets. But not Hershey. They raised their prices, and guess what? Net sales shot up by 7.7%. That’s how much people love those Hershey’s brands.
This multinational corporation has been tantalizing taste buds since 1894, and it’s not slowing down anytime soon.
Milton S. Hershey, the founder of The Hershey Company, didn’t just build a company; he built an entire town around it. Hershey, Pennsylvania, also known as “The Sweetest Place on Earth,” was developed as a model town for the employees of the Hershey Chocolate Factory. It includes Hersheypark, a chocolate-themed amusement park, and The Hotel Hershey, which are major attractions.
Their portfolio is a mouthwatering symphony of flavor. We’re talking about Hershey’s Chocolate Bars, Reese’s Peanut Butter Cups, those delightful Kisses, and a treasure trove of other candies. But hold on to your sweet tooth because Hershey doesn’t stop there – they also offer baking products, toppings, and even chocolate milkshakes. They’ve got your sugar cravings covered.

With approximately 16,000 employees working diligently, this company is a powerhouse in the confectionery world. Leading competitors are Mondelez International, Mars, Nestlé, Ferrero – these are just a few of the contenders, but Hershey, well, they’ve got the stamina and the legacy.
In the ever-evolving world of business, Hershey knows how to seize opportunities. As the global demand for sweets and snacks continues to rise, Hershey’s strong brand recognition and diverse product portfolio make them well-positioned for success. They’re not afraid to venture into emerging markets, innovate with new products, and cater to health-conscious consumers.
But it’s not all candy canes and gumdrops. Hershey faces its share of risks. Fluctuating commodity prices, shifting consumer preferences towards healthier options, and the unpredictable global economic climate are challenges they must navigate. Not to mention, the competition is fierce, and regulatory changes are always lurking on the horizon.
When it comes to revenue, Hershey’s Chocolate Bars have been their crown jewel. But as any savvy business knows, diversification is key. The company adapts to changing consumer tastes and marketing strategies, so that revenue mix can change over time.
On Wall Street, Hershey has earned a reputation as a dependable player in the consumer goods arena. Analysts appreciate their steady revenue growth and consistent dividend history. But, my friends, in the world of finance, nothing is ever certain. Hershey must keep a keen eye on shifting consumer trends and stay nimble in the face of competition from both old and new rivals. Now, let me tell you, Hershey isn’t just another company; they are a leader. With a firm grip on the confectionery industry, a sprawling product range, and iconic brands that resonate with us all, they’re at the front of the pack. Innovation is their middle name, and adapting to changing consumer preferences is in their DNA. They’re not just in the game; they’re leading it.
So, there you have it, a taste of Hershey Company’s rich history, sweet offerings, and the challenges they face in the ever-competitive world of confectionery. They’re not just a company; they’re a delicious American tradition, and they’re here to stay.
Now, let’s talk about earnings. Hershey logged $2.01 in the second quarter, up 11.7% from the year before. And they did it by keeping a tight lid on costs. That’s some smart financial management right there.
Here’s a summary of Hershey’s ($HSY) revenue over the last three years:
2022: Hershey’s annual revenue for 2022 was $10.419 billion, marking a significant increase of 16.14% from the previous year.
2021: The annual revenue for 2021 was $8.971 billion, which was a 10.08% increase from 2020.
2020: In 2020, Hershey reported a revenue of $8.15 billion, a modest increase of 2.05% from 2019.
They are on pace to easily beat 2022 revenue this year as well. Earnings for 2023 are expected to be roughly $9.10 where in 2022 they were $7.96.
But it doesn’t stop there. Hershey’s got big plans. New products, small acquisitions, and favorable pricing are all in the cards. Analysts are predicting a juicy 9.3% annual growth in adjusted diluted EPS over the next five years. That’s better than the industry average.
And now, let’s talk dividends. Hershey’s dividend yield of 1.8% is nothing to scoff at, especially when the S&P 500 is offering a measly 1.56%. But what’s even more impressive is that Hershey has been increasing its dividend like nobody’s business. Since they resumed dividend growth after the Great Recession, it’s soared by a jaw-dropping 273%. That’s putting money where your mouth is, folks.
But here’s the kicker, Hershey’s not just handing out cash to shareholders recklessly. Their dividend payout ratio is set to be below 47% in 2023. That means they’re keeping enough capital to invest in growth, reduce debt, and buy back shares.
The next earnings call for Hershey’s is estimated to be on February 1, 2024.
In this weekly stock study, we will look at and analyze the following indicators and metrics as are our guidelines which dictate our behavior in deciding whether to buy, sell, or stand aside on a particular stock.
- Wall Street Analysts’ Estimates
- 52-week high and low boundaries
- Best Case – Worst Case Analysis and Takeaways
- Vantagepoint A.I. Forecast (Predictive Blue Line)
- Neural Network Forecast
- VantagePoint A.I. Daily Range Forecast
- Intermarket Analysis
- Our trading suggestion
We don’t base our trading decisions on things like earnings or fundamental cash flow valuations. However, we do look at them to better understand the financial landscape that a company is operating under.
Wall Street Analysts’ Estimates
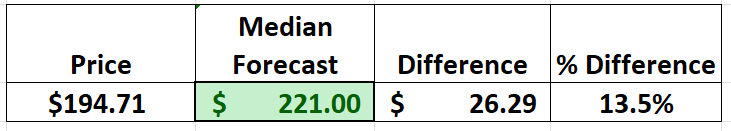
The 22 analysts offering 12-month price forecasts for Hershey Co have a median target of 221.00, with a high estimate of 250.00 and a low estimate of 180.00. The median estimate represents a +13.5% increase from the last price of 194.71.
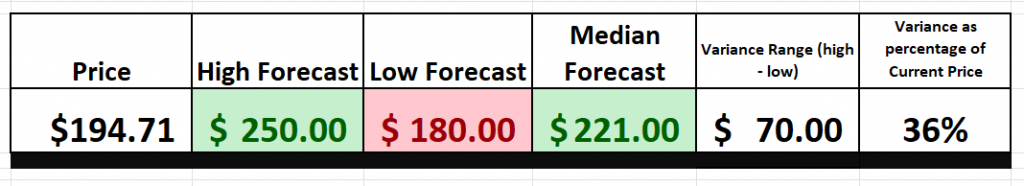
Our first area of focus is to look at the variance between the high forecast and the low forecast. This metric is the baked in volatility that we can expect moving forward. Next, we can observe that the low forecast is $180. With the stock trading at $194.71 we are relatively close, roughly 7.5% to the 52-week low on the stock.
Lastly, we look at how far we are from the median price forecast to create our first risk/reward profile.
52-Week High and Low Boundaries
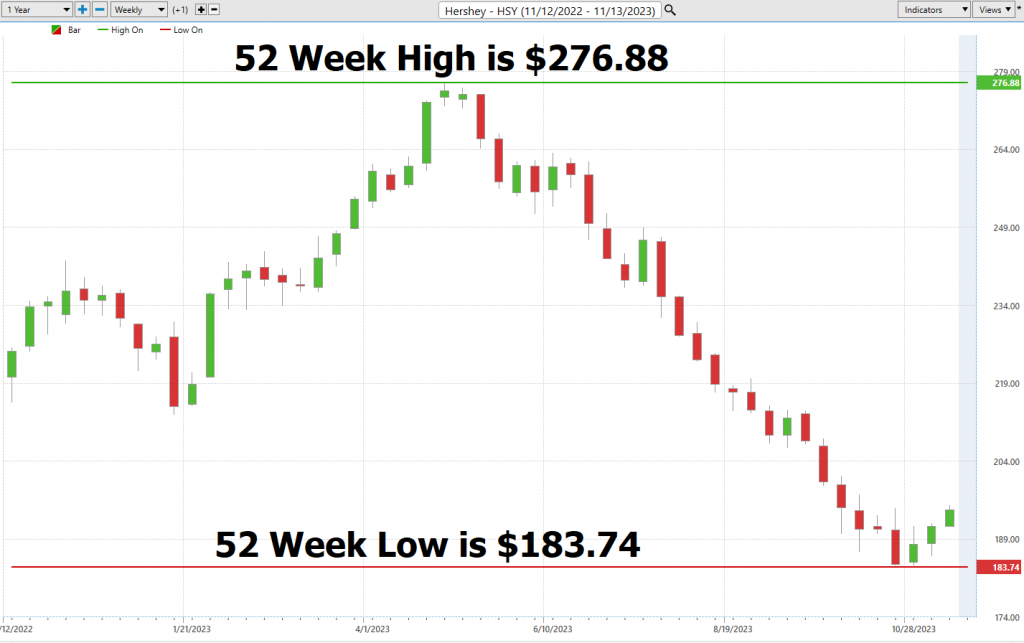
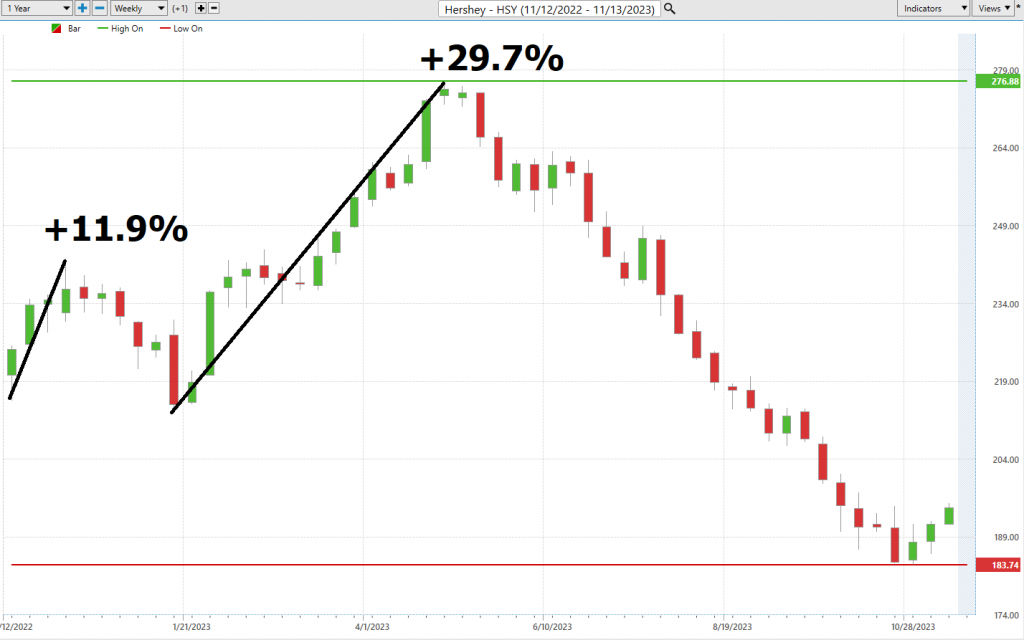
Now, let’s paint a picture here, a picture that’s worth more than a thousand words, a picture of the long-term chart of $HSY. Imagine this: over the past year, this stock has been on a journey, a journey that’s taken it as high as $276.88 and as low as $183.74. That’s a whopping annual trading range of $93.14. It’s like watching a high-stakes poker game, where the stakes are high, and the players are relentless.
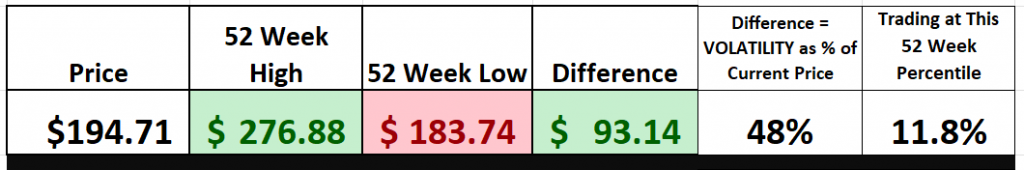
But wait, there’s more to this story. When we slice and dice this annual range with the precision of a master chef, we find ourselves staring at the annualized statistical volatility of $HSY, a number that stands at a staggering 48%. Now, what does this mean for you, the investor? It means that it’s completely within the realm of possibility to see $HSY swing 48% higher or lower over the next 12 months. It’s like a roller coaster ride, where the thrills and chills are part of the package.
But here’s where the plot thickens. As of now, $HSY is trading at its 11th percentile of the last 52 weeks. It’s like watching a seasoned athlete who’s been in a bit of a slump, but you know they’ve got the potential to bounce back. The chart tells a story of a pronounced downtrend over the past 3 months, a narrative that’s as compelling as it is cautionary.
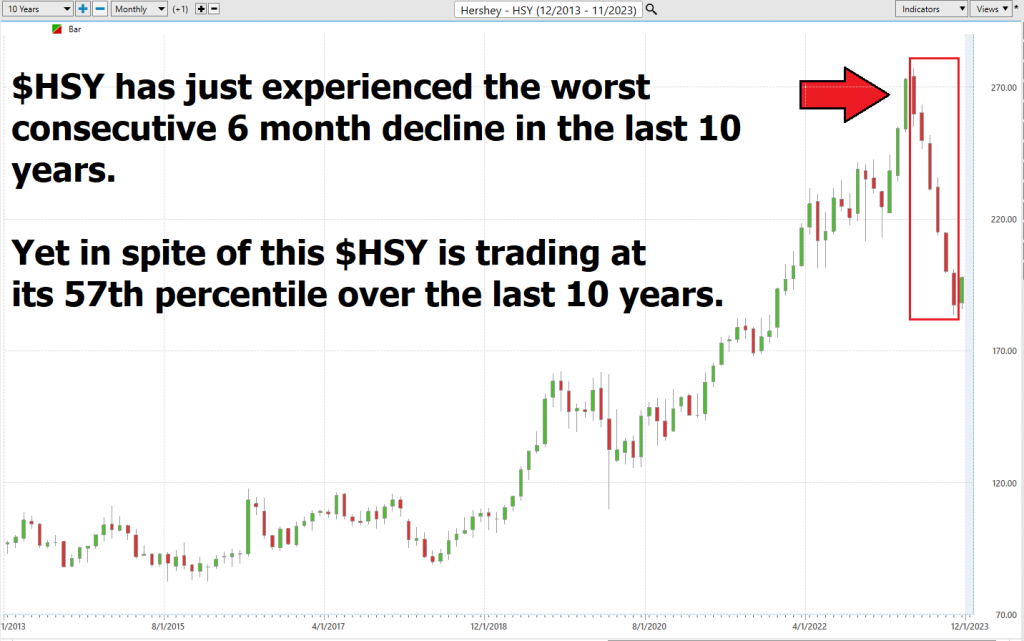
Now, let’s zoom out a bit and look at the bigger picture, the 10-year chart. What alarms me upon looking at the 10-year chart is recognizing that the last 6 months have seen the largest consecutive decrease in stock prices in its 10-year history.
$HSY is down 28% from its all-time high. That has all occurred in the last 6 months.
Yet, we see $HSY trading in the 57th percentile. What does this mean?
As a trader I would need and expect the recent 52-week low to hold. Should that occur, my worst-case scenario is for the stock to consolidate and gradually move higher.
Let’s unpack this, shall we? The essence of the story here isn’t just about numbers on a chart. It’s far more nuanced than that. The 52-week range, often glanced over by the casual observer, is in fact a critical indicator, a real-time pulse of market sentiment. It’s a nuanced tool, reflecting the collective mindset of Wall Street. When a stock approaches its 52-week high, it’s not just a number being hit; it’s a signal, a strong one at that, attracting bullish investors like a beacon. Conversely, when a stock is languishing near its 52-week low, it’s not merely a statistic. It’s a complex narrative, potentially signaling bearish trends or, for the astute investor/trader, an undervalued opportunity ripe for picking.
Now, let’s pivot to the case of $HSY. This isn’t just a story about a stock; it’s a microcosm of the stock market’s dynamic nature. The market, as we know, is an ever-evolving entity, a complex ecosystem that’s as intellectually stimulating as it is challenging. The trajectory of $HSY, in its highs and lows, serves as a vivid illustration of this. It’s a reminder to investors to stay alert, to keep their analytical acumen sharp, because in this market, opportunities and risks are often two sides of the same coin. So, what’s the takeaway here? It’s that the journey of $HSY, much like the stock market itself, is an ongoing narrative, one that demands our attention and respect. It’s a reminder that in the world of investing, success often lies in understanding the deeper stories
behind the numbers. And as we continue to navigate this terrain, it’s crucial to stay informed, stay engaged, and perhaps, just perhaps, you’ll be able to ride the wave of success in what is undeniably a grand, albeit complex, adventure in the stock market. Keep watching this space because this story, like the market itself, is continuously unfolding.
The seasonal tendency of Hershey is normally quite positive between now and Valentine’s Day in Mid-February. Based upon past history our expectations are for $HSY to consolidate and gradually move higher.
Best Case – Worst Case Scenario
In the intricate world of trading, stepping into the market is akin to navigating a complex labyrinth, one that demands not just courage but a deep understanding of the financial landscape. It’s a realm where strategy is not just an option, but a necessity, much like a chess grandmaster contemplating their next move. In this environment, one of the most insightful tools at our disposal is what I’d describe as a “best-case and worst-case analysis.” Imagine this as looking through two different lenses, each offering a distinct perspective on the same financial landscape.
Now, let’s delve into why this approach is not just useful, but essential. By examining both the optimistic, clear-sky scenarios and the more challenging, storm-laden ones, you’re essentially arming yourself with a panoramic view of a stock’s potential. This isn’t just about optimistic projections or potential gains; it’s equally about understanding and preparing for potential risks and downturns. This dual perspective is crucial in grasping the true volatility of an asset, serving as a navigational tool through the often-turbulent waters of the stock market.
This method of analysis is more than just a tactical approach; it’s a strategic way of thinking. It allows you to measure and manage your exposure, to make informed decisions about when to stay the course and when to pivot. It’s about a deep evaluation of a stock’s intrinsic value, beyond the surface-level allure.
In the broader context, this approach transcends being a mere technique. It’s a philosophy, a fundamental principle in the world of trading. It’s about balancing the scales of risk and reward, ensuring that your portfolio is not just a collection of speculative bets but a well-thought-out strategy for long-term financial resilience. The ultimate goal? To juxtapose a stock’s potential highs against its lows, not just to ride out the market’s fluctuations, but to master them.
Remember, in the intricate dance of trading, knowledge is more than power – it’s your guiding star to financial success. Before entering any trade, it’s imperative to weigh the risk against the reward. The most straightforward way to do this? Look at the past 52 weeks and measure the best trough-to-peak rallies against the worst uninterrupted declines. This approach doesn’t just prepare you for the journey; it charts the course.
First, we do the Best-Case analysis:
Followed by the WORST-CASE Analysis:
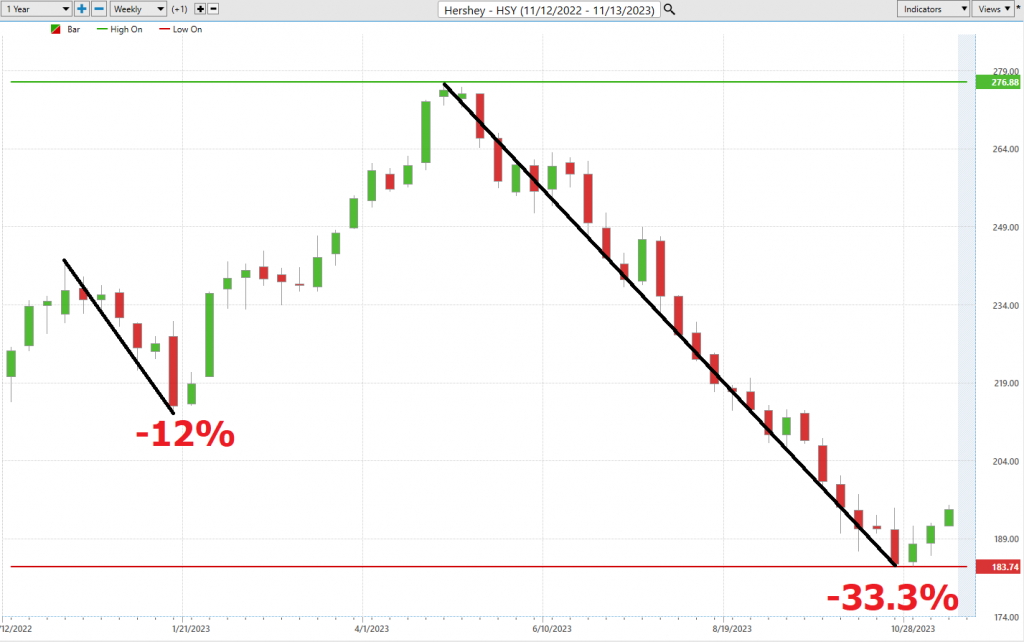
This initial analysis lets us see how quickly $HSY falls in comparison to its rallies.
Next, we want to compare the performance of $HSY to the major broad market indexes.
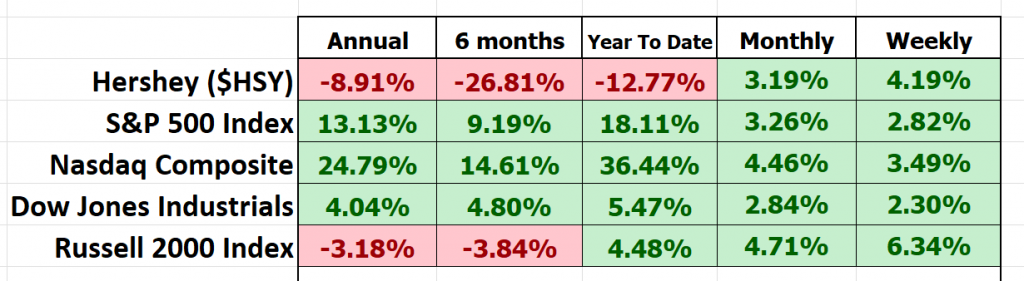
Hershey has clearly underperformed the broader stock market indexes across the board.
This history warrants closer examination, especially concerning its volatility and its comparison with market heavyweights. In the realm of finance, this is often encapsulated by a metric known as “BETA.”
In the dynamic world of stocks, beta (β) is like our financial seismograph, giving us a clear read on how a stock moves in tandem with the broader market’s swings and roundabouts, typically against a benchmark like the S&P 500. Think of beta as the measure of a stock’s dance steps coordinated with the market’s rhythm.
Let’s dive into the intricacies of beta, a pivotal tool for understanding a stock’s tango with the market. Here’s the lowdown:
– **Beta = 1:** Picture a stock with a beta of 1 as the market’s shadow. It mirrors the market’s moves step for step. If the market jumps 5%, a stock with a beta of 1 is right there with it, also jumping 5%.
– **Beta > 1:** Now, this is where the market’s dance gets more intense. A beta above 1, say 1.5, means the stock is 50% more volatile than the market. It’s like a market rally on steroids. If the market goes up 5%, a high-beta stock might leap an exhilarating 7.5% – or take a steeper dive.
– **Beta < 1:** Here, we find the market’s calm waltz. A beta below 1, like 0.5, indicates the stock is only half as volatile as the market. In a 5% market uptick, this stock would have a more composed 2.5% rise.
Now, let’s put this into context with $HSY. Over a 5-year span, $HSY has shown a beta of 0.57. Remember, beta is based on past data and isn’t a crystal ball for future performance. A high beta doesn’t automatically mean high returns; it highlights a stock’s potential for bigger price swings, signaling more risk. The intriguing part about Hershey’s ($HSY) is its performance story – it’s been significantly less volatile than the broader market, with a beta 43% lower than the S&P 500. This could be a signal of stability, but it also raises questions about its ability to keep pace with the broader market’s gains.
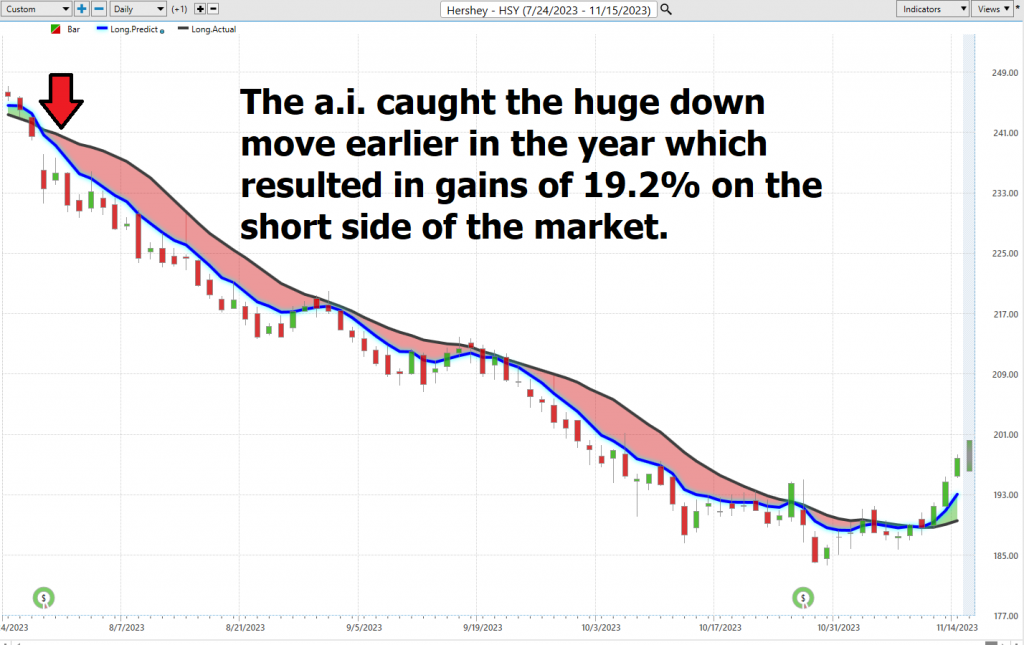
Vantagepoint A.I. Predictive Blue Line Forecast
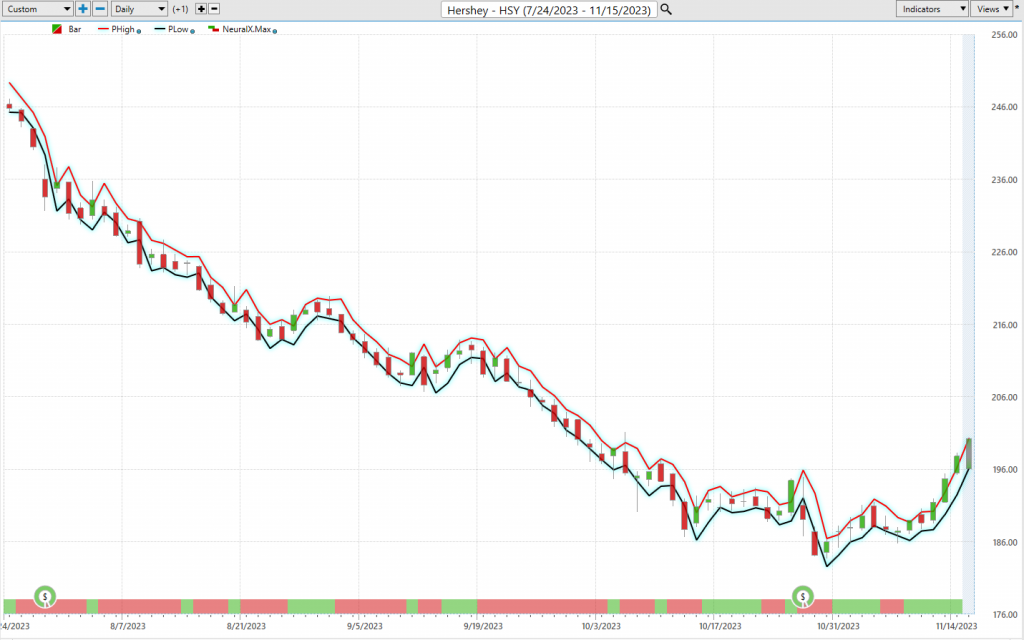
On the following chart you will see the power of the VantagePoint Predictive blue line which determines the medium-term trend price forecast.
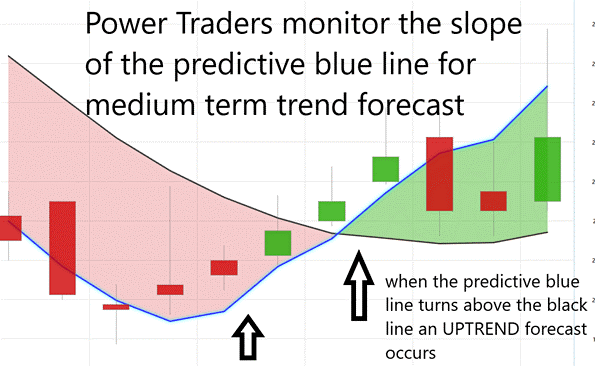
In the intricate tapestry of the financial markets, where every detail can be a harbinger of a new trend, there exists a set of guidelines, almost like a navigational chart for traders. These guidelines are not just lines on a graph; they are the compass by which savvy investors steer their course. Let’s delve into these guiding principles:
- The first principle revolves around the predictive blue line. This isn’t just any line on a chart; it’s a forecast, a predictor of the general direction of $HSY. Think of it as the market’s own crystal ball, giving us a glimpse into the future trajectory of the stock.
- Then there’s the concept of the VALUE ZONE. This is where the art of trading transforms into a strategic game. The goal here is to identify buying opportunities at or below this predictive blue line or to pinpoint selling opportunities above it during a downtrend. It’s akin to finding the sweet spot, the point where everything aligns perfectly.
Now, let’s shift our focus to the technology powering this predictive prowess: VantagePoint A.I. Software. This isn’t just a tool; it’s a revolution in market analysis, a fusion of artificial intelligence, neural networks, and intermarket analysis. Imagine having a financial oracle at your disposal, offering you a sneak peek into the market’s future movements.
But let’s not overlook the black line, a seemingly simple yet crucial element. This line, representing a 10-day moving average of prices, acts as our historical compass, offering insights into the market’s recent past.
The crux of this strategy lies in the predictive blue line. This line is the epicenter of value, a beacon for traders in an uptrend to acquire assets at or just below this crucial threshold. The secret behind this line’s accuracy? It’s all thanks to VantagePoint’s groundbreaking technology, which leverages the full might of AI and data correlations to decode the market’s language.
As we analyze the chart, we see the interplay between the black line and the predictive blue line, a dance of data and prediction. This blue line is not a product of mere speculation; it’s the culmination of VantagePoint’s advanced neural network and intermarket analysis, dissecting the myriad factors influencing a stock’s price.
Over the past three and a half months, we’ve witnessed two distinct trend forecasts, each telling its own story about the market’s direction.
And here’s a crucial piece of wisdom for traders: when the predictive blue line ascends above the black line, it’s like the market is waving a green flag, signaling a prime entry point during an upward trend. So, keep your eyes peeled, stay informed, and most importantly, stay ahead in this ever-changing financial landscape.
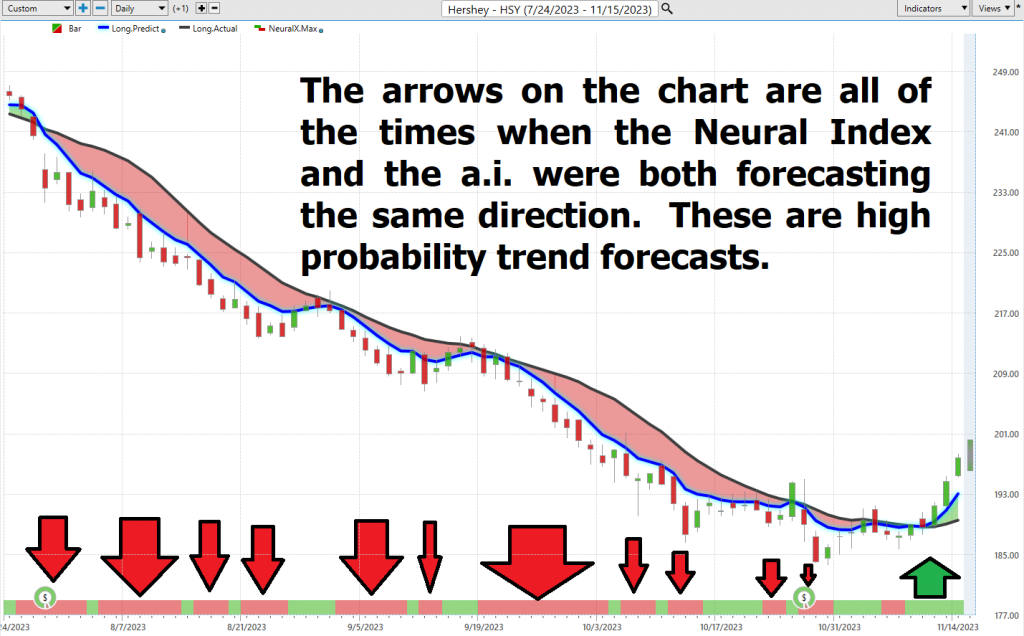
Neural Network Indicator (Machine Learning)
In the fast-paced world of trading, at the heart of our analysis lies a key indicator: the Neural Network Indicator. Picture this as your high-octane, short-term forecasting ally, a tool that’s constantly pulsing with the market’s heartbeat. When this Neural Net Indicator lights up in green, it’s like a signal flare of market strength, a clear indication of bullish momentum. But when it flashes red, it’s a siren call, warning us of potential short-term market dips. And when it’s yellow? That’s our queue to brace for sideways market movements, a period of uncertainty and caution.
The beauty of the Neural Index is that it permits traders to focus on entries and exits of a much shorter duration.
So, what exactly is this Neural Net? Imagine having a supercomputer for a brain in your trading arsenal, equipped with the latest in artificial intelligence. This isn’t just any tool; it’s a powerhouse of data analysis, tirelessly sifting through mountains of market information to deliver pinpoint predictions. It’s like having a market whisperer that can connect the dots across diverse market dynamics, from intricate technical indicators to global economic shifts, all at lightning speed.
For us, the Power Traders, it’s all about confirmation. Our eyes are glued to both the predictive blue line and the Neural Network Indicator. When these two align, it’s like the stars aligning in the trading universe – a clear, unmistakable signal. But when they signal caution, we pause, step back, and reassess our strategy.
Neural Networks represent the forefront of trading technology, offering insights that traditional methods can’t even fathom. For those of us in the Power Trading community, having the combined force of Neural Network analysis and AI forecasting is like sailing with the wind in our sails. When they’re coordinated, we see a green light for action. But when they diverge, it’s our queue to proceed with caution. In our world, double-checking is not just a practice; it’s the cornerstone of our trading philosophy.
We advise Power Traders to constantly cross-reference the chart with both the predictive blue line and the Neural Network Indicator. This is how we pinpoint those prime entry and exit points. For the serious trader, neural networks are the next frontier, uncovering hidden, non-linear connections and patterns that escape traditional analysis. We rely on Neural Net for that final confirmation, whether to take a long or short position. In simpler terms, if both the A.I. forecast and the Neural Net are flashing green, that’s our cue to buy.
As Power Traders, we’re always vigilant, keeping an eye on both the Neural Network and AI forecasts, always on the hunt for statistically solid trading opportunities. It’s about staying one step ahead in the game.
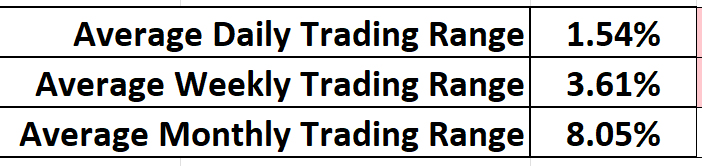
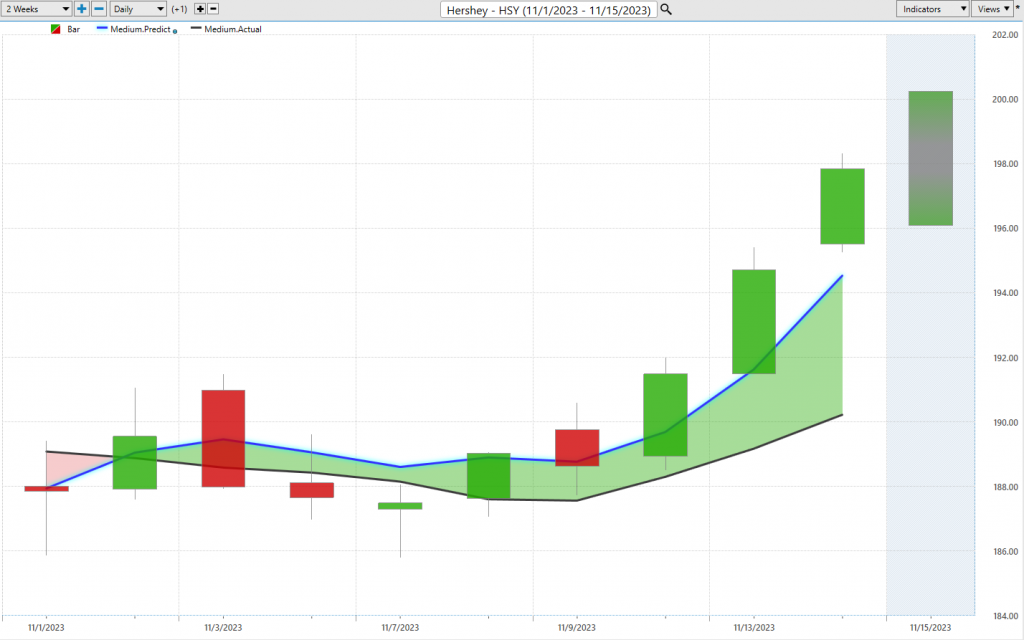
Daily Range Forecast & Analysis
For those elite Power Traders who’ve placed their trust in VantagePoint Software, there’s a beacon they rely on day in and day out: the VantagePoint Daily Price Range forecast. It’s become their guiding star amidst the often-tumultuous seas of market price action.
Now, let’s delve into the nitty-gritty of the average trading range metrics for $HSY over the past year, covering daily, weekly, and monthly intervals.
Every trader, my friends, grapples with a profound daily challenge – when precisely to make their move in the market. But with the power of VantagePoint’s A.I. and the Daily Price Range Forecast, it’s like having a market sage quietly whispering invaluable advice in your ear.
Just imagine this for a moment, add the VantagePoint A.I.’s daily range forecast into the mix. Picture having a subtle nudge, a gentle hint, predicting the market’s next step. By seizing opportunities at the lower end of the forecast and planning your exits at its peak, traders can potentially tip the odds in their favor while keeping a tight grip on risk.
But here’s the kicker, folks: the daily valuation of the stock market isn’t solely driven by corporate moves or financial reports. It can swing wildly due to factors as diverse as a fleeting tweet or global upheavals. So, predicting these market gyrations? It’s an intricate art, indeed. Yet, VantagePoint A.I. seems to have mastered it, seamlessly blending A.I., neural genius, and machine learning in the pursuit of the perfect prediction.
Successful trading, my friends, boils down to pinpointing that perfect timing for market entry and exit. VantagePoint doesn’t just help identify that pivotal moment; it achieves it with astounding precision. The Daily Range forecast is updated daily, offering a window into potential price paths. It’s like having a seasoned market guru sharing time-tested insights.
Now, feast your eyes on that chart. It’s more than just pretty lines; it’s a roadmap for strategic stop placements and risk management. Notice how rarely prices dip below that prominent established range? It’s a clear signal, indicating the optimal zone for setting buy stops, ensuring that risks are finely tuned.
$HSY presents ample opportunities, but for traders who are not versed in managing volatility, it can be a risky asset to navigate. So, heed the wisdom of VantagePoint and navigate these waters with confidence.
Intermarket Analysis
In the world of trading and investments, the name of the game is our response to the undeniable truths we uncover. Consider the financial landscape as an intricate jigsaw puzzle, and our role is to decipher the intricate web of factors driving the prices of assets such as stocks, oil, and currencies. But let’s not allow ourselves to be swayed by the sensational narratives in the headlines; those are merely the captivating plot twists in our financial saga.
To get to the crux of the matter, we must don our detective hats and wield a formidable tool known as “intermarket analysis.” Think of it as embarking on a quest for clues scattered across various corners to unravel the grand mystery. You see, our world is a complex tapestry where all threads are intertwined. Intermarket analysis is the discerning trader’s way of dissecting the interconnections between disparate elements, including stocks, oil, and currency values. This astute approach empowers them to anticipate potential price movements and make more sagacious decisions.
Envision this scenario: you possess an array of strings, and when you pull on one, the others respond in kind. That’s the essence of intermarket analysis. By comprehending how these strings are interconnected, you can formulate predictions and fine-tune your strategies to optimize your profits.
In plain terms, intermarket analysis serves as the tool that unravels the mysteries behind price fluctuations and illuminates how different facets of the financial world are intertwined, akin to the pieces of a complex puzzle. It’s akin to becoming a financial detective, equipping you to make more enlightened choices in the arena of trading and investing.
True power, dear friends, resides in our response to the undeniable truths we unearth. In the world of trading, it’s insufficient to be ensnared by headlines or entranced by stories in the financial news. We must delve deeper, gaining a profound understanding of what genuinely propels asset prices in this global marketplace.
And that’s precisely where intermarket analysis enters the picture. It delves into the interconnectedness of various elements in the world of finance, such as stocks, oil, and currencies. You see, every facet of finance is interconnected, and grasping these connections can be a game-changer.
Consider it like this: if you know that when one domino falls, it sets off a chain reaction, you can anticipate the domino effect. That’s precisely what intermarket analysis accomplishes. It enables us to discern the bigger picture, how changes in one market can ripple through others, and how global events can profoundly impact our investments.
Don’t be swayed by fear-inducing pundits in the media. Base your decisions on facts, on a deep understanding of these connections. Intermarket analysis isn’t just a tool; it’s your clandestine weapon to remain at the forefront in this ever-evolving financial landscape. Remember, the choice is yours – follow the noise, or follow the facts.
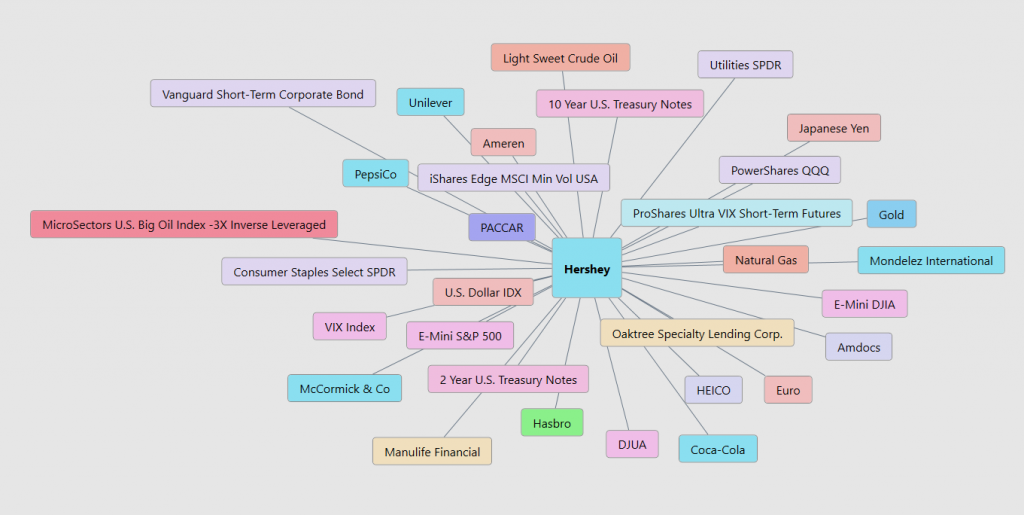
Now, let’s turn our attention to this remarkable Intermarket Analysis graphic, my friends. It unveils the 31 markets that hold the key to deciphering $HSY’s price movements. There’s immense value in comprehending these driving forces. This graphic provides a microcosmic view of what has propelled $HSY’s ascent.
Our Suggestion
Traders, take note: $HSY deserves a prime spot on your trading opportunity radar for the upcoming year. Here’s a quick rundown of why:
In the world of trading, the age-old mantra “risk versus reward” isn’t just a catchphrase; it’s a guiding principle that every savvy trader lives by. Before embarking on any trade, whether it’s in stocks, commodities, or currencies, a critical step is assessing the risk versus the potential reward. It’s akin to performing a meticulous cost-benefit analysis for each transaction. This practice is not just about profit maximization but also about safeguarding your capital in the face of market volatility.
Before executing a trade, one must diligently consider the worst-case scenario and the mildest upside projection. This is a fundamental aspect of risk management. Knowing precisely what you stand to lose and what you can potentially gain allows you to make informed decisions. In the context of $HSY’s recent sharp bounce from 52-week lows, the importance of support levels becomes crystal clear. These levels function as a safety net for traders, setting a floor beyond which prices are less likely to fall. In this case, the support level, nearly equal to the most bearish Wall Street Analysts’ forecast for the coming 12 months, serves as a crucial reference point.
In trading, where precision matters, managing risk is paramount. In the case of $HSY, where the risk stands at approximately $14, it’s prudent to seek a reward that is at least twice that amount. This risk-reward ratio not only helps protect your capital but also ensures that your trades have a higher probability of being profitable overall. So, remember, in the dynamic world of trading, success often hinges on your ability to assess and strike the right balance between risk and reward before making each and every trade. We think the probability that price will revert to the mean and that within a few months $HSY will be trading near its median forecast of $221. We are looking for opportunities to buy weakness moving forward and anticipating that the 52-week lows at $183.74 hold.
Our recommendation is to follow the A.I. trend analysis as outlined in this stock study and practice good money management on all trades.
We will re-evaluate daily based upon:
- New Wall Street Analysts’ Estimates
- New 52-week high and low boundaries
- Vantagepoint A.I. Forecast (Predictive Blue Line)
- Neural Network Forecast
- Daily Range Forecast
The trend in $HSY is UP. We will look to the bottom of the daily range forecast to position ourselves LONG with tight stops for short-term trades.
Let’s Be Careful Out There!
It’s Not Magic.
It’s Machine Learning.
Disclaimer: THERE IS A HIGH DEGREE OF RISK INVOLVED IN TRADING. IT IS NOT PRUDENT OR ADVISABLE TO MAKE TRADING DECISIONS THAT ARE BEYOND YOUR FINANCIAL MEANS OR INVOLVE TRADING CAPITAL THAT YOU ARE NOT WILLING AND CAPABLE OF LOSING.
VANTAGEPOINT’S MARKETING CAMPAIGNS, OF ANY KIND, DO NOT CONSTITUTE TRADING ADVICE OR AN ENDORSEMENT OR RECOMMENDATION BY VANTAGEPOINT AI OR ANY ASSOCIATED AFFILIATES OF ANY TRADING METHODS, PROGRAMS, SYSTEMS OR ROUTINES. VANTAGEPOINT’S PERSONNEL ARE NOT LICENSED BROKERS OR ADVISORS AND DO NOT OFFER TRADING ADVICE.


