


This week’s AI stock spotlight is Humana ($HUM)
Humana has spent more than six decades quietly transforming itself into one of the most important companies in American healthcare. Founded in 1961 as a nursing home operator, the company eventually recognized that managing healthcare could become an even larger business than providing it. Over the years it sold its hospital operations, expanded aggressively into health insurance, and steadily built one of the nation’s largest Medicare Advantage franchises. Today, Humana generates well over $100 billion in annual revenue, serves millions of members, employs approximately 67,000 people, and remains one of the country’s largest managed-care organizations. It also remains one of Wall Street’s favorite policy-driven stocks because whenever Washington changes Medicare reimbursement rules, Humana’s earnings outlook can change overnight. The stock often reacts like a cat that just discovered cucumbers, which is precisely why traders continue to watch it so closely.
Healthcare is one of the few businesses where nearly everyone complains about the product while continuing to buy it. That makes it remarkably durable. Humana sits squarely in the middle of that machine. Traders are not buying the stock because they enjoy reading insurance contracts. They buy it because Medicare demographics, government reimbursement rates, and medical utilization create enormous swings in earnings expectations. Those swings create opportunity.
Humana is, first and foremost, a Medicare Advantage company. That is the economic engine. Millions of seniors choose Humana to manage their healthcare benefits, and the federal government reimburses the company for providing those services. Every new member adds recurring premium revenue. Every unexpected surgery, expensive cancer treatment, or surge in hospital admissions chips away at profit margins.
The company operates through two primary businesses. Insurance accounts for the overwhelming majority of revenue through Medicare Advantage, Medicare prescription drug plans, Medicaid contracts, and supplemental insurance products. The second business is CenterWell, which includes primary care clinics, home health services, pharmacy operations, and post-acute care management. The long-term strategy is straightforward. Instead of simply paying healthcare bills, Humana increasingly wants to participate in more of the patient’s healthcare journey, giving the company greater control over both patient outcomes and medical costs.
Headquartered in Louisville, Kentucky, Humana is led by CEO Jim Rechtin and employs roughly 67,000 people. Its largest competitors include UnitedHealth Group, CVS Health, Elevance Health, and Cigna. Humana’s greatest competitive strength has always been its deep specialization in Medicare Advantage. Ironically, that is also its greatest vulnerability. When Medicare reimbursement formulas change, diversification suddenly becomes a very attractive idea.
Financially, Humana is healthier than many investors assume, although not quite as healthy as the stock chart occasionally suggests. Revenue has continued climbing at an impressive pace for years, demonstrating that demand for its products remains exceptionally strong. The challenge has been profitability. Medical costs have risen faster than insurers expected, compressing margins across much of the managed-care industry. Healthcare inflation has become the unwanted houseguest that refuses to leave.
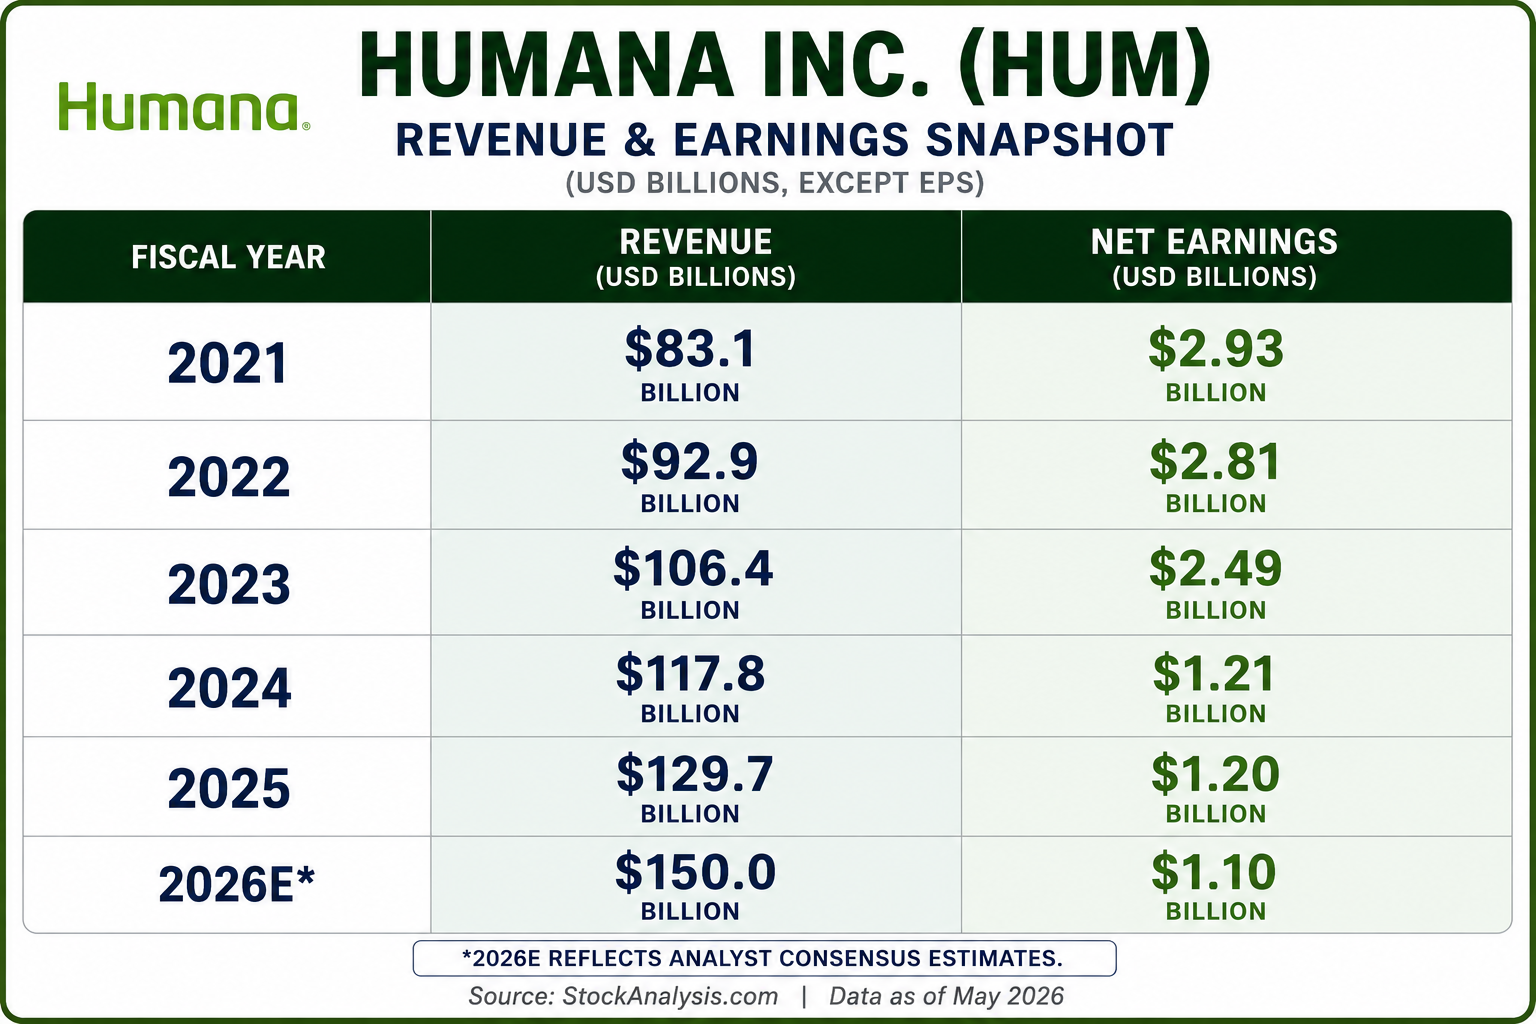
The revenue and earnings table tells one of the most important stories traders can find in a company’s financial statements. Revenue has increased every single year, climbing from just over $83 billion in 2021 to nearly $130 billion in 2025, with analysts expecting revenue to approach $150 billion in 2026. Customers continue enrolling, premium revenue continues growing, and the business itself continues expanding. From a demand perspective, Humana has very few problems.
The earnings column tells a completely different story. Net income has steadily declined from nearly $3 billion in 2021 to just over $1.2 billion in both 2024 and 2025 despite record revenue. That divergence is the result of rising medical utilization, higher healthcare costs, reimbursement pressure, and Medicare Advantage Star Rating headwinds that have squeezed margins. In other words, Humana has become exceptionally good at generating sales while simultaneously finding it much harder to convert those sales into profits.
For traders, that disconnect matters enormously because stocks ultimately follow earnings far more than revenue. Revenue growth proves demand remains healthy. Earnings growth proves management is successfully controlling costs. Right now, Humana has clearly won the first battle but is still fighting the second. The investment thesis over the next twelve to eighteen months is not whether revenue continues growing. It almost certainly will. The real question is whether management can rebuild margins and allow earnings to begin catching up with the remarkable growth in revenue. If that happens, the stock could have considerably more room to run.
The balance sheet remains solid enough to support operations. Humana finished 2025 with approximately $4.2 billion in cash against roughly $12.4 billion in long-term debt. Those figures are manageable for a company producing nearly $130 billion in annual revenue. Capital expenditures remain relatively modest because Humana is an insurance company rather than a manufacturer building billion-dollar factories. Its real capital allocation challenge is pricing insurance risk accurately before someone needs a very expensive knee replacement or heart surgery.
Three questions continue to dominate trader conversations. The first is whether Medicare Advantage margins can recover. That is the entire investment thesis. Management continues targeting approximately a 3% Medicare Advantage margin over the next several years, but investors want measurable progress rather than optimistic conference call commentary.
The second question is whether medical costs have finally begun stabilizing. Elevated utilization has pressured profitability throughout the industry. If healthcare claims normalize, earnings could recover much faster than current analyst expectations.
The third question is whether Wall Street became excessively pessimistic. After spending nearly two years punishing the stock over reimbursement concerns and declining Star Ratings, investors are now asking whether expectations simply became too low. Sometimes a stock does not need spectacular news to rally. It merely needs reality to turn out better than feared.
Recent headlines have reinforced exactly that narrative. First-quarter 2026 results modestly exceeded expectations, Medicare Advantage membership growth remains healthy, and management reaffirmed its longer-term recovery strategy despite acknowledging continued Star Rating challenges.
What is genuinely new is improving operational execution. What appears largely priced into the stock is weaker earnings caused by previous reimbursement issues. Where Wall Street may still be underestimating the business is the speed at which margins could recover if medical utilization moderates. Conversely, investors may also be underestimating how stubborn healthcare inflation can become if utilization remains elevated.
Humana’s impressive rally over the past ninety days has reflected a significant improvement in investor confidence. The market has increasingly concluded that the worst-case scenario probably will not occur.
That distinction matters because the rally has not been fueled by exploding earnings. It has been fueled by improving expectations. Markets almost always move ahead of financial statements.
Year-to-date, the stock has benefited from stronger-than-expected execution, stabilizing membership trends, renewed institutional buying, and growing confidence that management can navigate through one of the industry’s most difficult reimbursement environments. Many analysts support that improving outlook, although consensus estimates still assume only a gradual recovery in profitability. History suggests analysts frequently underestimate how quickly investor sentiment improves once margins begin expanding again. They also have a remarkable tendency to become enthusiastic only after much of the rally has already occurred.
The opportunity remains relatively straightforward. If Medicare Advantage margins recover faster than expected, earnings could surprise meaningfully over the next several years. CenterWell continues expanding, America’s aging population remains one of the strongest demographic trends in the country, and every year millions of additional Americans become eligible for Medicare.
The risks are equally straightforward. Government reimbursement changes, rising medical utilization, unfavorable Medicare Star Ratings, regulatory changes, or unexpectedly high healthcare claims could once again pressure profitability.
The biggest upside surprise would be a faster-than-expected normalization of medical costs combined with accelerating Medicare enrollment.
The biggest blind spot is assuming that rapidly growing revenue automatically leads to rapidly growing earnings. Insurance companies are ultimately judged by what they keep, not by what they collect.
Three catalysts deserve traders’ attention over the coming months. The first is the July 29, 2026 second-quarter earnings report, where investors will be looking closely for additional evidence that margins continue recovering. The second arrives during the autumn Medicare Advantage enrollment season, which provides one of the earliest indications of future membership growth and premium revenue. Finally, traders should closely monitor CMS reimbursement announcements and Medicare Star Rating updates because both have a direct impact on future profitability and valuation.
Humana is best suited for traders who appreciate improving trends but remain disciplined enough to respect policy risk. This is not a momentum stock driven by excitement or speculation. It is a turnaround story driven by improving fundamentals and gradually improving expectations.
For the rally to continue, medical costs must stabilize, Medicare Advantage membership must remain healthy, and management must demonstrate that profit margins are genuinely recovering rather than merely surviving.
The earliest warning sign would be simple. If revenue continues climbing while earnings begin falling again because medical costs accelerate, the market will quickly lose patience. Wall Street forgives almost everything except shrinking profits. Unlike politicians, markets have an inconvenient habit of keeping score.
The following are the indicators and forecasts that we will use in this stock study to better comprehend the price action of $HUM.
Wall Street Analysts Ratings and Forecasts
52-Week High and Low Boundaries
Best-Case / Worst-Case Scenario Analysis
VantagePoint AI Predictive Blue Line
Neural Network Forecast (Machine Learning)
VantagePoint AI Daily Range Forecast
Intermarket Analysis
Our Suggestion
At VantagePoint, AI informs our decisions. We evaluate the quality of the business as carefully as the quality of the chart. When strong fundamentals and improving momentum point in the same direction, the odds begin to favor disciplined traders.
Wall Street Analysts Price Forecasts
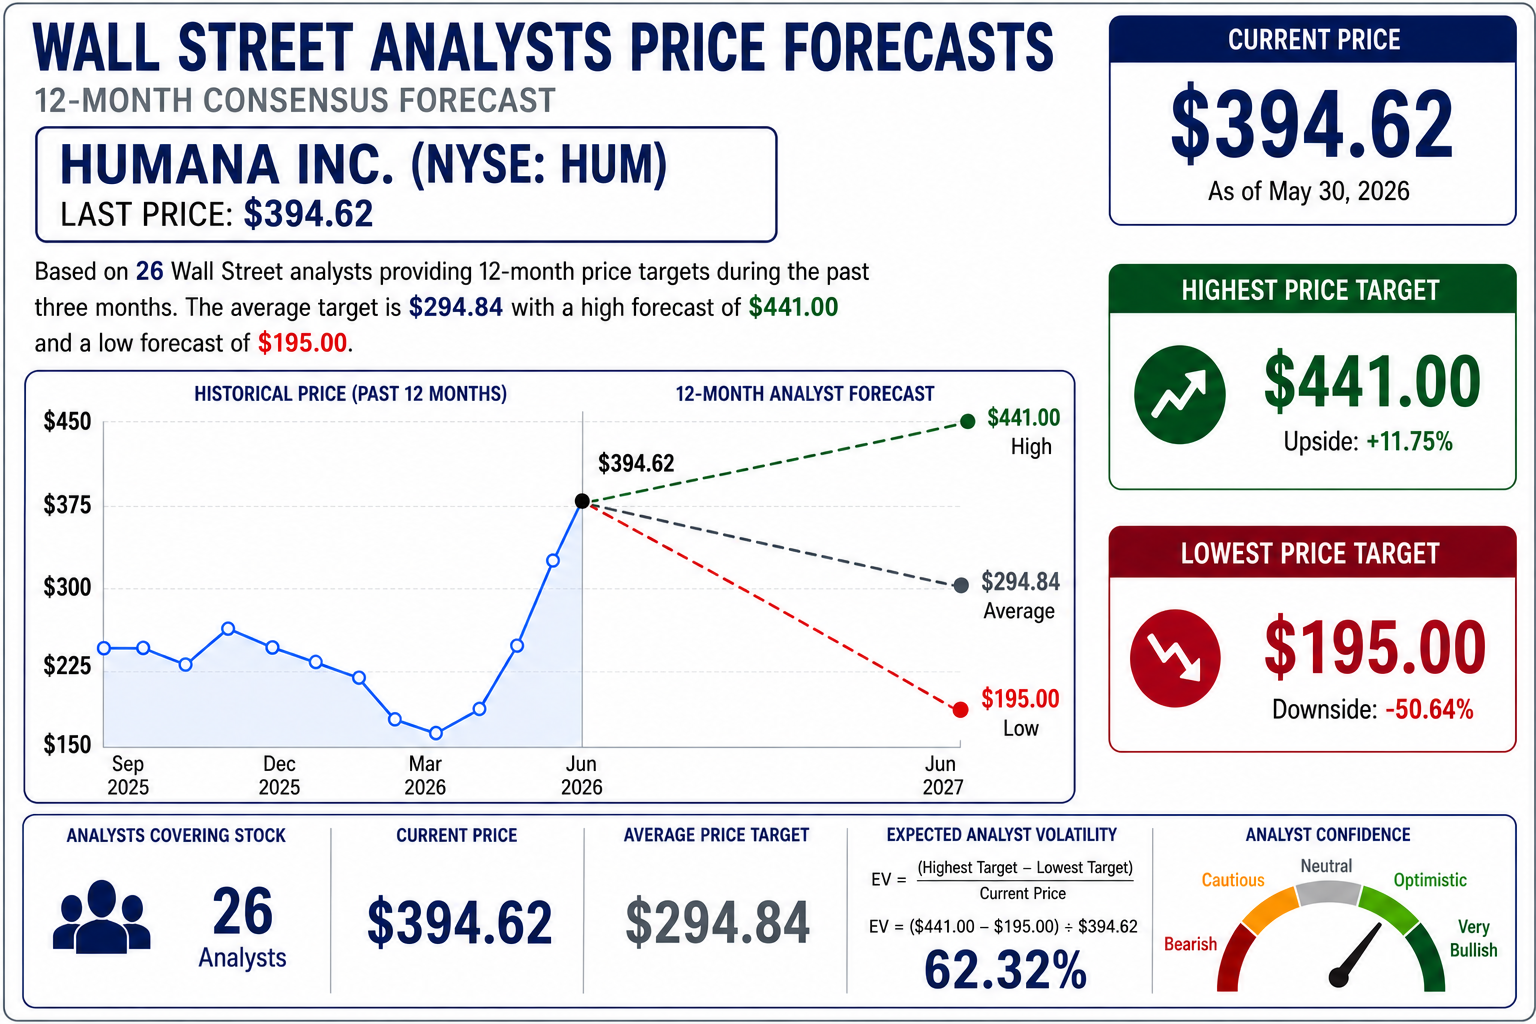
Wall Street is speaking with several different voices on Humana, and that alone is worth paying attention to. The most optimistic analyst believes the stock can reach $441.00 over the next twelve months, while the most pessimistic sees it falling to $195.00. That is a spread of $246.00, which translates into an expected analyst volatility of 62.32% when compared to today’s price of $394.62. Volatility is often an abstract idea, but this makes it tangible. Twenty-six Wall Street analysts follow this company every day. They study management, reimbursement trends, medical costs, and quarterly results. Yet after reviewing the same information, they still arrive at dramatically different conclusions about where the stock is headed. That kind of disagreement tells traders one thing above all else: uncertainty remains unusually high, and conviction across Wall Street is far from unanimous.
A 62.32% expected volatility reading suggests analysts see Humana as a stock capable of making meaningful moves rather than drifting quietly higher. The wider the gap between the highest and lowest price targets, the greater the disagreement about the company’s future, and that disagreement often translates into larger price swings when new information arrives. The current rally has already pushed the stock well above the consensus target of $294.84, indicating that the market has become considerably more optimistic than the average analyst forecast. In many cases, analysts are forced to revise their targets after the market has already begun moving, not before it. If Humana continues to execute well, improves Medicare Advantage margins, and demonstrates better control of medical costs, today’s consensus target may eventually move higher to catch up with the stock.
For traders, the opportunity lies in understanding that analyst targets are not predictions so much as expectations that evolve as new information becomes available. The highest target of $441.00 leaves room for additional upside if the company’s operational recovery continues, while the lowest target of $195.00 reminds investors that significant downside still exists should reimbursement pressure, rising medical utilization, or disappointing earnings return to the forefront. This setup continues to favor disciplined momentum traders who recognize that the primary trend remains higher but who also appreciate that expectations have become increasingly demanding. Mean reversion traders should exercise patience, as the stock already trades well above Wall Street’s average target. The key question is no longer whether Humana is improving. It is whether the business can improve enough to force analysts to raise their expectations once again. That answer will likely determine where the stock goes next.
52-Week High and Low Boundaries
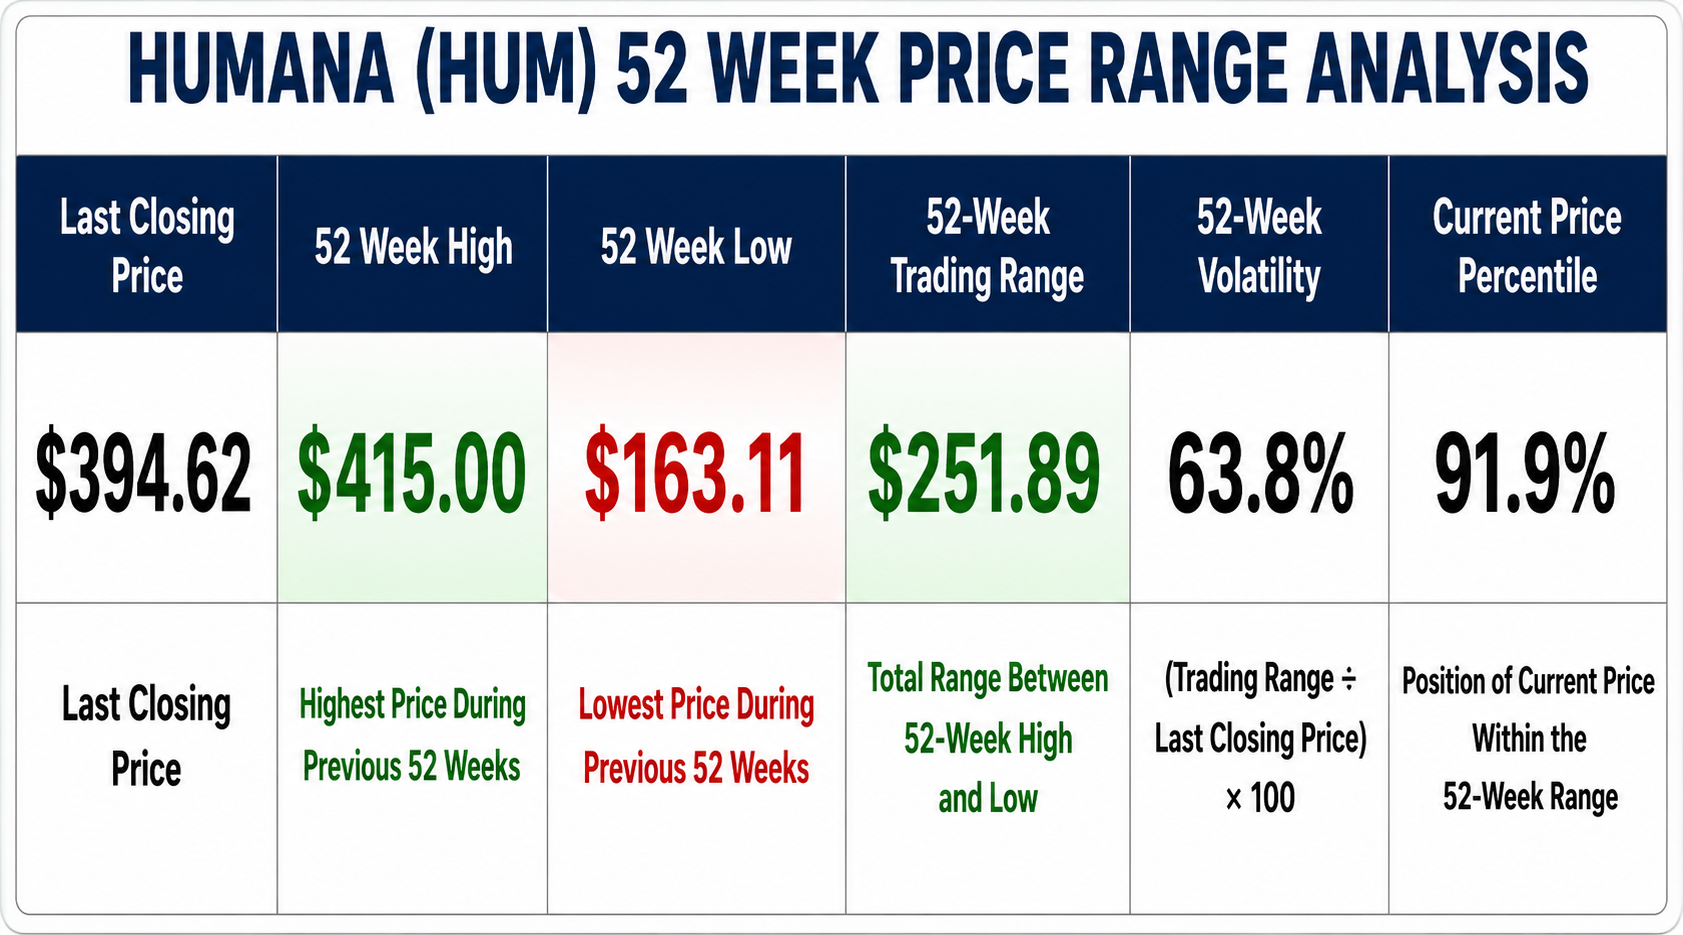
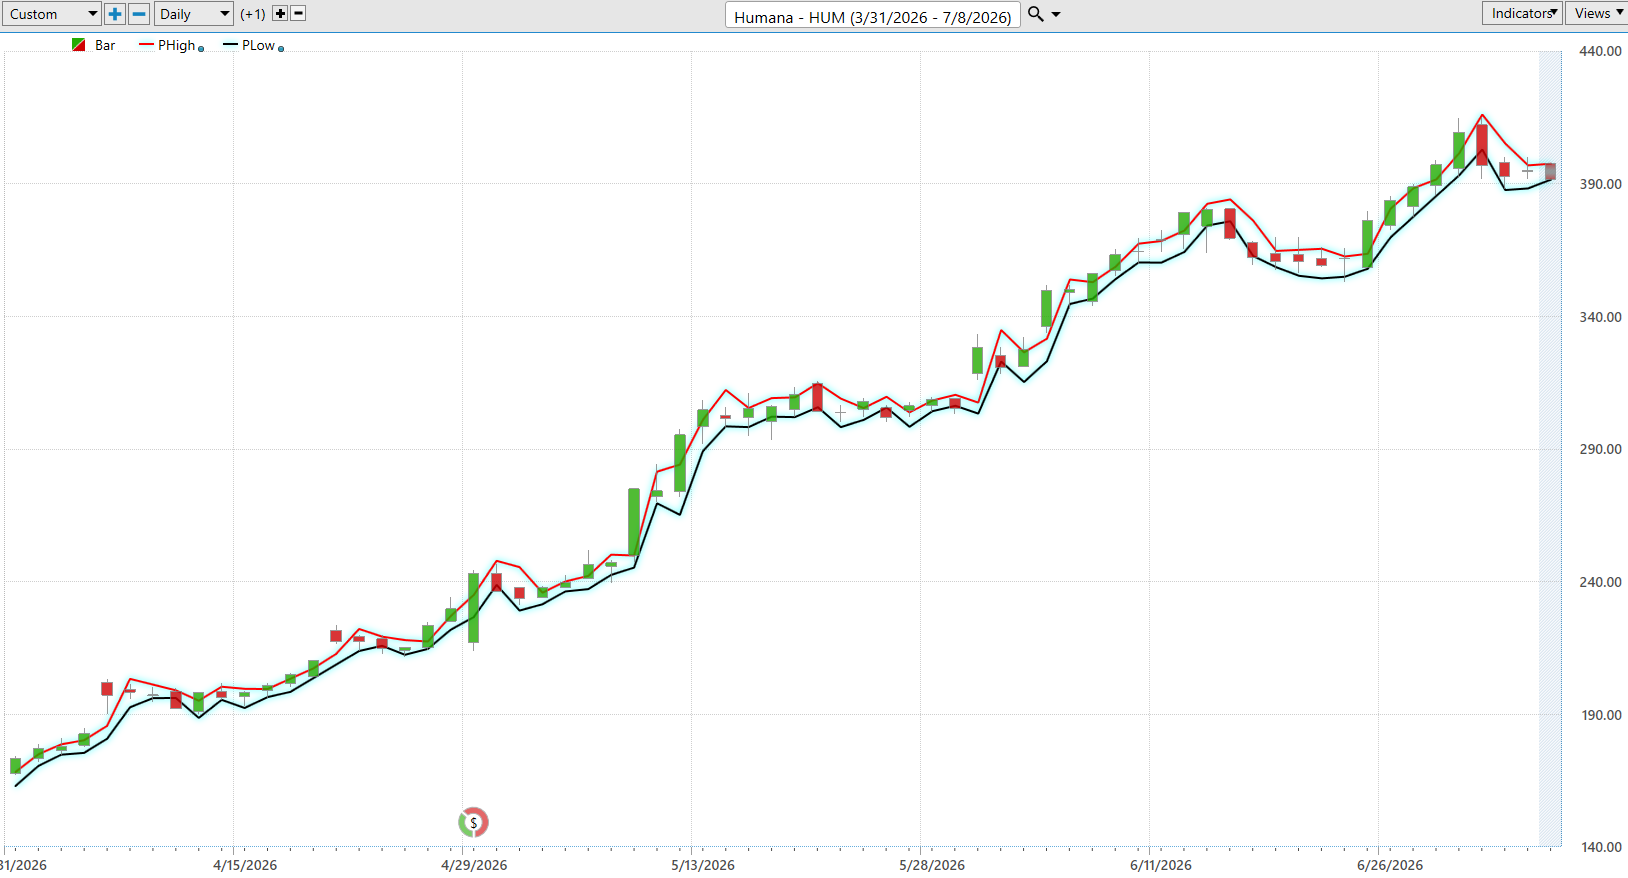
The chart adds an important dimension that the raw numbers alone cannot capture. While Humana is trading at $394.62, approximately 92% of the way through its 52-week range, the journey to get there has been anything but smooth. Another practical way to understand volatility is to study the path the stock has traveled over the past year. The highest price reached was $415.00, while the lowest was $163.11, creating a 52-week trading range of $251.89. Dividing that range by today’s closing price produces a historical volatility measure of 63.8%. Unlike analyst forecasts, which represent opinions about the future, this calculation measures what the stock has actually accomplished over the past year. Looking at the chart, you can see that Humana spent much of the first eight months trapped in a broad trading range before suffering a sharp breakdown to its annual low. What followed was an equally dramatic reversal that carried the stock almost vertically back to its 52-week high. That tells traders they are dealing with an asset capable of sustained directional moves once momentum develops.
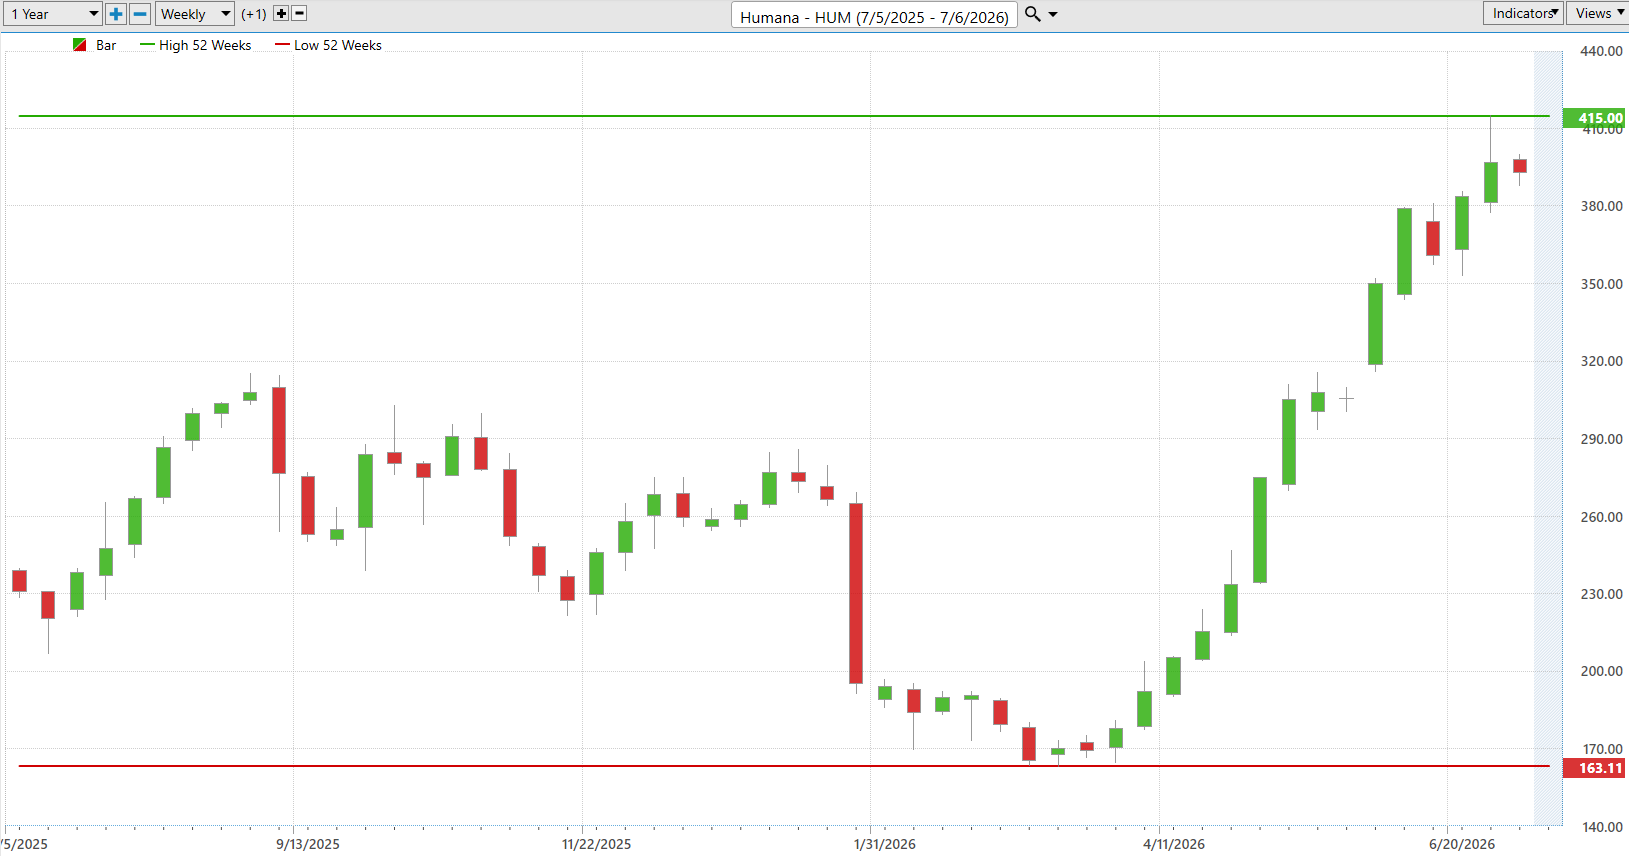
The chart also reveals something the statistics alone cannot. The midpoint of the 52-week range is approximately $289.06, yet Humana spent relatively little time there. Instead, the stock formed two distinct regimes. The first was an extended period of uncertainty between roughly $230 and $300, where buyers and sellers repeatedly battled for control. The second began immediately after the March low near $163, when buyers completely overwhelmed sellers and launched one of the strongest advances in the healthcare sector. Since then, price has produced a classic sequence of higher highs and higher lows with only brief pauses for consolidation. That behavior is characteristic of institutional accumulation rather than short-covering. The current historical volatility reading of 63.8% confirms that this is not a slow-moving defensive healthcare stock. It has demonstrated the ability to travel nearly two-thirds of its current price over the course of a year. If a similar magnitude of movement occurred over the next twelve months, history suggests another very large trading range is entirely possible. That is not a prediction. It is simply an acknowledgment of what this stock has already proven it can do.
For traders, the chart argues that Humana is still behaving like a leader rather than an exhausted rally. The stock is trading less than 5% below its 52-week high, and there is very little evidence of sustained distribution. In fact, the recent candles suggest price is consolidating just beneath resistance after an exceptionally strong advance instead of immediately reversing lower. That is often what strong stocks do. The first important signal of continued strength would be a decisive breakout above $415.00, which would establish a new 52-week high and confirm that buyers remain in control. Conversely, the first meaningful warning would not be a single down week but a series of lower highs accompanied by a break below the recent consolidation zone around $380. That would suggest institutions are beginning to take profits rather than add to positions. For now, the risk-reward profile continues to favor disciplined trend-following traders. The stock has already demonstrated that it can recover from extreme pessimism and sustain a powerful advance. Until the chart begins producing lower highs and lower lows, the prevailing trend deserves the benefit of the doubt.
Best-Case/ Worst-Case Scenario Analysis
The first thing every trader should understand is that volatility is not a theory. It is history. If you want to know what Humana is capable of doing, study the largest uninterrupted moves it has already made over the past 52 weeks. The biggest uninterrupted rally gained approximately 156.3%, carrying shares from the March low near $163 to just below $420 in only a few months. That is an extraordinary move for a company with Humana’s size and market capitalization. If a rally of similar magnitude were to begin from today’s closing price of $394.62, it would imply a theoretical price approaching $1,010. That is not a forecast, and it should never be interpreted as one. It is simply a reminder of what this stock has already proven it can do when improving fundamentals, institutional buying, positive sentiment, and strong momentum all come together. The lesson is not that Humana is destined to rally another 156%. The lesson is that markets are capable of producing moves that seem impossible until they have already happened.
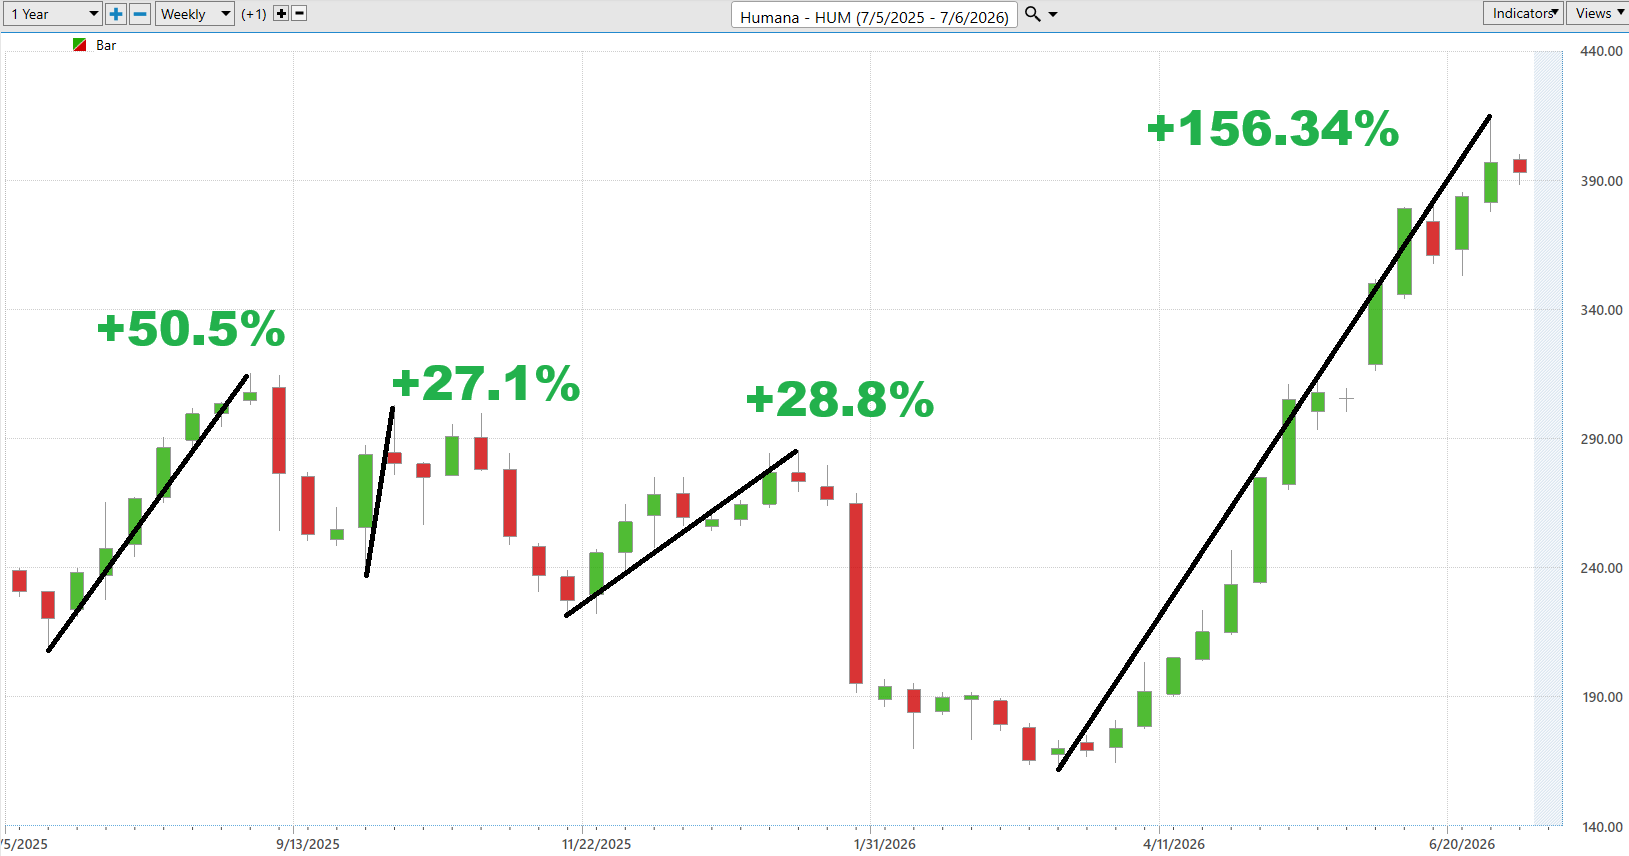
The other side of the equation deserves every bit as much respect. The largest uninterrupted decline during the past year measured approximately 42.4%. From today’s closing price, a decline of similar magnitude would place Humana near $227, representing a loss of roughly $167 per share. Looking at the chart, you can also see several intermediate corrections ranging from 15% to 26%, reminding traders that meaningful pullbacks are a normal part of this stock’s personality. The 42% decline stands apart because it unfolded quickly and decisively after what had appeared to be a healthy advance. Stocks rarely announce they are about to enter a major correction. They simply begin making lower highs and lower lows while investors convince themselves the weakness is temporary. Every trader enjoys imagining a 150% rally. Far fewer spend time preparing emotionally and financially for a 40% decline. Yet Humana’s own trading history tells us that both outcomes belong in any honest discussion of risk.
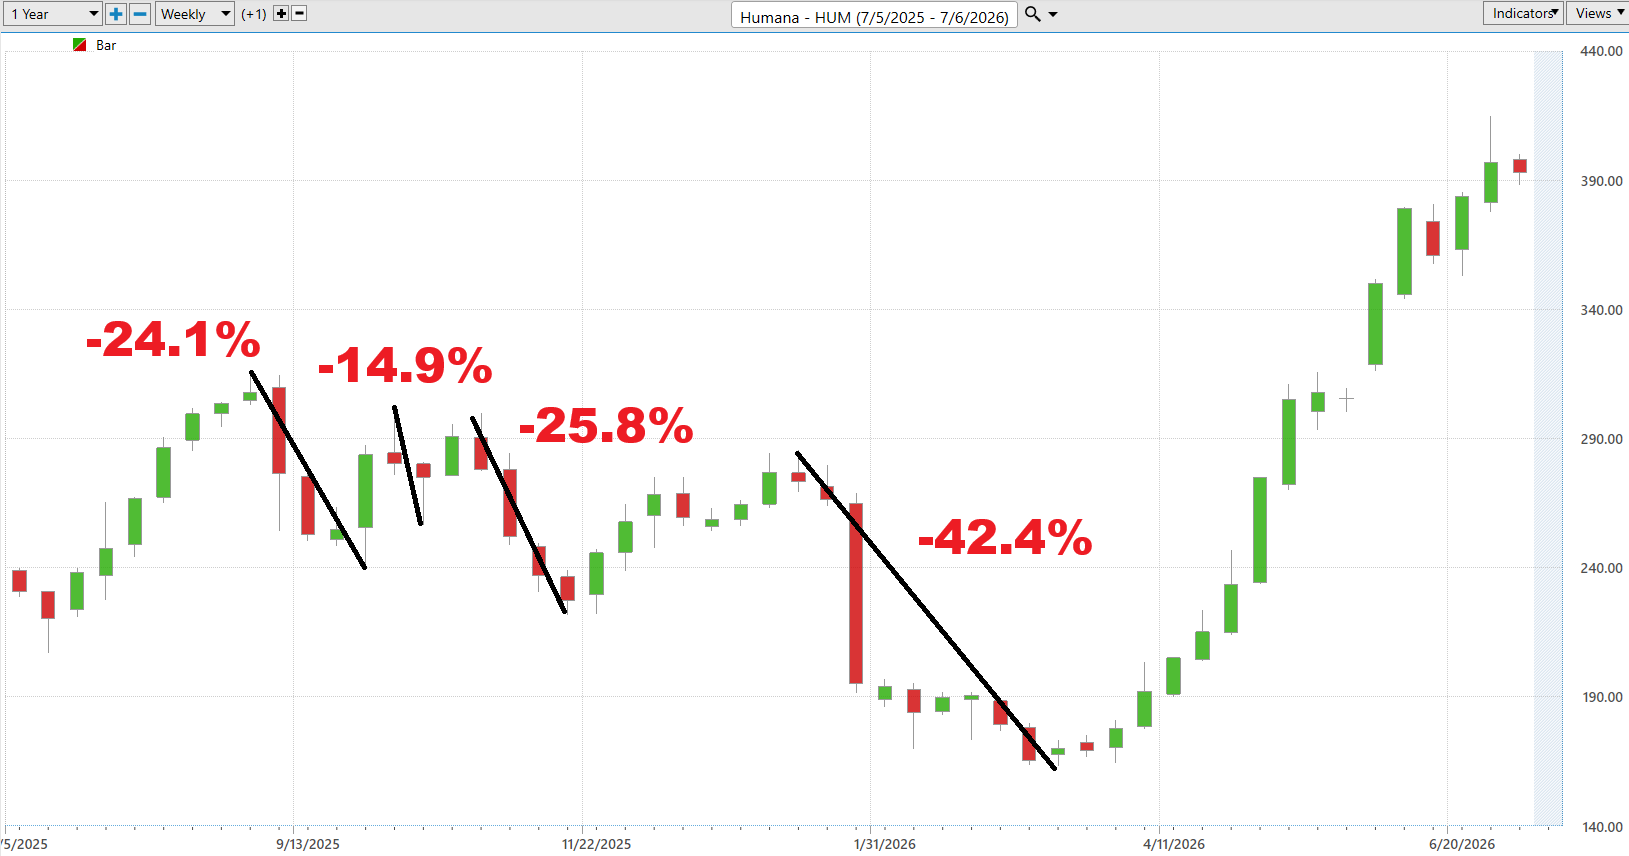
At the moment, the primary trend in Humana is clearly higher. The stock continues to produce higher highs and higher lows, and that trend deserves respect until the market proves otherwise. At the same time, traders should recognize that Humana is also a highly volatile stock. Its history shows that large advances and sharp corrections are both part of its normal behavior. Before initiating a position, every trader should ask a simple question: Can I comfortably withstand the level of volatility this stock has already demonstrated over the past year? Proper position sizing, disciplined risk management, and realistic expectations allow traders to participate when trends are strong without exposing themselves to catastrophic losses if conditions change. Humana’s chart reminds us that exceptional opportunities and painful setbacks often come from the very same stock. If you cannot tolerate a move comparable to the worst decline the stock has already experienced, then you have no business expecting to profit from a move comparable to its greatest advance. Prepared traders survive long enough to benefit when the odds finally swing in their favor.

Looking at the big picture, Humana is not just outperforming the market, it is separating itself from it. Whether you compare it to the S&P 500, the Nasdaq, the Dow, or the Russell 2000, the story is remarkably consistent. Institutions have been rewarding Humana with sustained buying pressure while the broader market has delivered far more modest gains. This is not the profile of a stock being carried higher by a bull market. It is the profile of a stock leading the bull market.
What makes this particularly compelling is the consistency. Humana has outperformed across virtually every meaningful time horizon, from the past week to the past year. That tells us this is more than a short-lived news event or a lucky earnings surprise. Strong stocks tend to remain strong because institutional capital gravitates toward companies where expectations are improving. Markets have a habit of voting with money long before they explain why.
The lesson for traders is simple. You do not have to know every reason a stock is outperforming before recognizing that it is outperforming. Relative strength is one of the clearest signals the market can provide. Today, Humana is demonstrating the kind of persistent leadership that deserves attention, not because it guarantees future gains, but because history shows that the market’s biggest winners often continue winning until the evidence changes. Keep measuring. As long as Humana continues to outperform its benchmarks, it belongs on every serious trader’s watchlist.
Vantagepoint AI Predictive Blue Line
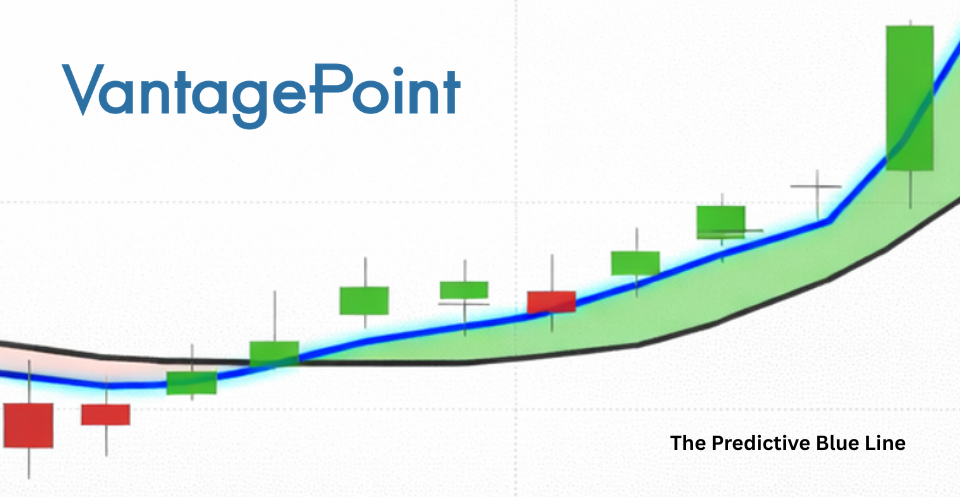
Every powerful trend has one defining trait: it stops asking for permission.
That is exactly what Humana’s Predictive Blue Line has done since early April. The blue line has remained firmly above the actual moving average throughout the rally, creating an extended period of positive confirmation. Rather than producing a series of short-lived spikes, the stock has built a disciplined advance marked by higher highs, higher lows, and persistent institutional buying.
The recent pullback changes very little. After climbing above $410, Humana has simply drifted back toward its Predictive Blue Line. More importantly, both the predictive forecast and the actual moving average continue to slope higher. The AI is signaling a pause in momentum, not a breakdown in trend. Healthy bull markets often consolidate before making their next move.
That message becomes even more compelling when viewed alongside the broader market. Health Care has emerged as one of the market’s strongest leadership groups over the past month, and Humana continues to reflect that institutional rotation. Capital is flowing toward strength, and the AI continues to identify Humana as part of that trend.
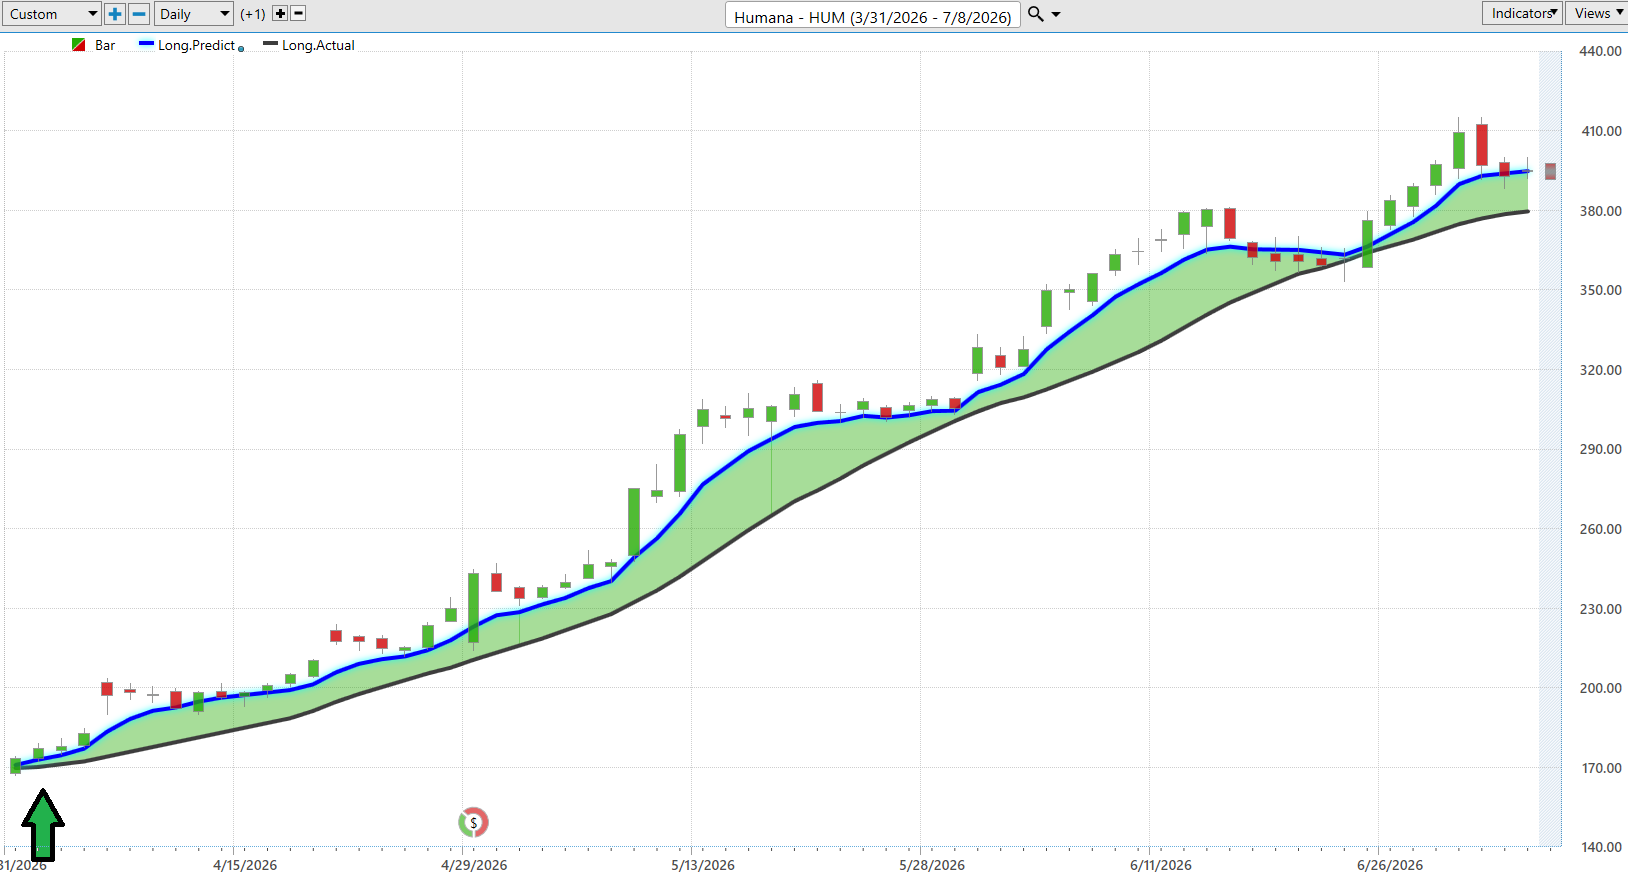
For traders, the takeaway is simple. As long as the Predictive Blue Line remains above the actual moving average, the primary trend deserves the benefit of the doubt. The chart is showing consolidation, not capitulation, and the dominant trend remains pointed higher.
VantagePoint AI Neural Index
The Neural Index is VantagePoint AI’s short-term directional forecast. Rather than measuring the current trend, it evaluates whether market conditions favor higher or lower prices over the next 48 to 72 hours. A green Neural Index indicates bullish market strength, while a red reading suggests short-term weakness.
Humana’s chart tells a compelling story. Since early April, the Neural Index has produced long stretches of green readings with only brief interruptions. Those short-lived red signals have largely coincided with normal pauses and profit-taking rather than lasting trend reversals. Each time the Neural Index returned to green, the broader uptrend quickly reasserted itself.
The most powerful signals occur when the Neural Index and the Predictive Blue Line are aligned. Throughout much of this advance, the Neural Index remained predominantly bullish while the Predictive Blue Line stayed above the actual moving average. That combination represents one of VantagePoint AI’s highest-probability trend confirmations, signaling that both the long-term trend and short-term market strength are pointing in the same direction. Historically, those conditions favor continued price appreciation rather than sustained weakness.
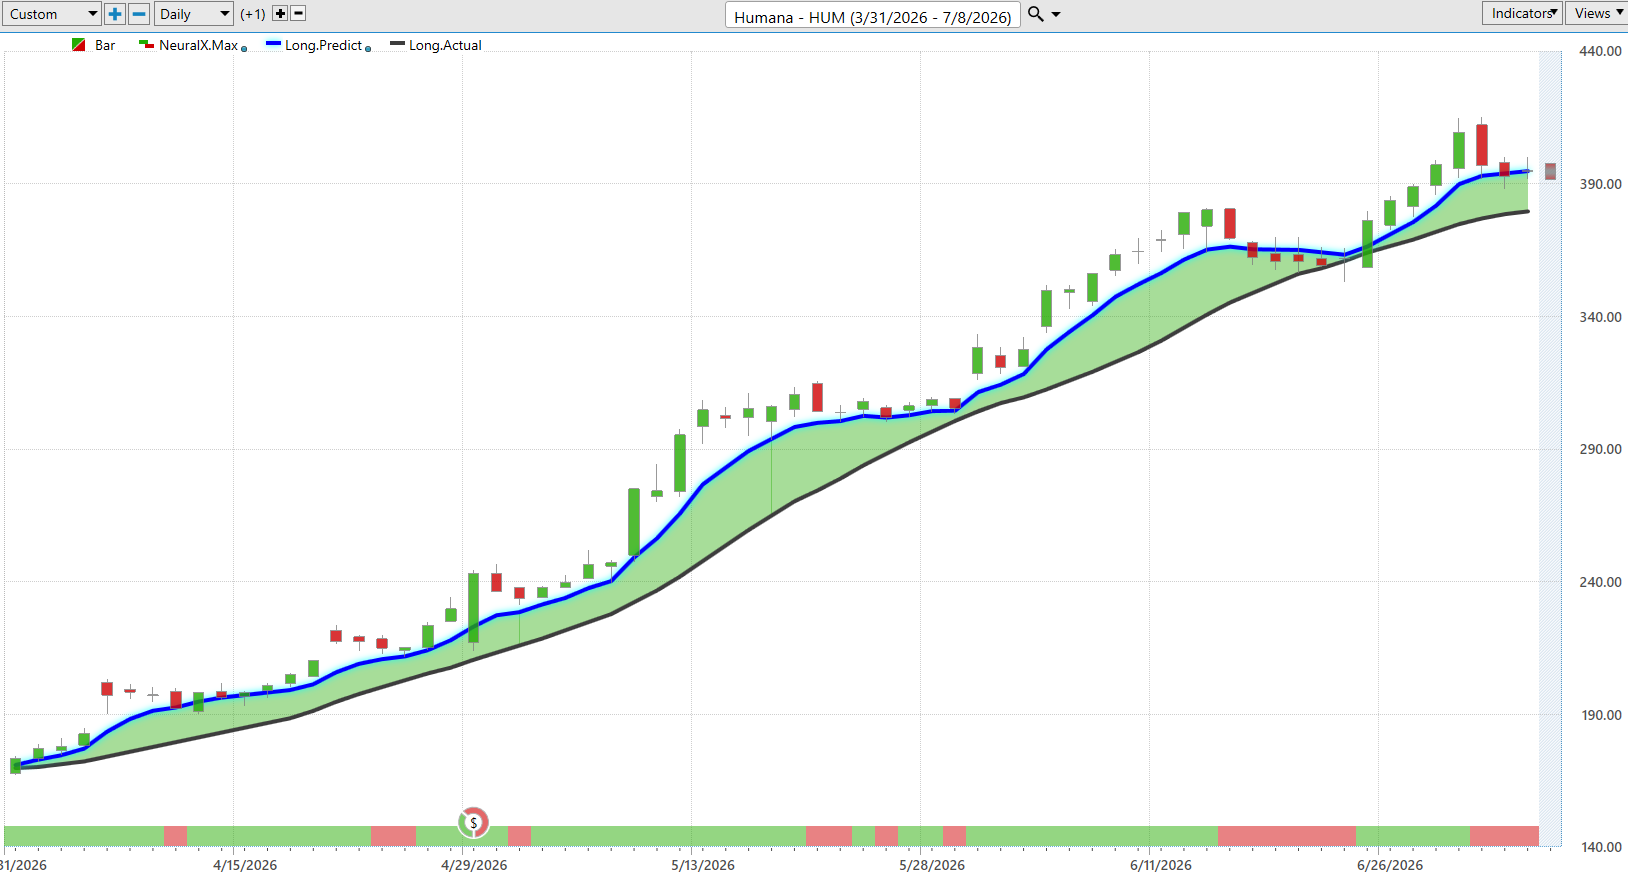
The recent cluster of red Neural Index readings reflects a cooling period following a strong rally, but the Predictive Blue Line remains firmly above the actual moving average and continues to slope higher. Until both indicators begin to deteriorate together, the evidence continues to favor a healthy consolidation within an established uptrend rather than the beginning of a major trend reversal.
VantagePoint AI Daily Range Forecast
Every trader wants the answer to two questions before the opening bell: Where is today’s opportunity, and where is today’s risk? That’s exactly what the VantagePoint AI Daily Range Forecast is designed to deliver.
The forecast projects the next session’s expected high and low, giving traders a roadmap before the market opens. Instead of reacting to price, traders can anticipate where buying and selling pressure is most likely to emerge and plan their trades accordingly.
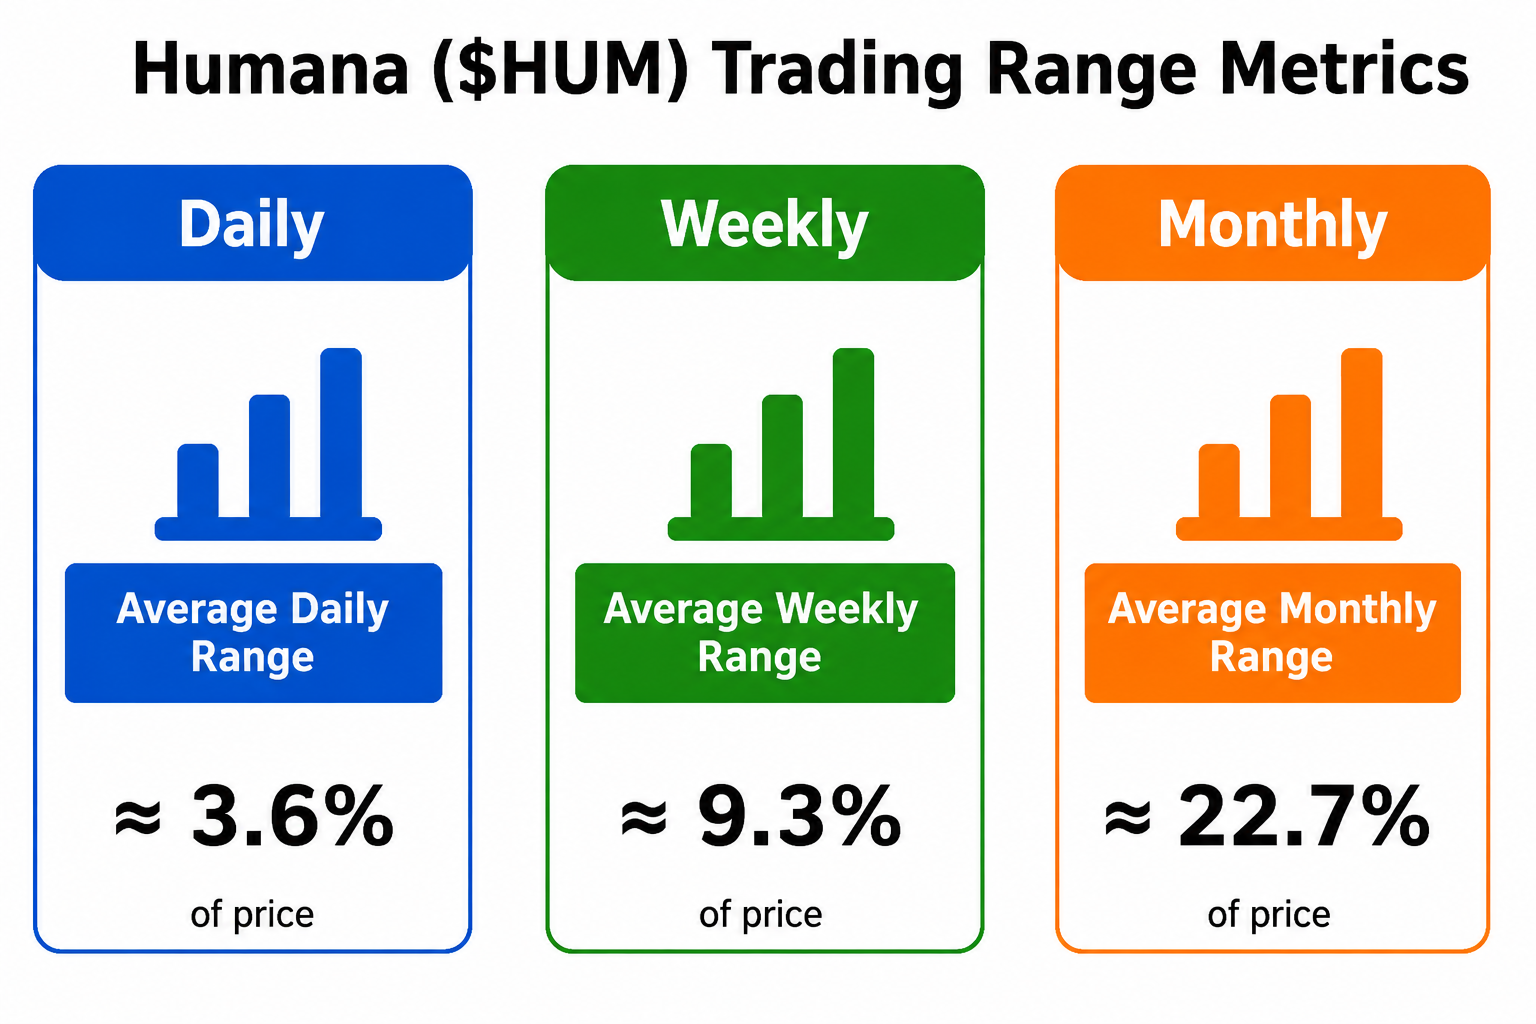
Humana provides an excellent example. As the Trading Range Metrics show, the stock is naturally volatile, averaging 3.6% daily, 9.3% weekly, and 22.7% monthly price swings. Those are meaningful moves, making risk management just as important as finding opportunity.
Throughout this powerful uptrend, the Daily Range Forecast has helped frame each day’s battlefield by identifying likely support and resistance levels before trading begins. Combined with the Predictive Blue Line and Neural Index, traders gain a more complete picture of trend, timing, and daily risk, allowing them to approach each session with greater confidence and a clearly defined game plan.
VantagePoint AI Intermarket Analysis
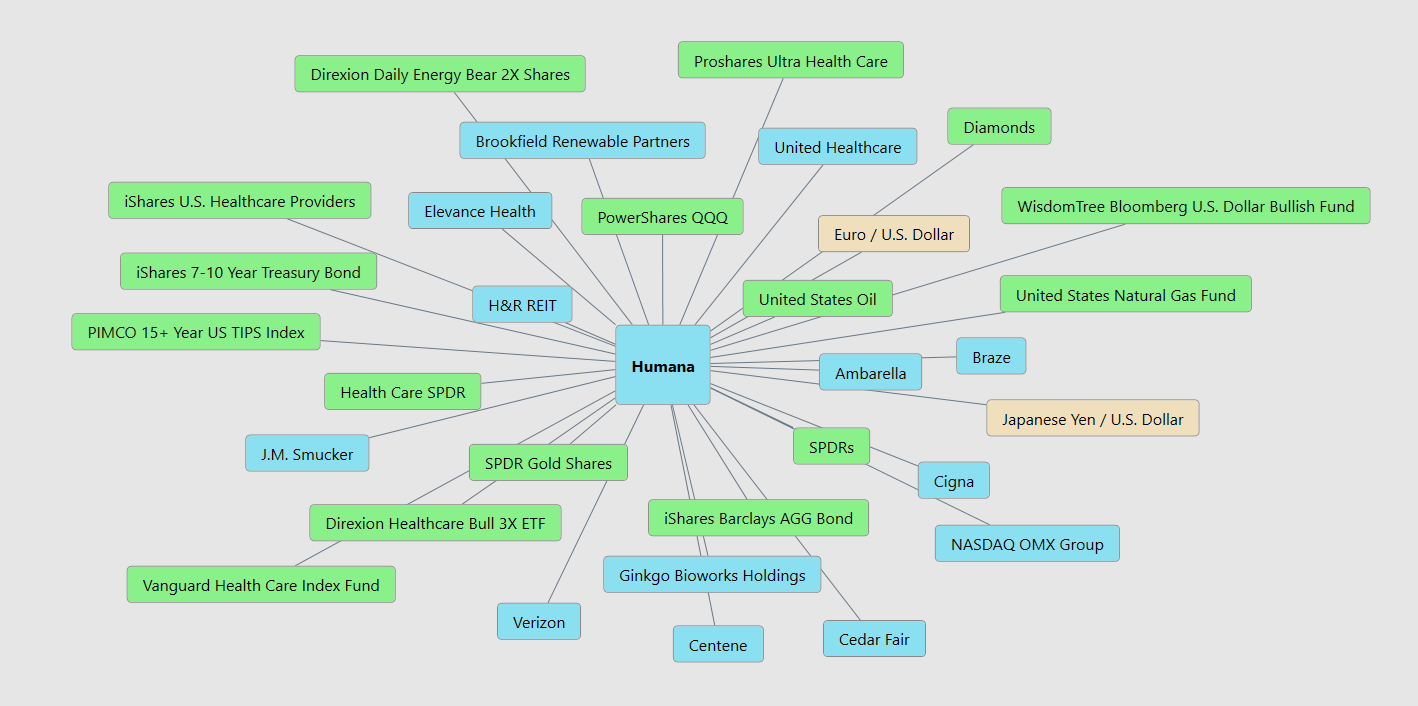
Every stock has a story. The best traders ask a different question: What forces are writing that story? That’s the purpose of intermarket analysis. Instead of looking only at Humana’s chart, it examines the web of markets, sectors, currencies, ETFs, and related companies that influence its price. The graphic illustrates that network, showing Humana doesn’t trade in isolation. It trades inside an ecosystem.
The biggest influence on Humana remains the U.S. healthcare system. Medicare reimbursement rates, healthcare policy, and the performance of major health insurers like UnitedHealthcare, Elevance Health, Cigna, and Centene all shape investor expectations. When the healthcare sector strengthens, Humana often benefits as institutional money flows into the entire group rather than a single company.
Beyond healthcare, broader market forces also matter. The S&P 500, the Nasdaq, Treasury bonds, the U.S. dollar, and commodity markets all help shape investor sentiment. Lower interest rates can support healthcare valuations, while stable energy prices and a healthy economy often improve the outlook for insurers by reducing uncertainty around costs and consumer demand.
The takeaway is simple. Humana doesn’t move because of one headline. It responds to a constantly changing network of financial relationships. Understanding those connections gives traders an important edge, helping them see not just what is happening, but why it is happening before the move becomes obvious to everyone else.
Here are the 31 key drivers of price for $HUM:
Our Suggestion
If you strip away the daily headlines, a clear story emerges from Humana’s last two earnings calls: management has shifted from defense to execution.
Just a few quarters ago, the conversation centered on rising medical costs, Medicare Advantage pricing, and margin pressure. Today, management is speaking with noticeably greater confidence. In the first-quarter 2026 earnings call, executives reaffirmed full-year guidance, reported that membership and claims trends are tracking at or better than expectations, and indicated they are already positioning 2027 Medicare Advantage bids to protect long-term profitability
That change in tone matters because markets don’t simply reward good numbers. They reward improving expectations. The stock’s powerful rally over the past three months suggests investors believe Humana has moved beyond its most difficult operating period and is entering a phase of improving execution.
The next major catalyst arrives on July 29th, when Humana reports second-quarter earnings before the market opens, followed by its conference call at 8:00 a.m. ET.
Traders should focus on three questions: Is medical cost inflation still under control? Is Medicare Advantage membership meeting expectations? And most importantly, does management maintain or improve its outlook for the second half of 2026?
From a trading perspective, the technical picture and the fundamental story are telling the same story. The Predictive Blue Line remains positive, the Neural Index has confirmed much of the advance, and Health Care has become the market’s strongest-performing sector over the past month. When improving fundamentals align with improving AI forecasts, traders are often looking at a higher-probability trend.
Our suggestion is simple: respect the trend, but let earnings validate it. Humana has earned the market’s confidence, but the next earnings call will determine whether this rally has another leg higher or pauses to digest its gains. If management reinforces its current narrative of disciplined execution and stable medical costs, the fundamental case for continued strength becomes considerably more compelling.
Practice great money management on all of your trades. Because of the huge volatility in $HUM position sizing is critical here.
It’s not magic.
It’s machine learning.
Disclaimer: THERE IS A HIGH DEGREE OF RISK INVOLVED IN TRADING. IT IS NOT PRUDENT OR ADVISABLE TO MAKE TRADING DECISIONS THAT ARE BEYOND YOUR FINANCIAL MEANS OR INVOLVE TRADING CAPITAL THAT YOU ARE NOT WILLING AND CAPABLE OF LOSING.
VANTAGEPOINT’S MARKETING CAMPAIGNS, OF ANY KIND, DO NOT CONSTITUTE TRADING ADVICE OR AN ENDORSEMENT OR RECOMMENDATION BY VANTAGEPOINT AI OR ANY ASSOCIATED AFFILIATES OF ANY TRADING METHODS, PROGRAMS, SYSTEMS OR ROUTINES. VANTAGEPOINT’S PERSONNEL ARE NOT LICENSED BROKERS OR ADVISORS AND DO NOT OFFER TRADING ADVICE.