


This week’s AI stock spotlight is Eli Lilly ($LLY)
If you’ve been wondering where institutional money has been flowing over the last several years, look no further than Eli Lilly. Founded in 1876, Lilly spent most of its history building a reputation through diabetes treatments, insulin products, oncology therapies, and breakthrough medicines. For decades it was viewed as a stable pharmaceutical company. Today it has become one of the most important growth stories in the entire market. That transformation is exactly why traders are paying attention.
The reason is simple. Winners leave clues. When a company grows revenue by more than 50% year over year, raises guidance, dominates headlines, and continues making new highs, institutions notice. When institutions notice, traders should too. Performance always attracts capital.
At its core, Lilly develops and commercializes prescription medicines across diabetes, obesity, oncology, neuroscience, immunology, and cardiovascular disease. The company operates globally and serves millions of patients through healthcare systems, hospitals, physicians, and pharmacies around the world. But let’s be honest about what is driving the stock right now. The market is not buying Lilly because of its broad pharmaceutical portfolio. The market is buying Lilly because of Mounjaro and Zepbound.
These two drugs have completely changed the growth profile of the company. Mounjaro has become one of the fastest-growing diabetes therapies ever introduced, while Zepbound has quickly established itself as a leader in obesity treatment. Together they have transformed Lilly from a traditional pharmaceutical company into one of Wall Street’s favorite growth stocks. Recent results tell the story. Revenue surged 56% year over year while both products continued to exceed expectations.
Those numbers matter because they are not typical pharmaceutical growth rates. They resemble the type of growth investors usually associate with disruptive technology companies. That distinction is important because it helps explain why Lilly commands a premium valuation. The market is no longer treating Lilly like a mature drug manufacturer. It is treating Lilly like a company with a long runway of accelerating growth.
The company remains headquartered in Indianapolis under the leadership of CEO David Ricks and employs tens of thousands of people worldwide. Lilly competes against pharmaceutical giants including Novo Nordisk, Pfizer, AstraZeneca, and Roche. Yet at this moment, Lilly appears to hold one of the strongest competitive positions in healthcare. The reason comes down to product leadership, clinical results, and pipeline depth. Wall Street loves successful products, but it loves future products even more.
Financially, the company continues firing on all cylinders. Revenue is accelerating. Earnings are accelerating. Cash flow remains strong, margins remain among the best in the industry, and debt levels remain manageable relative to earnings growth. These are exactly the characteristics institutional investors look for when searching for long-term market leaders.
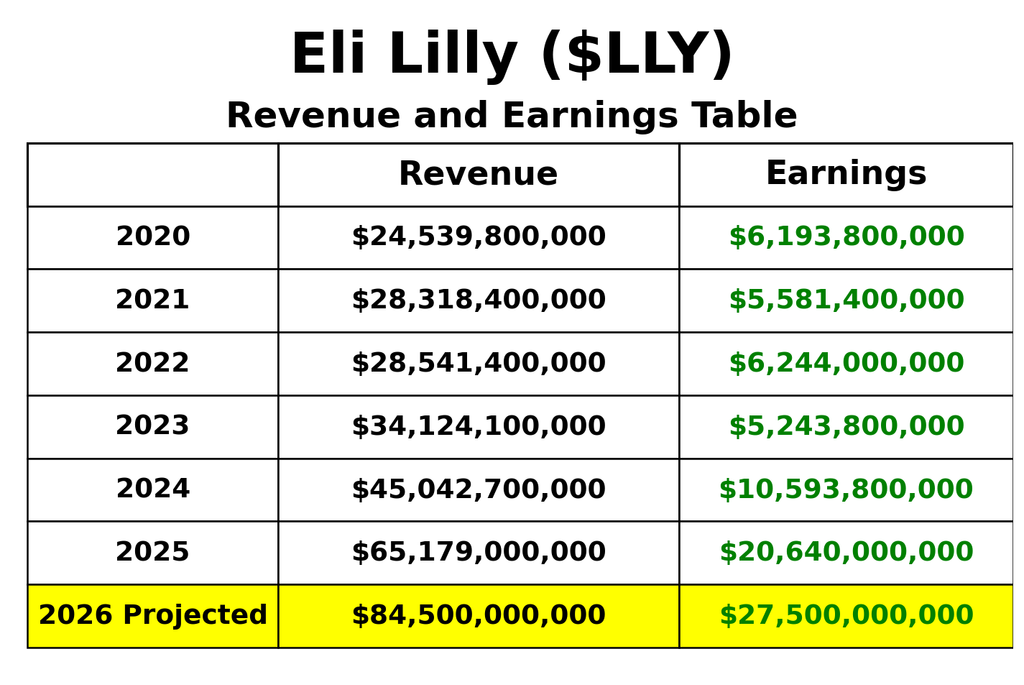
What jumps off the page is not simply that Eli Lilly is growing but that the company has entered a completely different economic orbit. Revenue has surged from $24.5 billion in 2020 to more than $65 billion in 2025, while earnings have more than tripled over the same period. For traders, this matters because stocks ultimately follow the direction of earnings, and Lilly’s earnings are accelerating much faster than its already impressive sales growth. The market is not rewarding Lilly for what it earned five years ago. It is pricing in the possibility that obesity and diabetes treatments become one of the largest pharmaceutical opportunities in modern history. The key takeaway is simple: this is no longer a slow-growth drug company. It is a rare mega-cap company delivering startup-like growth rates, which explains why investors continue to pay a premium and why every earnings report has become a major event for the stock.
Perhaps the biggest mistake traders make is viewing Lilly as a traditional pharmaceutical company. Traditional pharmaceutical companies are typically judged by patent expirations, mature product portfolios, and modest growth rates. Lilly is being valued differently because investors see the potential for obesity treatment to become one of the largest healthcare markets in history. They are not simply buying today’s earnings. They are buying the possibility of significantly larger earnings in the future.
In this analysis we will review and evaluate forecasts using the following set of indicators and tools.
Wall Street Analysts Ratings and Forecasts
52 Week High and Low Boundaries
Best-Case / Worst-Case Scenario Analysis
VantagePoint AI Predictive Blue Line
Neural Network Forecast (Machine Learning)
VantagePoint AI Daily Range Forecast
Intermarket Analysis
Our Suggestion
We use artificial intelligence to improve probabilities, not replace judgment. Because a powerful signal means little if the business behind it is weak. That’s why we look beyond the chart and study revenue, earnings, cash flow, and competitive position. When strong fundamentals and strong price action move together, the odds often shift decisively in the trader’s favor.
Wall Street Analysts Price Forecasts
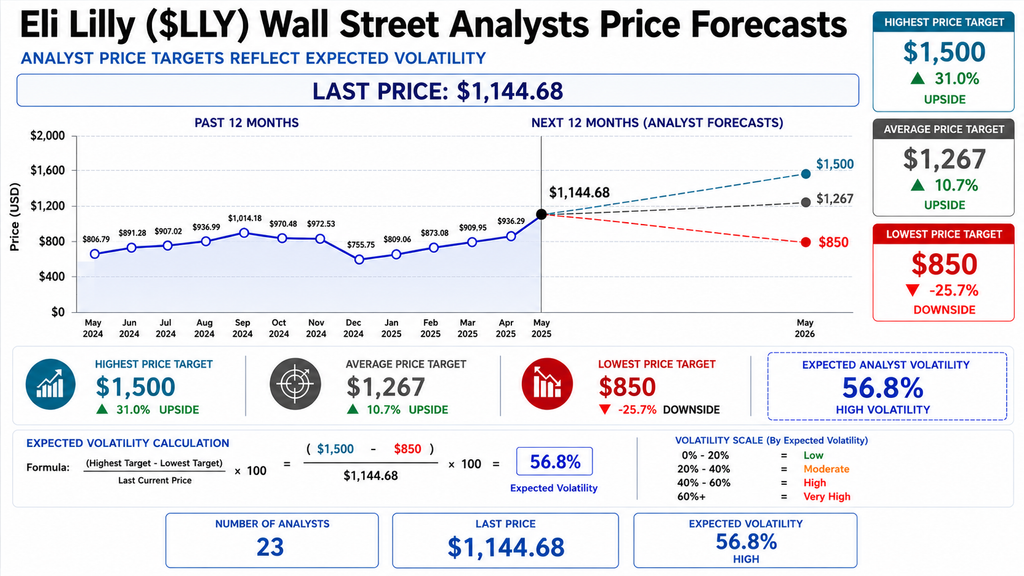
Wall Street is not debating whether Eli Lilly is a successful company. That question was settled years ago. The debate today is how much larger the company’s opportunity can become. Analysts currently project targets ranging from $850 to $1,500, with a consensus target of $1,267. When a stock already trades above $1,100 and analysts still see additional upside, it tells you that investors remain focused on future earnings growth rather than current valuation.
The most revealing number on this graphic may be the expected volatility reading of 56.8%. That places Lilly firmly in the high-volatility category. The volatility is not being driven by financial weakness or operational instability. It reflects uncertainty surrounding what could become one of the largest pharmaceutical markets in history. Analysts broadly agree that obesity treatments represent a major opportunity. Their disagreement centers on how large that opportunity ultimately becomes and how much of it Lilly can capture.
The forecast range highlights the balance between opportunity and risk. The bullish case points to continued growth in Mounjaro and Zepbound, additional treatment indications, manufacturing expansion, and a pipeline capable of extending Lilly’s leadership position. The bearish case assumes competition intensifies, pricing pressure emerges, growth rates moderate, and investor expectations become more difficult to exceed. Importantly, none of the analyst targets suggest a company in decline. They simply represent different views on the pace and duration of future growth.
For traders, this chart is less about predicting the future and more about understanding expectations. The average target of $1,267 implies Wall Street still expects growth. The high target of $1,500 reflects confidence that Lilly’s obesity franchise remains in its early stages. The low target of $850 serves as a reminder that even exceptional companies can experience valuation compression when expectations get ahead of reality. As long as revenue growth, prescription demand, and pipeline progress continue moving higher, Wall Street is likely to remain constructive on the stock.
52 Week High and Low Boundaries
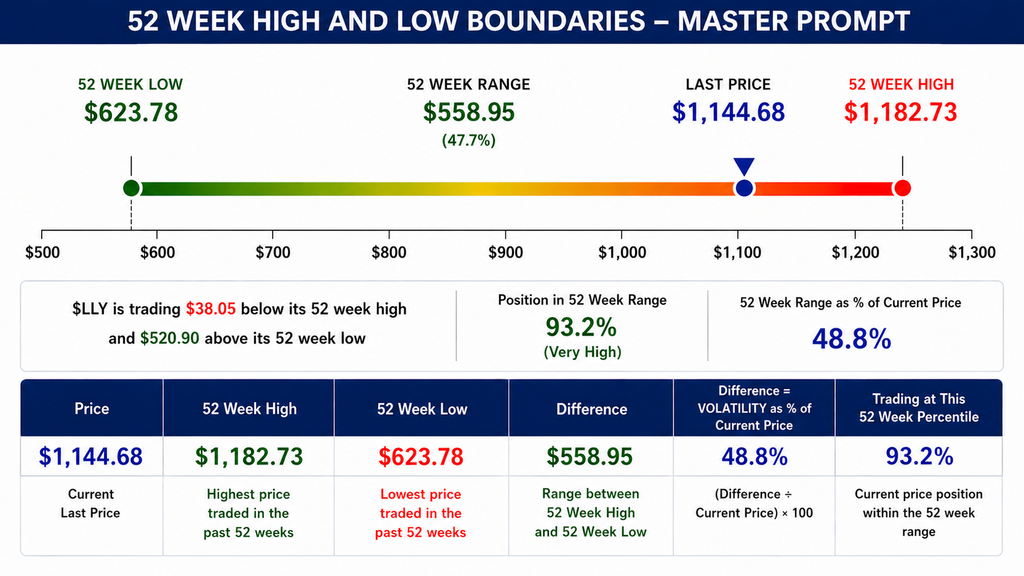
The 52-week high and low are one of the simplest scoreboards in all of investing. They cut through opinions, forecasts, and headlines and answer a straightforward question: where is the stock trading relative to where buyers and sellers have valued it over the last year? For traders, that matters because strong stocks tend to spend time near their highs while weak stocks tend to spend time near their lows. The market may not always be rational, but it is always keeping score.
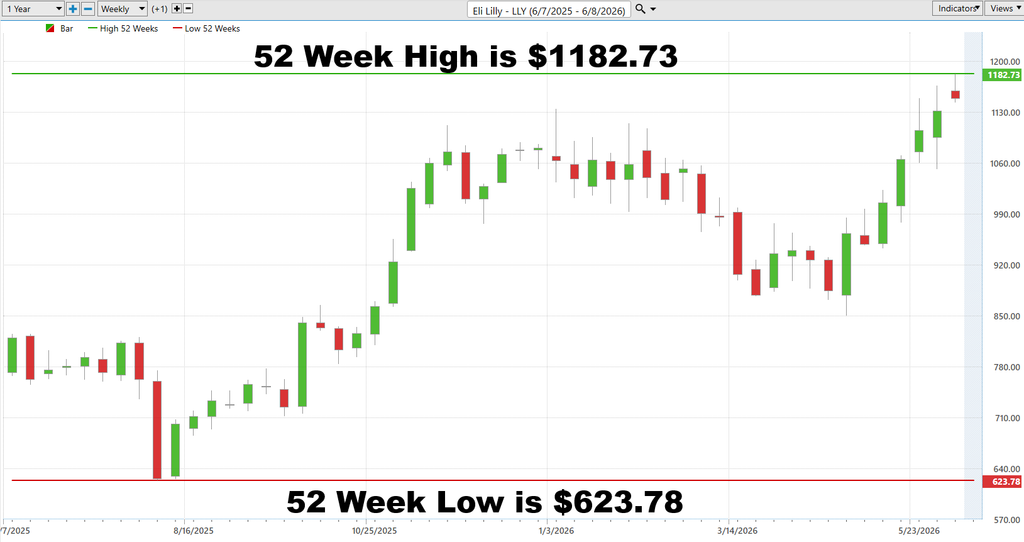
For Eli Lilly, the scoreboard is difficult to ignore. The stock closed at $1,144.68 against a 52-week high of $1,182.73 and a 52-week low of $623.78. That places Lilly roughly 93.2% of the way through its entire 52-week trading range. In practical terms, the stock is trading only $38.05 below its yearly high while sitting more than $520 above its yearly low. That is not the behavior of a stock struggling to find buyers. It is the behavior of a stock that institutions continue to accumulate despite already substantial gains.
The range itself is also revealing. Lilly’s 52-week trading range spans $558.95, which represents approximately 48.8% of the current stock price. That is a meaningful amount of volatility, but it has occurred within a powerful upward trend. More importantly, the stock has not spent its time bouncing between the extremes of the range. Instead, it has steadily migrated toward the upper end of the range where it remains today. When a stock consistently holds near its highs, it suggests that investors view pullbacks as opportunities rather than reasons to exit.
Traders should pay close attention to what happens around the $1,182 level. A decisive breakout above the 52-week high would signal continued institutional confidence and potentially attract additional momentum-oriented capital. On the other hand, repeated failures near that level could lead to profit-taking and a period of consolidation. The key point is that Lilly has earned the right to be judged against its highs, not its lows. Strong stocks tend to challenge resistance. Weak stocks spend their time trying to recover from damage.
The trader’s takeaway is straightforward. Eli Lilly is acting like a leader, not a laggard. Its position near the top of its 52-week range suggests that institutional sponsorship remains strong and that investors continue to reward the company’s growth story. As long as the stock remains near its highs and continues building support above prior breakout levels, the trend remains constructive. The next important test is whether Lilly can convert a near-high position into a new high and continue extending its leadership.
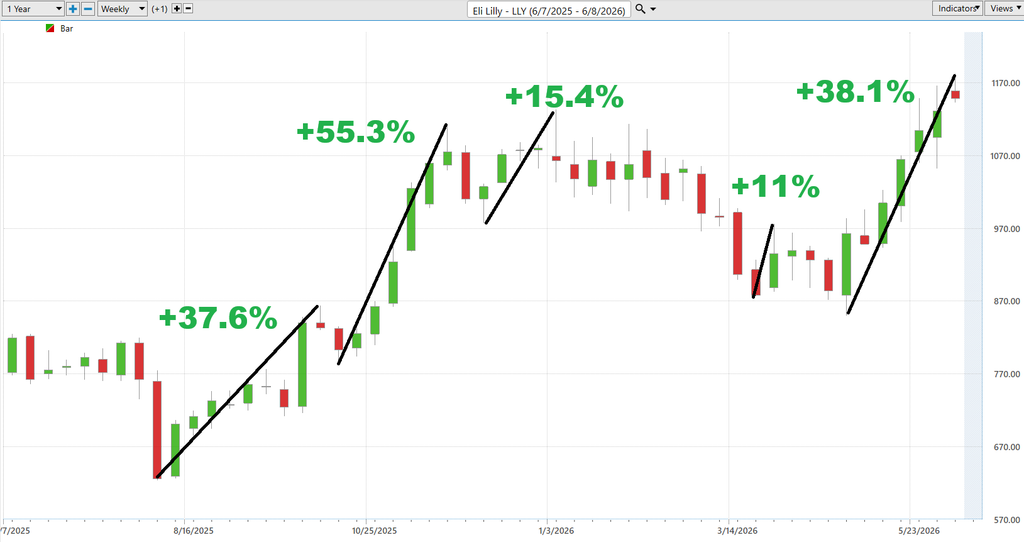
Best-Case/Worst-Case Scenario Analysis
One of the most useful exercises for traders is separating what a stock can do from what it usually does. The Following two charts above provide a simple but powerful framework. They examine the largest uninterrupted advances and declines in Eli Lilly over the past year. Instead of predicting the future, they show us what the stock has already demonstrated it is capable of doing when momentum takes hold in either direction.
The bullish side tells a very compelling story. Lilly produced advances ranging between +15.4 and +55.3%. The average advance works out to approximately +31.5%.
The bearish side of the ledger shows five meaningful drawdowns. The largest decline measured approximately -23.4%, while other corrections registered -20.8%, -12.2%, -12.0%, and -11.9%. Averaging these declines produces a typical downside move of roughly -16.1%. Notice something important: the upside moves are generally larger than the downside moves. That asymmetry is often present in market leaders. The strongest stocks tend to spend more time advancing than declining, and when they do advance, the gains frequently exceed the magnitude of their corrections.
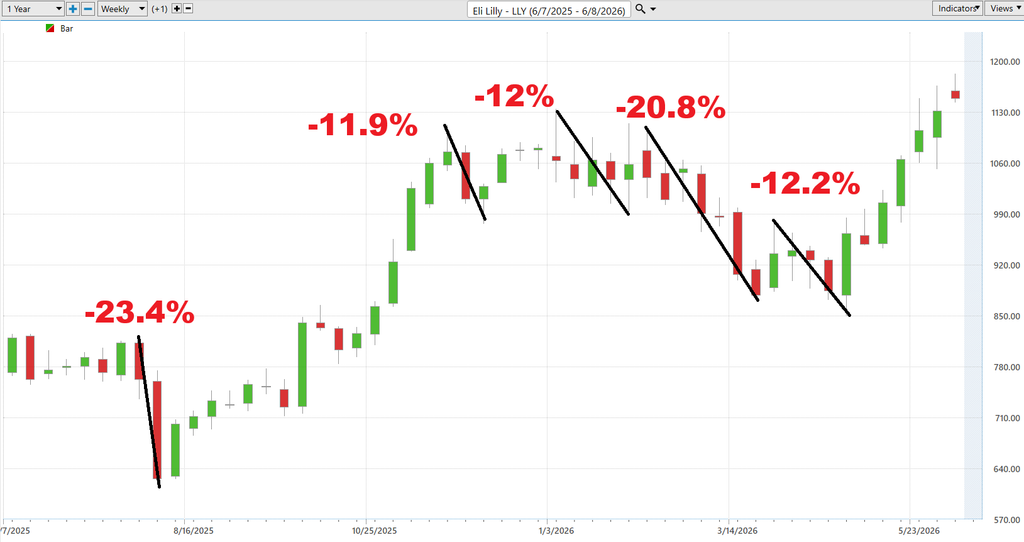
The message is straightforward. Even one of the strongest healthcare stocks in the market experiences sharp pullbacks. Traders who assume great companies only move higher eventually discover that volatility is the admission price for participating in long-term leadership stocks.
Viewed together, these charts reveal a stock with a favorable historical risk-reward profile. Average upside swings of roughly 31.5% compare favorably against average downside corrections of approximately 16.1%. No trader should assume these exact percentages will repeat, but they provide a useful framework for understanding Lilly’s behavior. The stock has repeatedly demonstrated the ability to recover from corrections and push to new highs. That pattern is one reason institutions continue to treat Lilly as a leadership stock rather than a trading vehicle.
The trader’s takeaway is clear. The best-case scenario for Lilly is not based on hope. It is based on a documented history of sustained advances that have averaged more than 30%. The worst-case scenario is equally grounded in reality, with corrections averaging about half the size of those advances. As long as Lilly continues making higher highs and higher lows, history suggests the reward side of the equation remains larger than the risk side. The first warning sign would be a correction that exceeds the stock’s normal historical behavior and fails to attract buyers. Until that occurs, Lilly continues to trade like a stock that institutions are willing to accumulate on weakness rather than abandon.
Next we compare $LLY to the broader stock market averages.
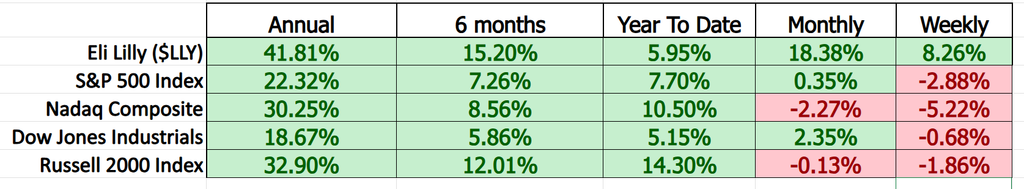
The big picture is simple: Eli Lilly is outperforming.
Not just outperforming by a little. Lilly has established itself as one of the market’s leadership stocks. While investors continue debating interest rates, economic growth, and the next big market theme, the stock has consistently attracted capital and rewarded shareholders. The message from the scoreboard is clear. Institutions have been willing to commit money to Lilly at a pace that exceeds the broader market.
What makes this particularly noteworthy is that Lilly is accomplishing this from a position of strength rather than recovery. Many stocks outperform because they are rebounding from weakness. Lilly is outperforming while already trading near the upper end of its 52-week range and near all-time highs. That is often where true market leaders separate themselves from the pack. Strong stocks tend to become stronger because institutional investors prefer proven winners over uncertain turnarounds.
The larger implication for traders is that Lilly is no longer simply a pharmaceutical company. It has become a leadership stock. Leadership stocks attract attention, attract capital, and frequently continue outperforming longer than most investors expect. The trend will not last forever, but the burden of proof belongs to the bears. Until the relative strength deteriorates and the stock stops outperforming the major indexes, the evidence suggests that Lilly remains one of the market’s premier institutional favorites.
Vantagepoint AI Predictive Blue Line
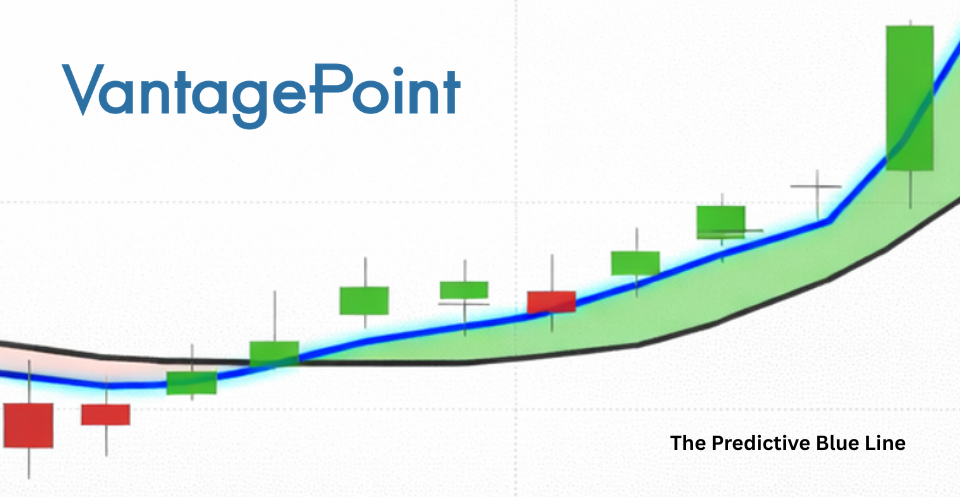
The Predictive Blue Line is designed to help traders identify the likely direction of future price movement. In Eli Lilly’s case, the signal remains constructive. The blue line continues to trend higher and, importantly, remains above the black line, which represents the simple 10-day moving average. When the Predictive Blue Line is positioned above the 10-day moving average and both indicators are moving higher, it suggests that momentum and trend direction are aligned.
One of the most important observations on this chart is how the relationship between the Predictive Blue Line and the 10-day moving average evolved over the past several weeks. During periods of consolidation and short-term weakness, the blue line narrowed its distance from the moving average but never experienced a meaningful bearish crossover. Instead, buyers repeatedly stepped back into the stock, allowing the Predictive Blue Line to resume its advance. That behavior often signals that institutions remain committed to the trend rather than using rallies as opportunities to reduce exposure.
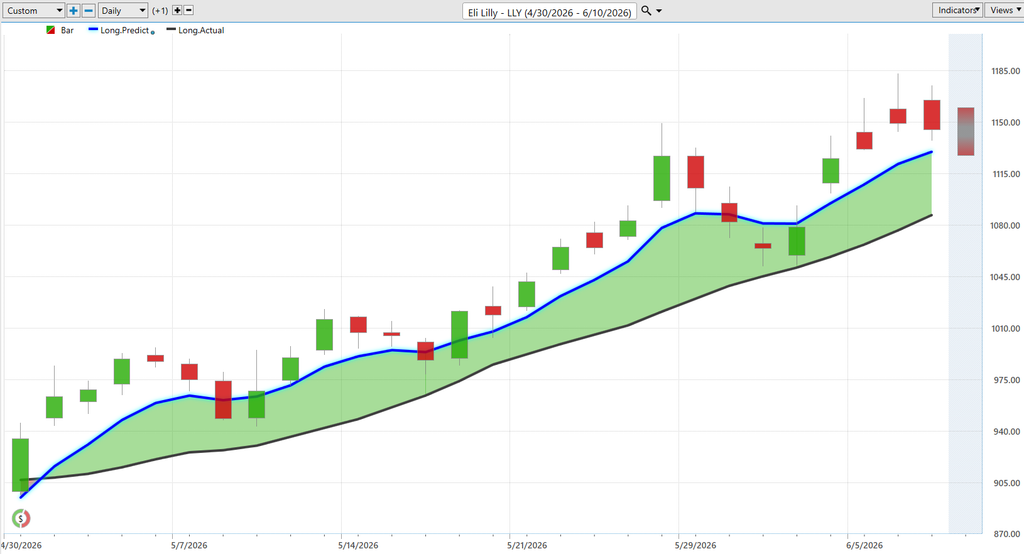
The spread between the Predictive Blue Line and the 10-day moving average is especially important. Think of it as the market’s momentum cushion. When the blue line is rising faster than the moving average, it indicates improving strength beneath the surface. In the most recent portion of the chart, the Predictive Blue Line has turned higher again while maintaining positive separation from the 10-day moving average. That widening spread suggests momentum is accelerating rather than slowing.
The trader’s takeaway is straightforward. The bullish case remains intact as long as the Predictive Blue Line stays above the simple 10-day moving average and both indicators continue making higher highs and higher lows. The strongest stocks often display this exact relationship for extended periods of time. The first warning sign would be a flattening Predictive Blue Line followed by a decisive move below the 10-day moving average. Until that occurs, the relationship between these two indicators continues to support the view that Eli Lilly remains in a healthy uptrend.
VantagePoint AI Neural Index (Machine Learning)
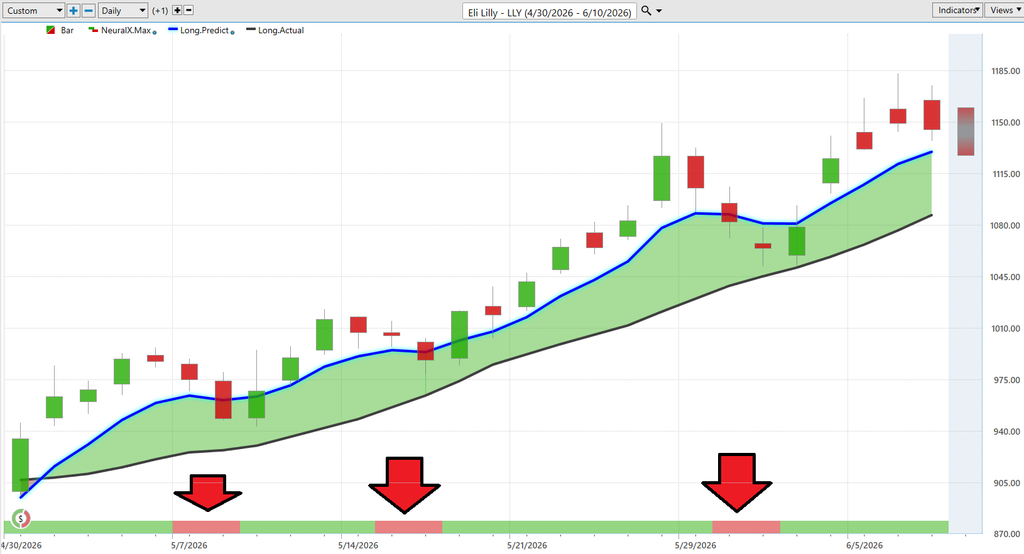
The Neural Index is an artificial intelligence indicator designed to forecast the likely direction of price movement over the next 48 to 72 hours. Unlike traditional indicators that rely primarily on a stock’s own price history, the Neural Index evaluates thousands of intermarket relationships that influence a stock’s behavior. The output is intentionally simple: green suggests conditions favor higher prices, while red suggests conditions favor lower prices. Think of it as a short-term probability gauge rather than a prediction of exactly how far a stock may move.
For Eli Lilly, the message from the Neural Index has been remarkably consistent. While there have been a few brief red readings during periods of consolidation, the indicator has spent the overwhelming majority of its time in green territory. That tells us the AI continues to identify favorable conditions supporting the stock. The brief red signals largely coincided with short-term pullbacks rather than meaningful changes in the broader trend.
The Neural Index becomes particularly powerful when viewed alongside the Predictive Blue Line. The Predictive Blue Line is currently trending higher and remains above the simple 10-day moving average. At the same time, the Neural Index has returned to green. When both indicators point in the same direction, traders receive what VantagePoint refers to as double confirmation. The longer-term forecast and the short-term forecast are aligned, providing additional confidence that the prevailing trend remains intact.
The takeaway for traders is straightforward. Eli Lilly’s AI forecast remains constructive. The Predictive Blue Line continues to signal an upward trend, and the Neural Index continues to support that outlook. As long as the Neural Index remains green and the Predictive Blue Line stays above the 10-day moving average, the weight of the evidence suggests that buyers remain in control and the bullish trend remains healthy.
VantagePoint AI Daily Range Forecast
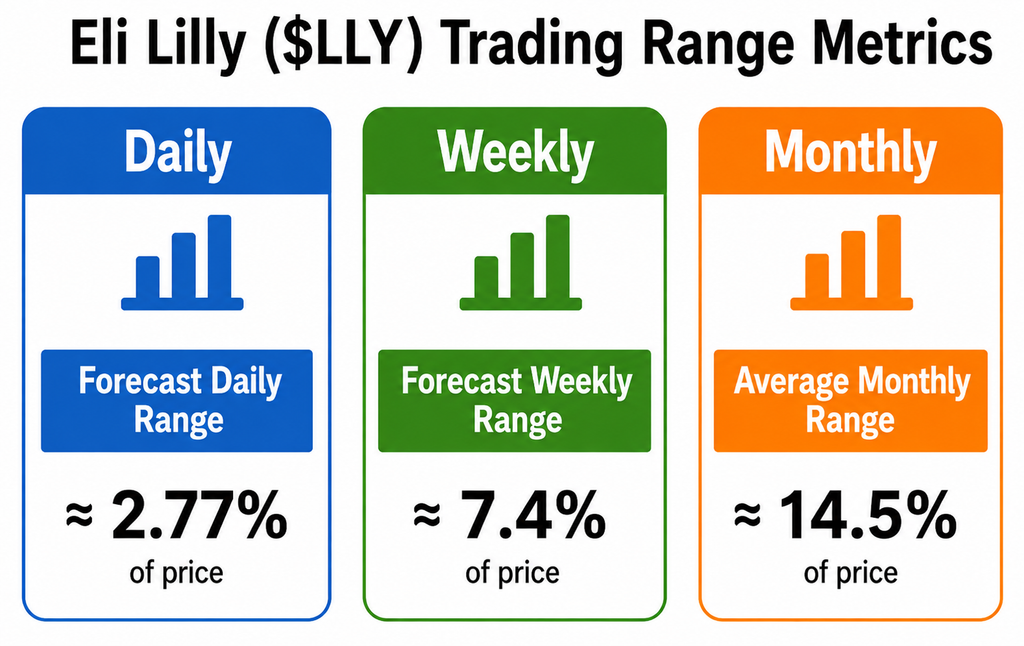
The first thing traders should understand about Eli Lilly right now is that volatility remains remarkably controlled for a stock trading near all-time highs. The Trading Range Metrics show an average daily movement of approximately 2.77%, a weekly range of 7.4%, and a monthly range of 14.5%. Those numbers tell us that Lilly is capable of making meaningful moves without exhibiting the wild swings often associated with speculative growth stocks. In other words, this is a stock that has been advancing in an orderly fashion rather than through emotional bursts of buying and selling.
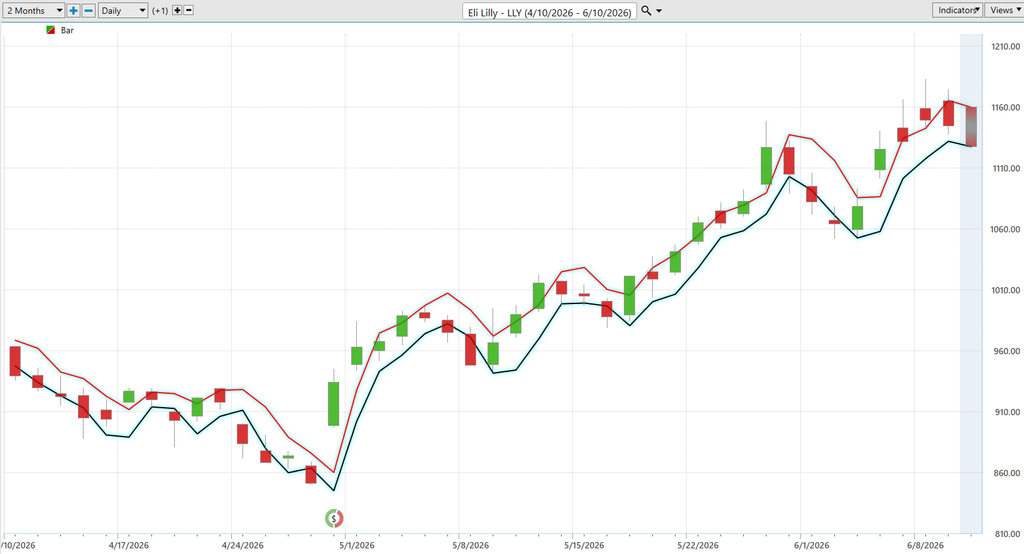
The Daily Range Forecast adds another important layer to the story. The forecast bands have consistently framed price movement over the past two months, with Lilly repeatedly finding support near the lower forecast boundary and advancing toward the upper boundary. More importantly, both forecast bands have continued trending higher. That tells traders that volatility is expanding in the direction of the prevailing trend rather than signaling instability. When forecast channels rise alongside price, it generally reflects healthy demand and persistent institutional accumulation.
Perhaps the most important observation is what has happened during pullbacks. Several short-term declines occurred throughout the period, yet price repeatedly remained within the forecast boundaries before resuming its advance. The market has given traders multiple opportunities to become concerned, and each time buyers have stepped back in. That pattern suggests that weakness is being viewed as a buying opportunity rather than a reason to abandon positions. Strong stocks often behave this way, grinding higher while frustrating traders who wait endlessly for a larger correction that never arrives.
The trader’s takeaway is straightforward. Lilly’s volatility profile remains constructive, its forecast ranges continue moving higher, and price remains well-behaved within those projected boundaries. The daily range metric of 2.77% reminds traders that normal fluctuations should be expected, while the weekly and monthly metrics provide perspective on the stock’s larger movement potential. As long as the forecast bands continue rising and price remains comfortably within that structure, the evidence suggests the path of least resistance remains higher.
VantagePoint AI Intermarket Analysis
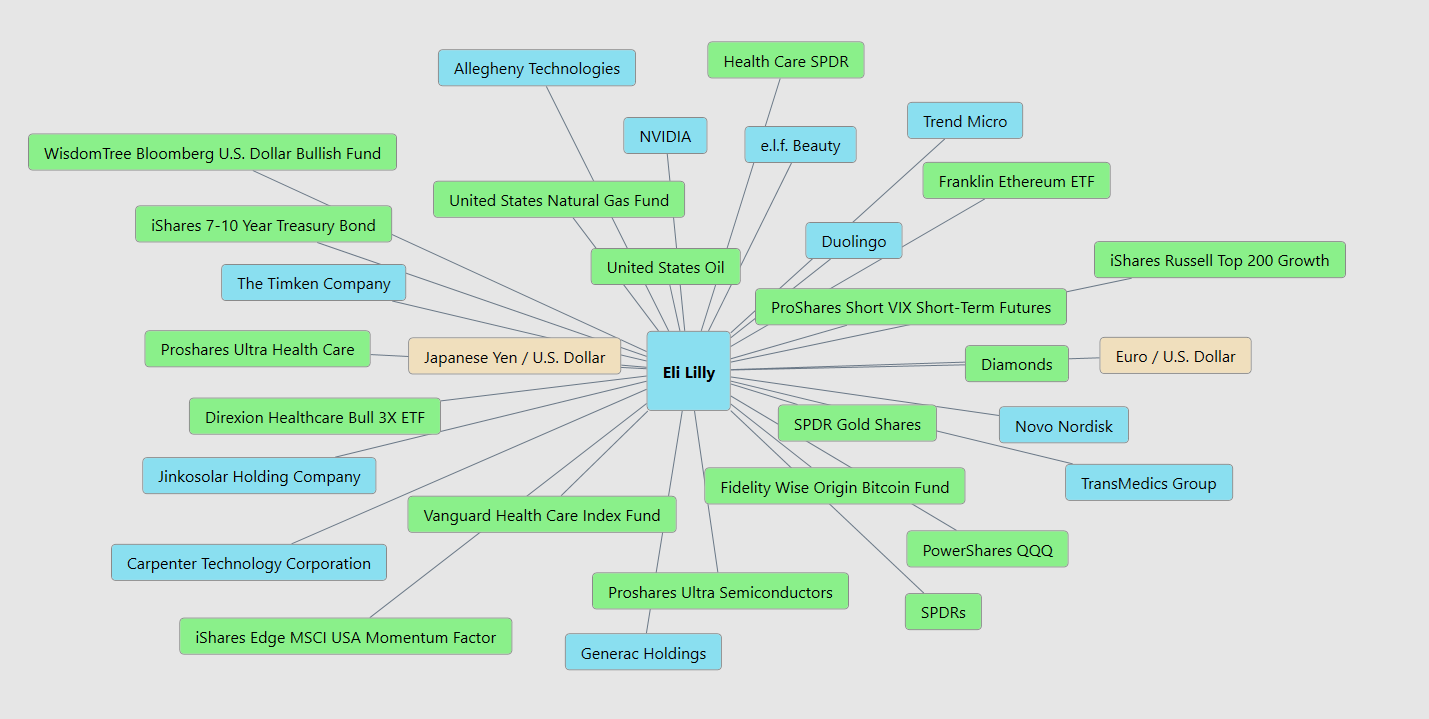
Intermarket analysis is the study of how other financial markets influence a stock’s future price movement. Rather than looking only at a stock’s own chart, intermarket analysis examines relationships between stocks, bonds, interest rates, currencies, commodities, sector ETFs, and competing companies to identify forces that may be driving price action. The underlying principle is simple: no stock trades in isolation. Understanding the markets that influence a stock often provides earlier clues about future direction than studying the stock alone. For Eli Lilly, key intermarket influences include interest rates, the U.S. dollar, healthcare sector performance, competitor stocks like Novo Nordisk, and overall market sentiment.
When investors look at Eli Lilly, they often focus on the obvious story: breakthrough obesity and diabetes treatments, surging revenue, and a stock that continues to attract institutional capital. But beneath the surface, Lilly is connected to a much larger network of financial forces. Like every major company, its stock does not trade in isolation. It responds to interest rates, currency movements, economic growth, and healthcare spending trends that collectively shape investor expectations.
Interest rates remain one of the most important variables. Lower rates generally increase the present value of future earnings, which tends to benefit growth companies like Lilly. Investors become willing to pay more today for profits they expect years down the road. Conversely, when rates rise sharply, valuation pressure can emerge across the market. Lilly’s advantage is that its growth is being driven by real demand rather than financial engineering. The market is not simply betting on future possibilities. It is responding to products that are already generating billions of dollars in revenue.
The U.S. dollar also matters. Lilly generates a significant portion of its revenue outside the United States, which means currency fluctuations can influence reported earnings. A stronger dollar can create headwinds when overseas sales are converted back into U.S. currency. At the same time, broader economic conditions remain supportive. Employment remains relatively strong, healthcare spending continues to expand, and demand for obesity and diabetes treatments has exceeded expectations. These forces help explain why Lilly has remained resilient even during periods when the broader market has struggled.
The larger takeaway is that Eli Lilly sits at the intersection of several powerful trends. Interest rates influence valuations. Currency markets influence global earnings. Economic growth influences healthcare spending. Yet among all these variables, the dominant factor remains execution. Lilly continues to bring highly sought-after therapies to market while expanding its leadership position in some of the fastest-growing areas of healthcare. That combination helps explain why the stock has become one of the market’s most closely watched growth stories and why investors continue to view it as a leader rather than a follower.
Here are the 32 key drivers of $LLY price action.
Our Suggestion
The big picture remains remarkably straightforward. Eli Lilly is acting like a market leader. The stock is outperforming the broader market, trading near its 52-week high, maintaining a bullish relationship between the Predictive Blue Line and the simple 10-day moving average, and receiving continued support from a predominantly green Neural Index. Just as importantly, management is executing.
Over the last two earnings calls, Lilly delivered exceptional revenue growth, raised guidance, expanded production capacity, and continued strengthening its position in obesity and diabetes treatments. The evidence suggests institutions are accumulating shares rather than distributing them.
Management appears to be hitting its objectives. The company raised full-year 2026 revenue guidance after Q1, driven by stronger-than-expected performance from Mounjaro and Zepbound. That matters because Wall Street is not merely watching sales. It is watching whether Lilly can keep expanding supply, defending margins, growing internationally, and advancing the next generation of obesity and diabetes drugs.
Management also clearly understands the risks. The two big issues are pricing pressure and execution risk. Lilly specifically acknowledged lower realized prices as a headwind, even while volume growth remained very strong. Traders should respect that. When a stock is priced for excellence, even a small slowdown in demand, pricing, manufacturing expansion, or pipeline progress can become a major market event.
For the bullish thesis to remain intact, several things must continue. Demand for Mounjaro and Zepbound must remain strong. The Predictive Blue Line should remain above the simple 10-day moving average. The Neural Index should continue supporting the prevailing trend. Lilly must continue demonstrating that it can expand manufacturing capacity while advancing its next generation pipeline. Most importantly, management must continue doing what it has done over the last several quarters: exceed expectations. Thus far, management appears confident because it is hitting its objectives. Revenue growth remains extraordinary, guidance has moved higher, and the company’s execution has largely matched or exceeded what Wall Street expected.
The next major test arrives on August 5, 2026, when Lilly reports earnings. Wall Street will be focused on four things: prescription demand, revenue growth, margins, and guidance. Investors will also be looking for updates on future obesity treatments and production expansion. The primary risk is that expectations have become extremely high. When a stock becomes a market favorite, investors demand continued excellence. Any evidence of slowing growth, pricing pressure, manufacturing bottlenecks, or weaker-than-expected guidance could trigger volatility.
The trader’s takeaway is simple. Lilly remains best suited for trend followers, momentum traders, and growth investors who understand that leadership stocks often stay leaders longer than expected. The company’s management team appears confident, understands the competitive and regulatory risks, and continues to execute against its stated objectives. As long as revenue growth remains strong, institutional sponsorship remains visible, and management continues delivering results that exceed expectations, the trend deserves the benefit of the doubt. Strong stocks tend to remain strong until the evidence changes. At the moment, the evidence continues to favor Eli Lilly.
Practice great money management on all of your trades.
Use the Daily Range Forecast to isolate short term trading opportunities.
It’s not magic.
It’s machine learning.
Disclaimer: THERE IS A HIGH DEGREE OF RISK INVOLVED IN TRADING. IT IS NOT PRUDENT OR ADVISABLE TO MAKE TRADING DECISIONS THAT ARE BEYOND YOUR FINANCIAL MEANS OR INVOLVE TRADING CAPITAL THAT YOU ARE NOT WILLING AND CAPABLE OF LOSING.
VANTAGEPOINT’S MARKETING CAMPAIGNS, OF ANY KIND, DO NOT CONSTITUTE TRADING ADVICE OR AN ENDORSEMENT OR RECOMMENDATION BY VANTAGEPOINT AI OR ANY ASSOCIATED AFFILIATES OF ANY TRADING METHODS, PROGRAMS, SYSTEMS OR ROUTINES. VANTAGEPOINT’S PERSONNEL ARE NOT LICENSED BROKERS OR ADVISORS AND DO NOT OFFER TRADING ADVICE.