


This week’s ai stock spotlight is Lumen Technologies ($LUMN)
Lumen is that stubborn telecom zombie that just refuses to stay dead. It lurches forward, trailing decades of mergers, misfires, and misery, still clinging to one of the largest fiber networks on Earth like a washed-up rock band hanging onto its one real hit. And here’s the kicker: that network should make them rich. But instead, they’ve spent years proving that you can own a gold mine and still somehow starve in the gift shop. If management actually pulls off this turnaround, we’re looking at a Lazarus-level comeback trade. If not, well, keep this ticker next to your collection of expired lottery tickets and inspirational quotes.
Once upon a time, in the great age of dot-com dreams and dial-up whines, there existed a telephone company called CenturyLink, headquartered in Louisiana. Over the years they bought other telecom companies, merged networks, acquired broadband lines, and tried desperately to look like the cool kids in Silicon Valley. Then they changed their name to Lumen because nothing says “We’re hip!” like a word you’d find on a candle store gift card.
Lumen today employs about 30,000 people, all of whom presumably wake up every day hoping their company won’t be compared to a rusted dump truck full of unpaid invoices rolling downhill. The CEO, Kate Johnson, is trying to rebuild the business like a homeowner discovering the previous owner wallpapered over mold. She came in promising operational discipline, digital efficiency, and “strategic transformation.” Which are corporate phrases roughly translating to: “We will try to stop lighting money on fire.”
What Lumen does is provide telecommunications services — fiber infrastructure, enterprise networking, broadband, data transport, and business internet solutions. That means they own and operate a gigantic global fiber network. And I do mean gigantic. If fiber-optic acres were farmland, Lumen would be the Monsanto of light beams. Infrastructure nerds drool over their network map like middle-schoolers stare at sneaker drops.
The problem is: owning high-quality infrastructure isn’t the same as running a business that people want to buy things from. Telecom is brutally competitive, with margins
narrower than the attention span of a goldfish. Lumen sells connectivity in a world where everyone assumes the internet just magically appears — like Wi-Fi fairies fluttering around distributing TikTok memes and questionable medical advice.
Debt is the elephant in the room. And this elephant is not cute. It is large, old, cranky, and sitting directly on the coffee table where shareholders used to place their dreams.
What Could Actually Go Right?
The company is doing what any disciplined enterprise must do when faced with the realities of a changing marketplace — getting lean, focused, and forward-looking. It’s selling off non-core assets to pay down debt, a move that signals a return to financial prudence and balance sheet strength. At the same time, it’s doubling down on what drives profits: high-margin enterprise fiber, the backbone of modern digital communication. The leadership understands that efficiency isn’t just a buzzword; it’s a necessity. That’s why costs are being cut aggressively, because every wasted dollar is a dollar not working for shareholders. And make no mistake, they’re not trimming for survival, they’re positioning for growth. The targets are clear and compelling: artificial intelligence, cloud connectivity, and edge infrastructure. These are the growth engines of the modern economy, and by aligning capital with these sectors, the company isn’t just catching up, it’s getting ahead.
This is the zombie trade: the company has the right assets at the exact right time.
What Could Go Terribly Wrong?
The story here is one of mounting pressure and narrowing options, a familiar narrative on Wall Street when execution fails to match ambition. The company’s recurring challenge has been its inability to execute effectively, a theme that has haunted management through several strategic pivots and market cycles. That failure now intersects with growing debt refinancing pressure, as maturities approach in a higher-rate environment that leaves little room for error. Compounding the issue is customer churn, which continues to erode revenue stability and investor confidence alike. The result is a company caught in a tightening vise: rising costs of capital on one side, weakening customer loyalty on the other. Unless management can deliver a credible turnaround plan, the next chapter may involve shareholder dilution — or worse, a restructuring scenario that tests the very foundation of the business.
Lumen is the financial version of an old motel off the interstate. The sign flickers. The paint chips. The pool has been “closed for repairs” since the Obama administration. But the land underneath that motel? It’s right next to the express lane of the digital economy.
This is a speculative turnaround trade.
If the turnaround works → deep value resurrection, shorts panic, price re-rates. If it doesn’t → equity becomes emotional support wallpaper.
No one is buying Lumen because it’s great. They’re buying it because it’s terrible in a way that could become less terrible at exactly the right moment. Monitor revenue growth, enterprise segment momentum, and debt structure like your future depends on it — because in this trade, it does.
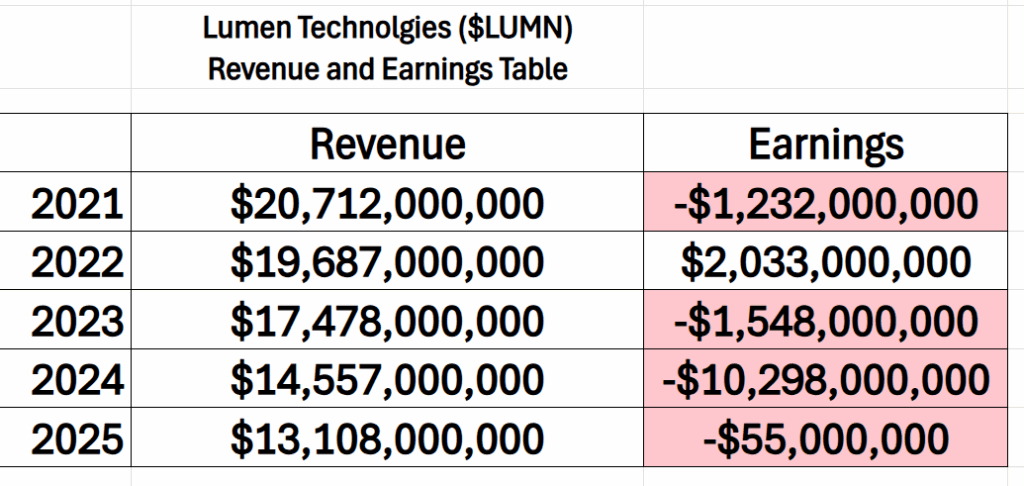
The Revenue and earnings table tells the story in black and white: Over the last 5 years revenue is down 37% and cumulatively over that same time frame $LUMN has lost $11.1 billion. Not exactly confidence inducing.
Lumen just reported its latest earnings, and the whole event felt like watching a very determined but slightly confused marathon runner: technically still moving forward, but everyone is wondering if they’re going to collapse before the finish line. Yes, Lumen beat the official expectations on revenue, and free cash flow. On paper, that looks like winning. But investors didn’t cheer. The stock went down anyway, which tells you the market has trust issues. Beating the numbers matters less when the crowd believes you’re jogging toward a cliff.
Revenue slipped again, down about four percent from last year. That means the company is still shrinking, just shrinking more politely than before. They made about $3.1 billion this quarter, which is a lot of money unless you’re a telecom company that used to make more. Adjusted EBITDA was around $787 million, which is business-speak for “we still make money once you ignore all the messy parts.” And yes, free cash flow improved. This is like discovering you do still have gas money, even after paying all the bills and accidentally driving your car into a mailbox. So that’s the good news.
The real story is that Lumen is trying to reinvent itself. Think of it like your dad deciding he’s going to get in shape and become a surfer now. The company is trying to stop being the old, slow, “we ran your grandma’s phone line” telecom barnacle and become a modern digital infrastructure company powering A.I., cloud computing, and things with names like “edge networking” that make tech people feel shiny inside. They’re selling new services, talking about partnerships, and promoting something called a “Connected Ecosystem,” which sounds like a nature documentary starring Wi-Fi.
But here’s the problem: the old part of the business is still dying. Those legacy services are shrinking faster than the new ones are growing. Lumen calls these segments “grow” and “harvest,” as though the company were a farm. Except right now the harvest field is going bald and the grow field is still being planted. Meanwhile, transforming the business isn’t free. It costs a fortune. And while all of this is happening, there is still a huge pile of debt looming in the background, like a giant elephant sitting in the living room wearing a tank top that says Refinance Me.
Investors didn’t celebrate because they’re not worried about today. They’re worried about the future. They want to know if the company actually can become what it says it’s trying to become, and whether it can do that before the debt gets too heavy, the customers lose patience, and the whole operation starts resembling a yard sale — except instead of selling bicycles and end tables, they’re selling fiber networks and office buildings.
The company insists that it can make the swap from Old Telecom to New Digital Vision Thing. They reaffirmed their guidance for the full year, predicting billions in adjusted earnings and strong free cash flow. This is the corporate equivalent of saying, “Please calm down, we swear we know what we’re doing.” Whether that’s true depends entirely on whether the “grow” businesses start growing faster and the losses stop widening.
So, what does this mean for traders? It means Lumen is not a sleepy investment. It is a proverbial wager. A roll of the dice with a politely worded press release. If you believe the company can finish this transformation, then this could be a comeback story. If not, then it’s more like a history lesson about debt, disappointment, and the dangers of trying to fix the plane while flying it.
In short: hope is still alive, but with $LUMN it’s wearing a helmet.
The indicators we’re using aren’t hunches, guesses, or gut feelings — they’re cold, hard data with a pulse. Every signal comes straight from observed market behavior, not some talking head’s opinion. They’re built on historical probabilities, battle-tested patterns that
repeat because human nature doesn’t change. And behind it all? Machine learning models tuned to spot the turn before it ever makes the headlines. By the time everyone else is reacting, we’ve already seen it coming.
· Wall Street Analysts Ratings and Forecasts
· 52 Week High and Low Boundaries
· Best-Case / Worst-Case Scenario Analysis
· VantagePoint A.I. Predictive Blue Line
· Neural Network Forecast (Machine Learning)
· VantagePoint A.I. Daily Range Forecast
· Intermarket Analysis
· Our Suggestion
Artificial intelligence gives us an anchor — no doubt about it — but it’s not a substitute for good, old-fashioned judgment. Before jumping on any signal, we go back to the basics: the company’s fundamentals, its competitive edge, and the risks that could shake its foundation.
And for $LUMN, that context couldn’t be more important — especially right now. This is a stock where the story behind the numbers matters as much as the numbers themselves.
It’s that deeper perspective that reveals not just what the models are saying, but why they’re saying it. It tells us whether the next move comes from real conviction — or if the market’s just gearing up for another bout of confusion. In a market this dynamic, separating strength from noise is everything, and $LUMN is right at the crossroads.
Wall Street Analysts Forecasts
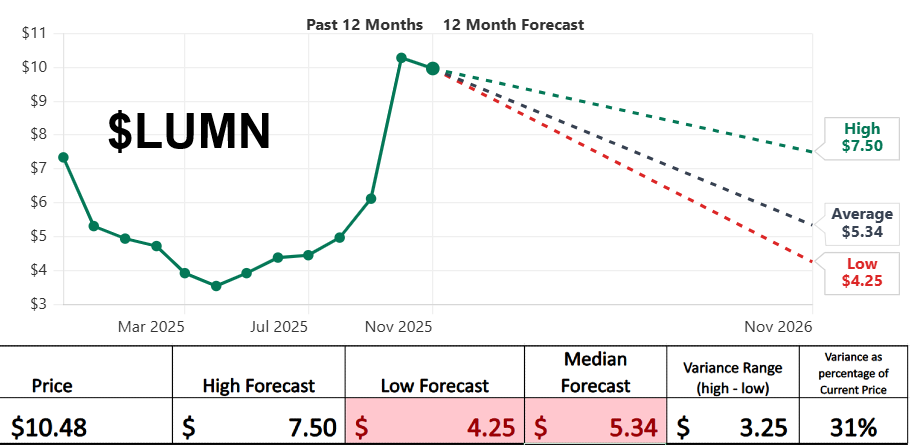
There’s an old saying on Wall Street: “Nobody knows anything.” And looking at this chart, you can practically hear the analysts chanting it in unison, possibly while blindfolded and throwing darts at a pricing board. We’ve got Lumen sitting up here at $10.48, chest puffed out like a pigeon on a statue, and the highest analyst forecast they can muster is… $7.50. That’s almost three bucks lower. Imagine a weatherman predicting winter in July and calling it “reasonable guidance.”
But the real comedy act is in the spread. The optimistic crowd thinks the stock could cozy up just under eight bucks. The pessimists say it could belly-flop down to $4.25. That gap — $3.25 — represents 31% of the current price. If your GPS was off by 31%, you wouldn’t just miss your exit; you’d end up in another state explaining yourself to strangers.
In plain English: analysts are telling us the future of Lumen is anywhere between “respectable discount-bin comeback” and “please avert your eyes.” This isn’t analysis. It’s weather forecasting with a hangover.
The chart doesn’t predict the future. It simply warns: the range of outcomes here is extremely wide. If you’re in this stock, understand what game you’re playing. It’s not chess. It’s not checkers. It’s more like trying to ride a shopping cart down a hill — you might make it.
But you’d better be okay with how it ends.
52 Week High and Low Boundaries
Listen. Everyone says they want to be a smart trader — someone who “reads the market” with the keen eye of a hawk in a wind tunnel. But most traders just chase shiny things. They see a stock move and go, “Hey, that’s going up — lemme hop on!” like a dog spotting a squirrel.
Don’t be that trader.
You want to understand what you’re getting into. Not just the price. Not just the trend. The personality of the stock. The temperament. The way it moves when it gets punched in the face.
Which brings us to this 52-week range situation.
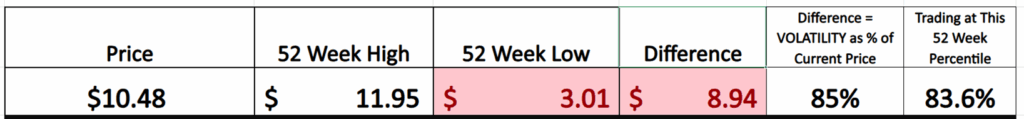
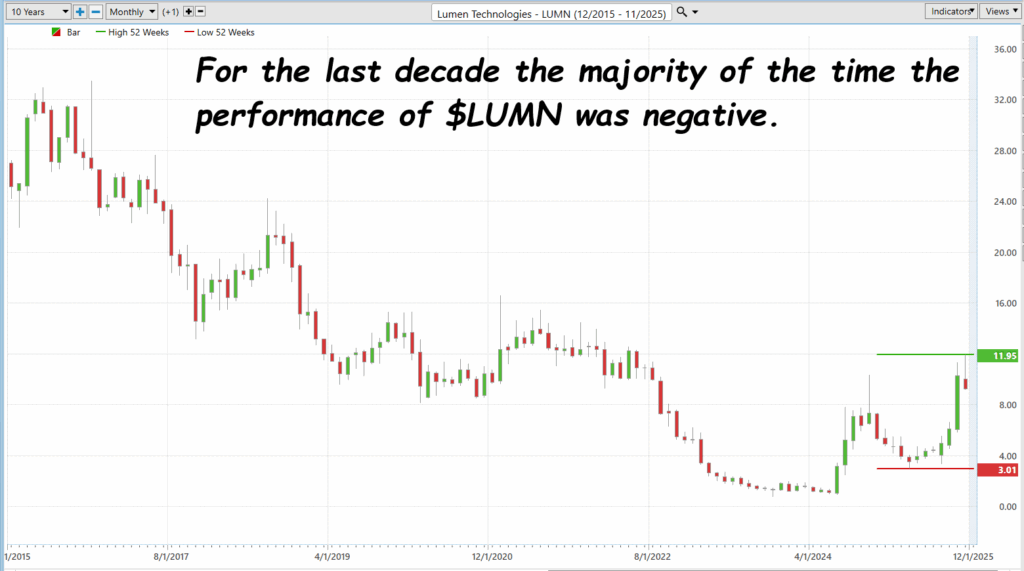
The stock is sitting at $10.48. Over the past year, the high was $11.95 and the low was $3.01.
The difference between high and low? $8.94. Which is 85% of the current price.
Think about that for a second:
If your car could swing 85% from lane to lane, they wouldn’t call you a driver. They’d call you a helicopter rescue incident. This number is your historical volatility.
It tells you: This stock doesn’t walk. It sprints, skids, spins, and sometimes trips over its own shoelaces.
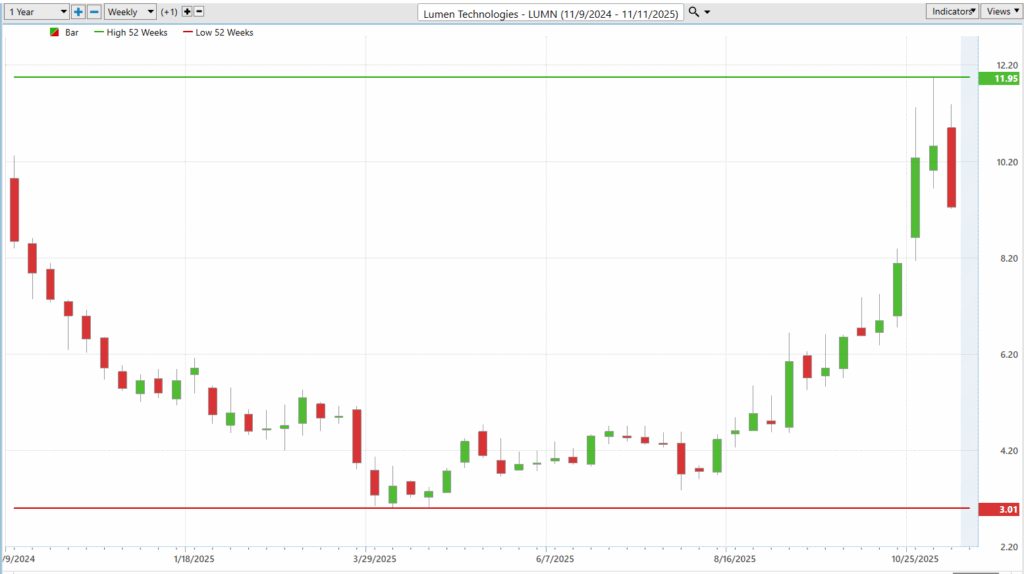
Look at the past year of weekly bars.
For months, this thing looked like a screen door in a hurricane — flopping downward, sideways, wobbling, barely maintaining consciousness. Then suddenly — boom. Somebody plugged it into a light socket. Straight up, like it remembered it had somewhere important to be.
This is why we study the trajectory. Not to admire the shape of the curve like some chart-scented abstract art collector… but to understand how this beast reacts under stress, news, liquidity shifts, earnings cycles, and trader attention.
It was dead. It woke up. And it’s still twitching.
Earlier, we saw that the analyst forecast spread (high vs. low price targets) was $3.25, which was 31% of the current price.
Now we look at the historical volatility (85%).
If the analysts’ future expectations don’t match the actual historical personality of the stock, guess which one we believe?
The past behavior. Because it already happened.
Wall Street can fantasize about “stabilization” all day. But the stock has already shown you: It moves like a caffeinated badger.
Before you decide to trade this thing, ask yourself:
Are you built for an asset that can swing like this?
Because here’s the truth:
Profit comes from volatility. Pain also comes from volatility. The only difference is preparation.
If you size your position wrong? You get eaten alive.
If you size correctly, understand the range, and treat the volatility as the weapon instead of the enemy?
You get to be the one doing the victory lap.
Bottom line: trajectory matters because it reveals both direction and changes in character over time. Yet, while direction is important, historical volatility matters even more, it tells you how intense or unpredictable the ride can become. By comparing historical volatility to expected volatility, traders gain the critical perspective needed to manage risk and avoid becoming tomorrow’s cautionary tale.
Don’t just trade the ticker. Trade the volatility inside the ticker.
For ten long years, $LUMN has been like a ship taking on water — drifting lower, year after year, while investors prayed for a rescue that never came. Every rally turned out to be a mirage, every rebound another tease before the next slide. Now, though, the chart shows something different — a spark, a pulse, maybe even the start of a comeback story. But let’s be honest: Wall Street loves a good redemption arc, especially when it sells hope to the desperate. This could be the moment $LUMN finally turns the corner… or just another clever illusion dressed up as a turnaround.
Best-Case/Worst-Case Scenario Analysis
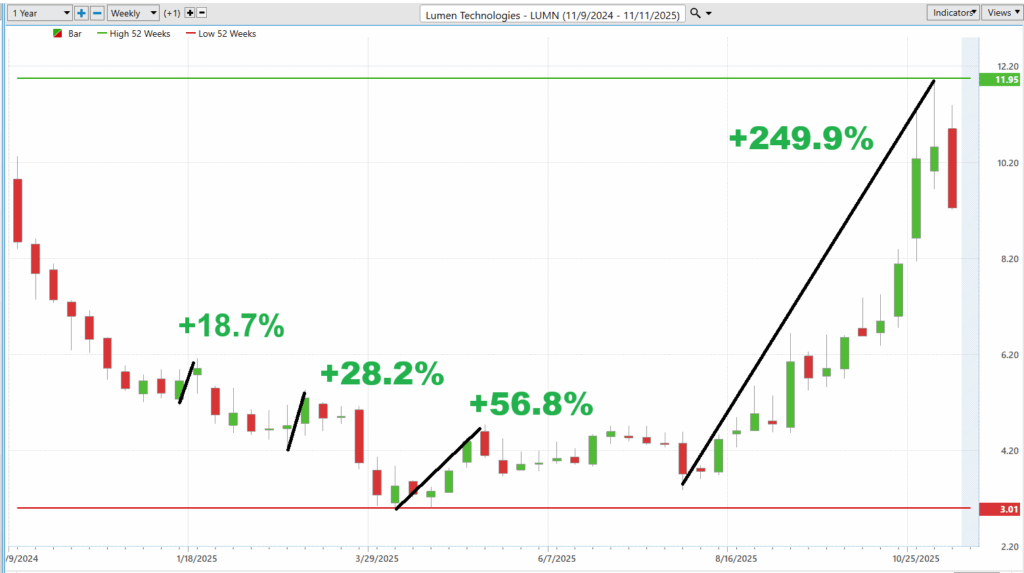
Volatility is one of those concepts that Wall Street loves to complicate — wrapping it in formulas, acronyms, and jargon until the meaning feels buried under a mountain of math. But at its core, volatility is simply about movement — how much an asset can rise or fall within a given time frame. The attached charts strip away the noise and bring the concept back to what really matters: the swings that define a trader’s reality.
In the best case scenario we measure the largest rallies. We see Lumen Technologies (LUMN) at its most optimistic — rallies of +18.7%, +28.2%, +56.8%, and finally a staggering +249.9% surge. These aren’t just numbers; they represent bursts of momentum, driven by speculation, sentiment, and at times, sheer relief. The market doesn’t move in straight lines; it pulses, breathes, and reacts to new narratives. Each of those upswings tells a story of investors betting on a turnaround, seeing value where others see risk.
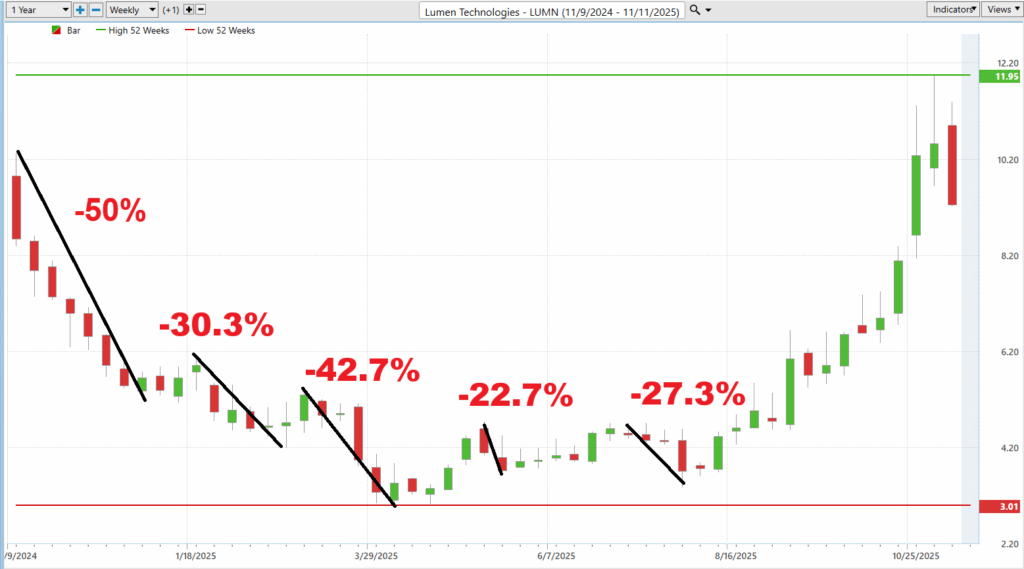
The second Worst-Case Scenario chart, though, reminds us that the ride works both ways. Declines of -50%, -30.3%, and -42.7% paint an equally vivid picture of the emotional and financial cost of volatility. When you put both images side by side, you get the essence of practical risk assessment: the best case and the worst case. Forget the academic definitions — this simple comparison reveals everything a trader or investor needs to know. It tells you how much pain you must endure for the chance of reward — and that, in the end, is what volatility is all about.
Here’s where the rubber meets the road. Once we’ve measured the swings, the emotional highs and the gut-punch lows — the next logical step is to stack $LUMN up against the broader market. And that’s exactly what this chart does. It’s not just a scoreboard; it’s perspective.
Look closely. Over the past six months, $LUMN has ripped 110.23% higher, outpacing the Nasdaq’s 25.44%, the S&P 500’s 17.15%, and even the Dow’s 13.01%. Year-to-date, the stock’s up 74.20%, while the big indexes are still jogging by comparison. Even on a monthly basis, $LUMN shows a solid 37.04%, leaving the rest of Wall Street looking like they’re standing still.
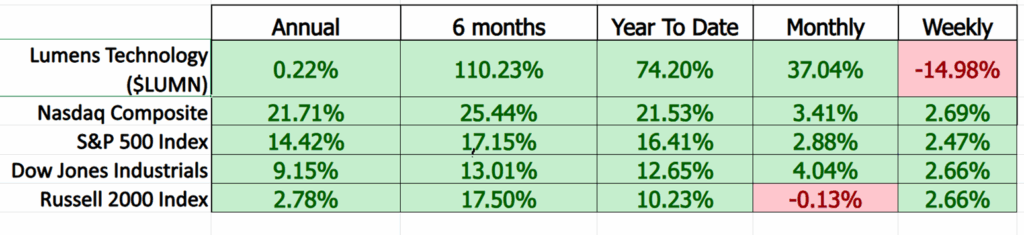
But here’s the kicker — look at that weekly column. Down -14.98%. That’s what volatility feels like in real time. You can’t have triple-digit gains without taking a few punches along the way. This snapshot reminds us that performance isn’t just about wins; it’s about surviving the pullbacks. In other words, if you’re going to dance with a fast mover like $LUMN, you better know the rhythm.
Vantagepoint A.I. Predictive Blue Line
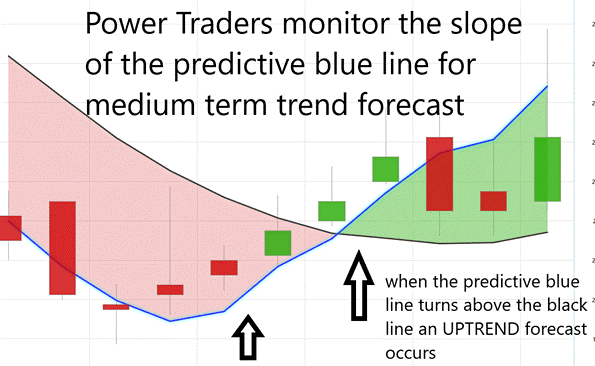
The VantagePoint A.I. Predictive Blue Line is not just another moving average, it’s a dynamic signal born from machine learning, designed to adapt as the market evolves. At its core, the Blue Line represents a forward-looking forecast of value, integrating intermarket data — currencies, commodities, interest rates, and correlated equities — to anticipate where price is likely to move next. It’s less about reflecting what has happened and more about predicting what comes next. That’s a subtle but powerful distinction — one that turns traditional technical analysis on its head.
When interpreting the Blue Line, the rulebook is refreshingly straightforward. If the predicted Blue Line crosses above the actual price, the trend is shifting higher. That’s the market’s way of whispering, “momentum is building.” Conversely, when the Blue Line dips below the actual price, it’s a warning shot — a signal that sentiment and probability are beginning to tilt lower. The key is consistency. Traders don’t chase every flicker of movement; they watch for sustained separations between the predicted and actual lines to confirm that a true directional shift is underway.
Trend identification, then, becomes a matter of discipline. The Blue Line isn’t about guessing tops or bottoms — it’s about aligning with the prevailing probability. When the predictive line rises steadily above price, the message is clear: stay with the uptrend until the data says otherwise. When it falls, step aside or consider the short side. In a world
where information overload often leads to indecision, the VantagePoint A.I. Predictive Blue Line cuts through the noise. It doesn’t promise perfection — but it does offer what every trader craves: a statistically grounded edge in a market built on uncertainty.
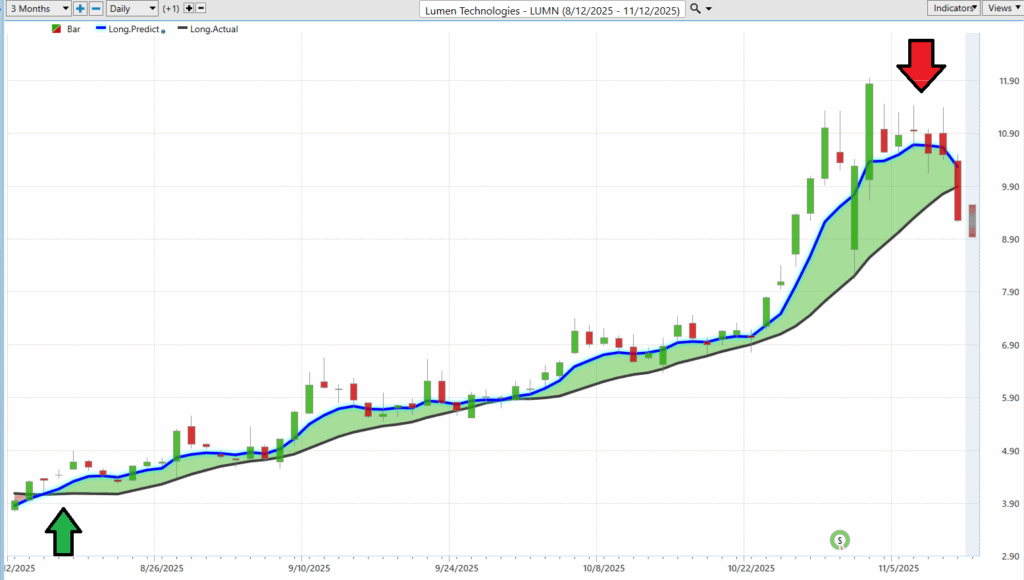
For short-term swing traders, the VantagePoint A.I. Predictive Blue Line provides a remarkably clear picture of where value is shifting before the market fully reacts. In this chart of Lumen Technologies ($LUMN), the blue line represents the predictive moving average—an adaptive signal generated from intermarket data. When the Blue Line rises above the actual price (highlighted by the green arrow), it marks the beginning of an upward shift in probability. Traders interpret this as a green light to align with the trend, not by chasing momentum, but by entering near points of value — when price retraces close to that blue predictive line. It’s less about guessing tops and bottoms, and more about participating in the middle of a move — where consistency lives.
As the chart progresses, the separation between the Blue Line and the actual price becomes a visual cue of strength — momentum accelerating as confidence builds. But near the red arrow, we see a clear inflection: the Blue Line flattens, and price begins to fall beneath it. For swing traders, that’s not panic — it’s information. The trend is losing steam, and what was once value may now be risk. This is where disciplined traders reassess: either take profits, tighten stops, or prepare for the next signal. In a world obsessed with noise and news, the Predictive Blue Line simplifies the task — it helps traders define value in real time and respond to change with data, not emotion.
VantagePoint A.I. Neural Index (Machine Learning)
Imagine, for a moment, a trading system that doesn’t just look at price, it thinks about it. That’s what a neural network does. It’s the market’s version of a brain — one that learns patterns, adapts to new information, and spots connections that human traders often miss. Each “neuron” in that network takes in data—price, volume, interest rates, even correlations with other markets—and passes it along to the next layer.
A neural network is basically a computer trying to think like a human — minus the bad habits, caffeine, and emotions. It’s built from layers of digital “neurons,” each one passing information to the next, like a chain of traders whispering hot tips — but these ones learn from their mistakes. Over time, the network starts to recognize patterns that no single person could ever keep straight — price behavior, momentum shifts, intermarket ripples — the whole noisy mess.
What makes it special is that it doesn’t follow rules; it finds them. A neural network teaches itself what matters by running the data over and over again until it can say, “Hey, this setup usually leads to a breakout,” or “That combination tends to end in a pullback.” It’s not magic, it’s math with intuition. And for traders, that’s the closest thing to having a co-pilot who’s been watching every chart on Wall Street, twenty-four hours a day, for decades straight.
Like the neurons firing in your head, each connection strengthens or weakens based on experience. Over time, the network becomes smarter, faster, and eerily good at spotting when momentum shifts before it’s obvious to everyone else.
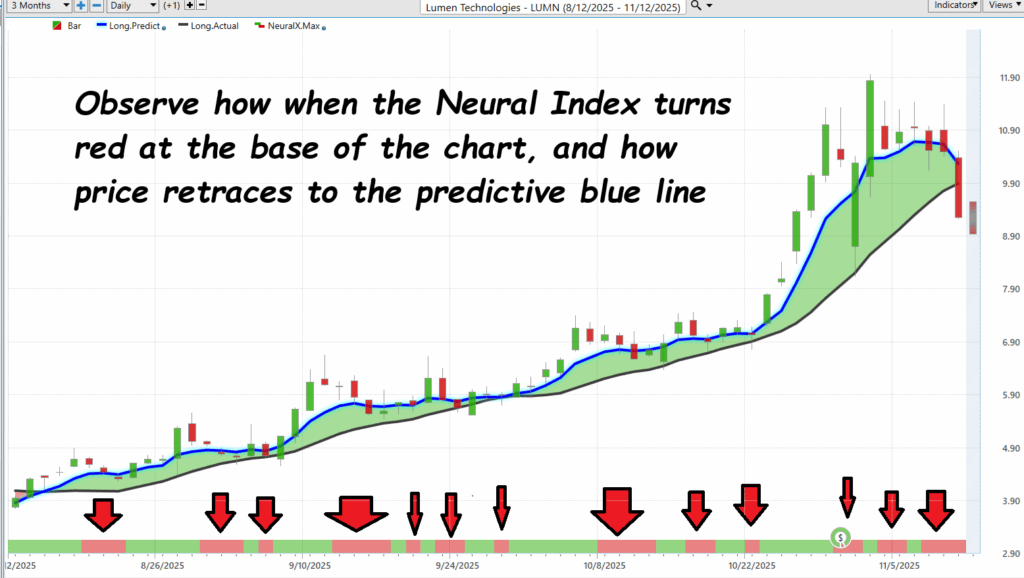
Now, look at this chart of Lumen Technologies ($LUMN). Those red and green bars at the bottom? That’s the neural index — its way of signaling short-term shifts in market momentum. When it flips from red to green, it’s like the network tapping you on the shoulder and saying, “Hey, the odds just changed.” And that’s the magic: it’s not predicting the future — it’s adjusting probabilities based on how thousands of interlocking variables interact. The goal isn’t to eliminate risk; it’s to make better decisions, faster. Think of it as having a second set of eyes on the market — ones that never blink, never sleep, and are always recalculating what comes next. For traders with short attention spans and shorter time horizons, that kind of edge is gold.
VantagePoint A.I. Daily Range Forecast
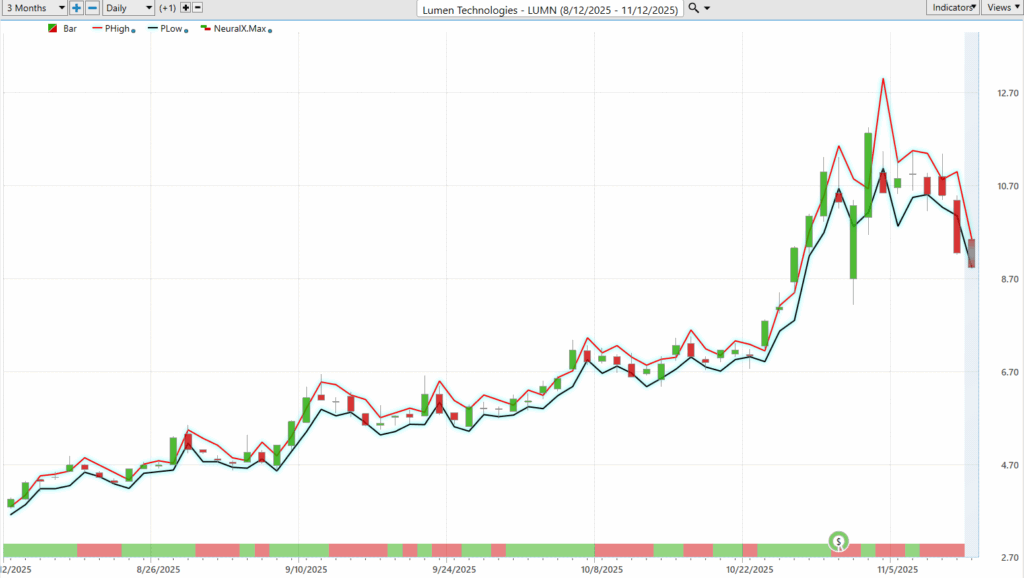
When $LUMN decides to move, it doesn’t ease into it like a polite guest at a cocktail party; it kicks down the door and makes an entrance. The data doesn’t lie — a 6.5% average daily trading range, 16% weekly, and a staggering 32.6% monthly. That’s velocity. It means traders can wake up rich or wrecked depending on whether they respected the range. Look at the chart — those tight red and black lines show the VantagePoint A.I. Daily Range Forecast, wrapping around each candle like guardrails on a mountain road. Step outside them without a plan, and you’re not trading — you’re gambling.

Here’s what separates pros from tourists: process. Every trader wants the same thing — a repeatable system that defines risk and opportunity before the chaos hits. That’s
exactly what this forecast can deliver. It doesn’t just predict where price might go; it draws the battlefield for you — the likely high, the probable low, and the danger zone in between. That’s not theory; it’s practical, actionable intel. Because in a market like $LUMN, if you don’t know your limits before the bell rings, the market will define them for you — in red ink.
The market doesn’t care about your expectations, it only rewards your awareness of reality. Great trading isn’t about predicting the future or clinging to hope; it’s about reading the room, taking what the market gives you, and leaving before the music stops. Every trend, every setup, every signal has a shelf life, and the traders who thrive are the ones who know when enough is enough. In the end, the market isn’t generous or cruel; it’s simply honest. It tells you what’s possible every day — you just have to be wise enough to listen and disciplined enough to take it.
Intermarket Analysis
Intermarket analysis, in plain English, is how smart traders connect the dots. It’s like watching how a thunderstorm over one town can change the wind in another. In the markets, everything is connected — stocks, bonds, commodities, and currencies all move in their own rhythm, but they influence each other constantly. When interest rates rise, money gets more expensive. When oil jumps, shipping costs soar. When the dollar climbs, exports slow. So, a good trader doesn’t just stare at one chart, they zoom out and see the bigger picture. That’s what intermarket analysis is: understanding how one part of the
economy pushes or pulls on another so you can be one step ahead when the storm changes direction.
Now let’s put that into practice with Lumen Technologies ($LUMN). The stock’s been on a wild ride — up big when the A.I. buzz hit, now back near $9 after a Citi downgrade. Here’s what’s driving it: when bond yields go up, $LUMN usually goes down. Why? Because the company’s carrying $18 billion in debt, and higher rates make that mountain more expensive to manage. When the Fed pauses or cuts rates, traders cheer, and the stock can bounce hard. On the flip side, tech stocks are its best friends — when companies like NVIDIA or Amazon rally, LUMN often gets an even bigger boost since it sells the fiber that powers their data centers. Oil prices matter too — higher energy costs can hurt profits — but stable copper prices actually help, since copper is used to build the networks. Finally, the U.S. dollar doesn’t move the needle much for now, since most of LUMN’s business is in the States.
For traders, the setup is simple: buy when yields drop and A.I. demand heats up, especially near $9. If rates rise again, don’t hang around — get out before the market tells you to. That’s the way to think about intermarket analysis, connect the forces, respect the trends, and never forget that every price move has a reason written somewhere else in the economy.
Here are the 31 key drivers of price for $LUMN.
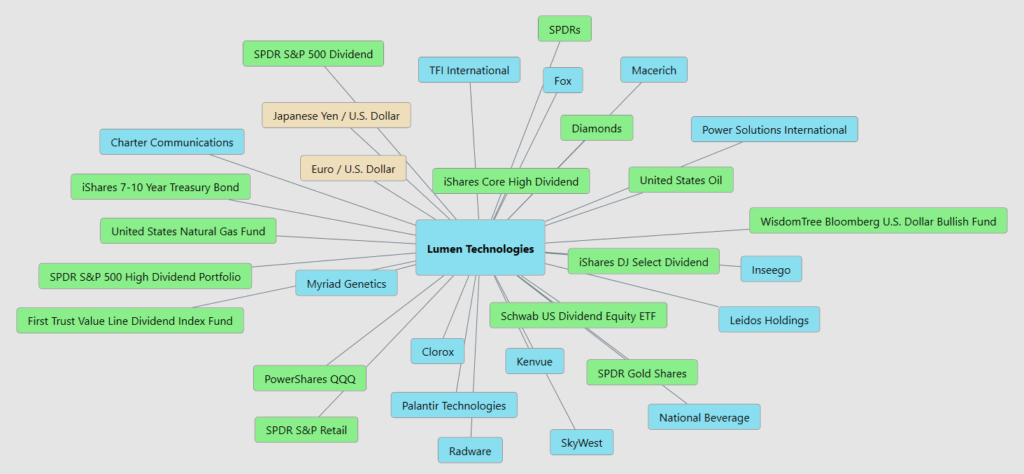
What you’re looking at here is the bigger picture behind Lumen Technologies ($LUMN), the web of forces that quietly push and pull on its price every single day. This is the heartbeat of intermarket relationships. When bond yields move through the iShares 7–10 Year Treasury Bond, it ripples straight into Lumen’s debt load. When oil and natural
gas spike, it pressures costs. The U.S. dollar, reflected here through ETFs like the WisdomTree Bloomberg U.S. Dollar Bullish Fund, shapes competitiveness and investor appetite. Then you’ve got the equity side — the SPDR S&P 500 Dividend, Schwab US Dividend ETF, and even tech names like Palantir — all swimming in the same current of risk-on or risk-off sentiment. What this chart tells you, plain and simple, is that Lumen doesn’t move alone. It’s part of a living ecosystem of assets and signals. Understand those connections, and you stop trading in the dark — you start trading with the market’s rhythm.
Our Suggestion
Lumen Technologies’ last two earnings calls revealed a company deep in reconstruction mode. Under CEO Kate Johnson, the mission is clear: tear out the rot, modernize the foundation, and stop lighting money on fire.
The Q2 results showed just how much work remains, revenue slipped to $3.09 billion, losses widened to $915 million, and cash flow turned negative as legacy telecom services continued to erode. Yet there were early steps toward triage: the planned $5.75 billion sale of its fiber-to-home business to AT&T, ongoing cost-cutting, and refinancing moves to push debt maturities further out. By Q3, Johnson’s message shifted from survival to progress. Lumen reported a modest improvement and a surprising $1.6 billion in free cash flow, aided by strong enterprise fiber demand and over $1 billion in new private connectivity deals.
Still, this is less a turnaround than a renovation. The company’s “strategic transformation” is an admission that it inherited a structure built on outdated services, bloated costs, and more than $18 billion in debt. Johnson’s talk of “operational discipline” and “digital efficiency” translates into a simple reality: fix the leaks before chasing growth. Refinancing efforts have trimmed interest expenses by about $135 million annually, but profitability remains elusive, and the balance sheet continues to creak under leverage. Each quarter is a balancing act between funding new opportunities in A.I.-driven enterprise networking and managing the slow bleed of its legacy business lines.
The challenge now is endurance. Lumen’s future depends on whether it can stay solvent long enough for the transformation to bear fruit. Free cash flow improvements and new contracts are encouraging, but the debt clock is still ticking, and investor patience has limits. Johnson has exposed the mold and started the rebuild; what remains to be seen is whether the repairs can make the house livable again — or whether the structure gives way first. In the end, Lumen’s story hinges on one simple test: can this company become profitable and restructure its debt before time runs out?
Place $LUMN on your trading radar. It will create numerous trading opportunities in the months ahead. Use the VantagePoint A.I. Daily Range Forecast for short-term trading opportunity analysis.
Practice great money management on all your trades.
Let’s Be Careful Out There.
Disclaimer: THERE IS A HIGH DEGREE OF RISK INVOLVED IN TRADING. IT IS NOT PRUDENT OR ADVISABLE TO MAKE TRADING DECISIONS THAT ARE BEYOND YOUR FINANCIAL MEANS OR INVOLVE TRADING CAPITAL THAT YOU ARE NOT WILLING AND CAPABLE OF LOSING.
VANTAGEPOINT’S MARKETING CAMPAIGNS, OF ANY KIND, DO NOT CONSTITUTE TRADING ADVICE OR AN ENDORSEMENT OR RECOMMENDATION BY VANTAGEPOINT AI OR ANY ASSOCIATED AFFILIATES OF ANY TRADING METHODS, PROGRAMS, SYSTEMS OR ROUTINES. VANTAGEPOINT’S PERSONNEL ARE NOT LICENSED BROKERS OR ADVISORS AND DO NOT OFFER TRADING ADVICE.


