





This week’s AI stock spotlight is Marathon Petroleum Corporation
Marathon Petroleum was born in 2011 when it was spun off from Marathon Oil with a singular mission: focus exclusively on refining, fuel distribution, and energy infrastructure rather than searching for new oil reserves. That strategy accelerated dramatically with the transformative acquisition of Andeavor in 2018, creating one of the largest independent refining companies in the United States. Today, the company operates an expansive network of refineries supported by the stable cash flows of its MPLX midstream business, giving it both scale and resilience. Its importance extends well beyond Wall Street because nearly every gallon of gasoline pumped, every commercial flight taken, and much of the freight moved across America relies, in one way or another, on Marathon Petroleum’s infrastructure. When energy markets move, Marathon is rarely watching from the sidelines. It is usually one of the companies helping determine where the market goes next.
Marathon Petroleum isn’t in the business of predicting the future. It is in the business of turning crude oil into products people can’t seem to stop buying. That’s refreshingly practical. Politicians argue about energy policy. Economists debate recessions. Television pundits invent colorful adjectives for oil prices. Meanwhile, Marathon quietly processes millions of barrels every day and sends gasoline, diesel, jet fuel and other products wherever demand shows up. Markets love companies that make themselves indispensable, even if nobody sends them Valentine’s cards.
Marathon Petroleum is America’s largest independent refiner. Its business revolves around three major engines. The Refining & Marketing division buys crude oil, refines it, and sells gasoline, diesel, jet fuel and other petroleum products. MPLX, its midstream partnership, owns pipelines, storage facilities and logistics assets that collect relatively stable fee income. The Renewable Diesel segment is smaller but positions the company for changing environmental regulations and evolving fuel markets.
Most of the money still comes from refining. That surprises many investors because pipelines often receive the headlines for stability. Refining remains the elephant in the room. Crack spreads, refinery utilization, and fuel demand determine whether earnings resemble a printing press or a garage sale.
Its customers are wholesale fuel distributors, airlines, trucking companies, industrial users, convenience store operators, and thousands of retail fuel outlets. Headquarters remain in Findlay, Ohio. The company employs roughly 18,500 people and is led by CEO Maryann Mannen. Major competitors include Valero, Phillips 66 and HF Sinclair. Marathon generally enjoys a leadership position because of its enormous scale, geographic diversity and integrated logistics network.
The financial statements tell an interesting story. Revenue has declined from the extraordinary post-pandemic energy boom, but that doesn’t automatically signal weakness. Refiners live in a cyclical business where margins matter far more than headline revenue. A refinery can generate less revenue while producing much better shareholder returns if refining margins improve and capital allocation remains disciplined.
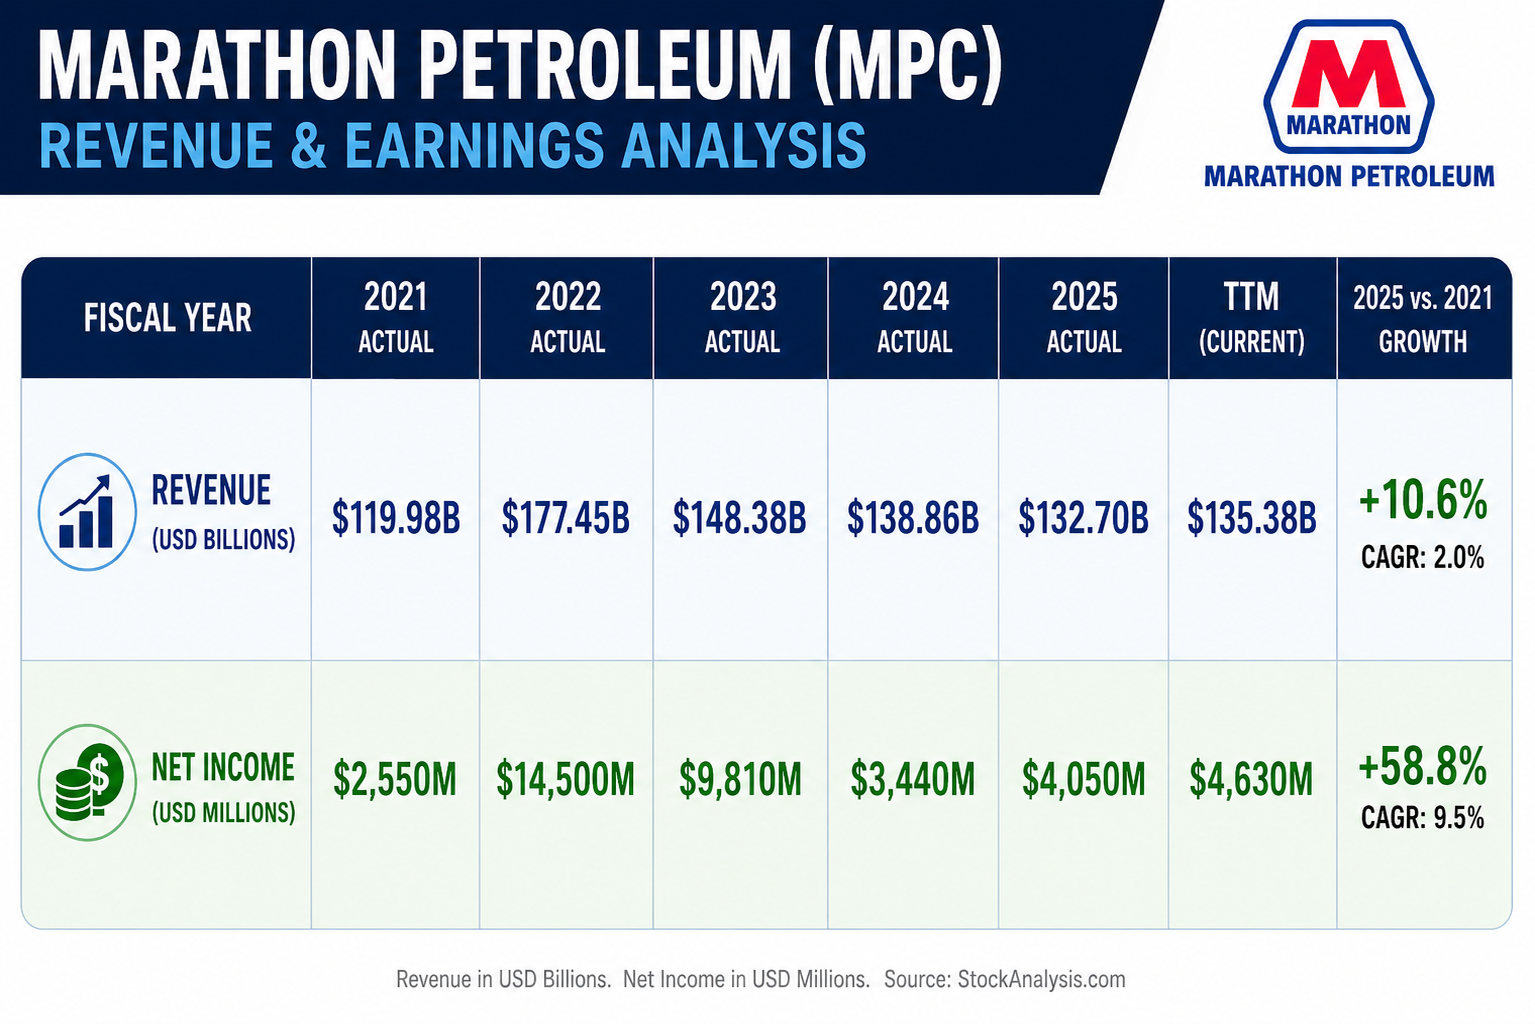 Marathon Petroleum’s financial story is one of normalization, not deterioration. The extraordinary profits generated during the post-pandemic refining boom have naturally moderated, but the business continues to produce enormous revenue, solid earnings, and significant cash flow. Revenue has remained remarkably resilient above the $130 billion mark despite a less favorable energy pricing environment, while net income has stabilized after the record-setting results of 2022. That is an important distinction for traders. Refiners are cyclical businesses, and comparing today’s results to the industry’s most profitable year can create the false impression that the company is struggling. In reality, Marathon remains one of the strongest cash-generating refiners in North America, supported by disciplined capital allocation, a valuable midstream business, and an aggressive share repurchase program. The broader message from these financials is straightforward. The extraordinary boom may be behind the company, but its ability to consistently generate billions of dollars in annual earnings remains very much intact, providing investors with a far stronger foundation than headline revenue numbers alone might suggest.
Margins have normalized from the spectacular levels seen after Russia’s invasion of Ukraine disrupted global energy markets. Cash generation remains healthy. Capital expenditures remain substantial because refineries are enormously expensive industrial machines that occasionally behave like teenagers. Ignore them for too long and they’ll remind you who’s actually in charge.
Many traders misunderstand Marathon’s finances because they focus almost entirely on oil prices. Refiners don’t simply bet on higher crude prices. Sometimes lower crude prices actually improve profitability if refined fuel prices remain firm. Marathon’s business depends on the spread between input costs and selling prices, not simply whether crude oil is rising or falling.
Right now traders are asking two questions.
The first is whether refining margins have entered another sustained upcycle. Strong gasoline demand, disciplined refinery capacity and healthy diesel consumption have supported margins better than many analysts expected. If those margins stay elevated, earnings estimates may continue drifting higher.
The second question is whether capital returns can continue. Marathon has become one of Wall Street’s most aggressive buyers of its own shares while steadily raising its dividend. Investors want to know whether that shareholder-friendly strategy continues through the next refining cycle.
The biggest company-specific news during the past month has been relatively quiet, which is often good news.
What’s already priced in is the expectation of solid refining economics and continued shareholder returns. What may not be fully appreciated is how disciplined the entire refining industry has become. For years refiners destroyed capital chasing production growth. Today they appear much more interested in returning cash than building unnecessary capacity.
Wall Street sometimes misses that refining is becoming a business of scarcity. Very few companies are building massive new refineries in the United States. Existing assets become more valuable when supply remains constrained while fuel demand stays resilient.
The stock has rallied over the past 90 days because investors have grown increasingly confident that refining margins would remain stronger than originally feared. Stable fuel demand, healthy utilization rates, and improving earnings expectations have supported the advance. At the same time, aggressive share repurchases continue shrinking the share count, making each remaining share more valuable.
Year to date, Marathon has also benefited from broader strength across the energy sector. The Energy Select Sector SPDR ETF has been one of the market’s stronger-performing sectors, helped by resilient oil prices and improving cash flows across the industry. Marathon has generally outperformed many peers because investors appreciate its combination of refining leverage and stable midstream income. Sector strength opened the door. Execution allowed Marathon to walk through it.
Some analysts assume refining profits must inevitably collapse because they always have before. History supports caution, but history also reminds us that every cycle looks different. Supply constraints, years of underinvestment and stricter environmental regulations have changed the industry’s economics more than many traditional valuation models acknowledge.
That doesn’t mean optimism should become religion.
The biggest downside risk is surprisingly simple. Demand weakens while crude costs remain elevated. Suddenly refiners get squeezed from both directions. Markets have an unpleasant habit of discovering this only after stocks have already fallen.
The biggest blind spot is assuming that yesterday’s energy narrative automatically predicts tomorrow’s. Refining remains one of the most cyclical businesses on Earth. Investors often extrapolate temporary conditions far into the future, right before reality introduces itself.
Three major catalysts deserve every trader’s attention.
August 4, 2026: Second-quarter earnings release. This will reveal refining margins, throughput volumes and management’s outlook for the second half of the year.
Late October or Early November 2026: Third-quarter earnings. Traditionally one of the industry’s most important seasonal updates as investors assess winter fuel demand.
Any major OPEC production announcement or significant geopolitical disruption: These events have no fixed calendar, but they frequently reshape crude prices and refining economics within hours.
Marathon Petroleum is best suited for traders who understand that commodity stocks don’t move because television personalities become excited. They move because supply, demand and margins quietly change underneath everyone else’s conversation.
For the current trend to continue, refining margins must remain healthy, fuel demand needs to stay resilient, and management must continue returning meaningful cash to shareholders through dividends and buybacks. Those are measurable facts, not motivational posters.
The earliest warning sign would be shrinking crack spreads combined A crack spread is the difference between the cost of crude oil and the selling price of the refined products made from that oil, primarily gasoline and diesel.with weakening refinery utilization and deteriorating free cash flow.
When refiners stop printing cash, the market usually notices long before the headlines do.
Marathon Petroleum has spent years proving that sometimes the smartest business model is astonishingly boring. Buy crude. Make fuel. Run the assets well. Return cash. Repeat.
It may not make for great Hollywood movies.
But it has made for a remarkably effective stock.
The following are the indicators and forecasts that we will use in this stock study to better comprehend the price action of $MPC.
Wall Street Analysts Ratings and Forecasts
52-Week High and Low Boundaries
Best-Case / Worst-Case Scenario Analysis
VantagePoint AI Predictive Blue Line
Neural Network Forecast (Machine Learning)
VantagePoint AI Daily Range Forecast
Intermarket Analysis
Our Suggestion
Wall Street Analysts Price Forecasts
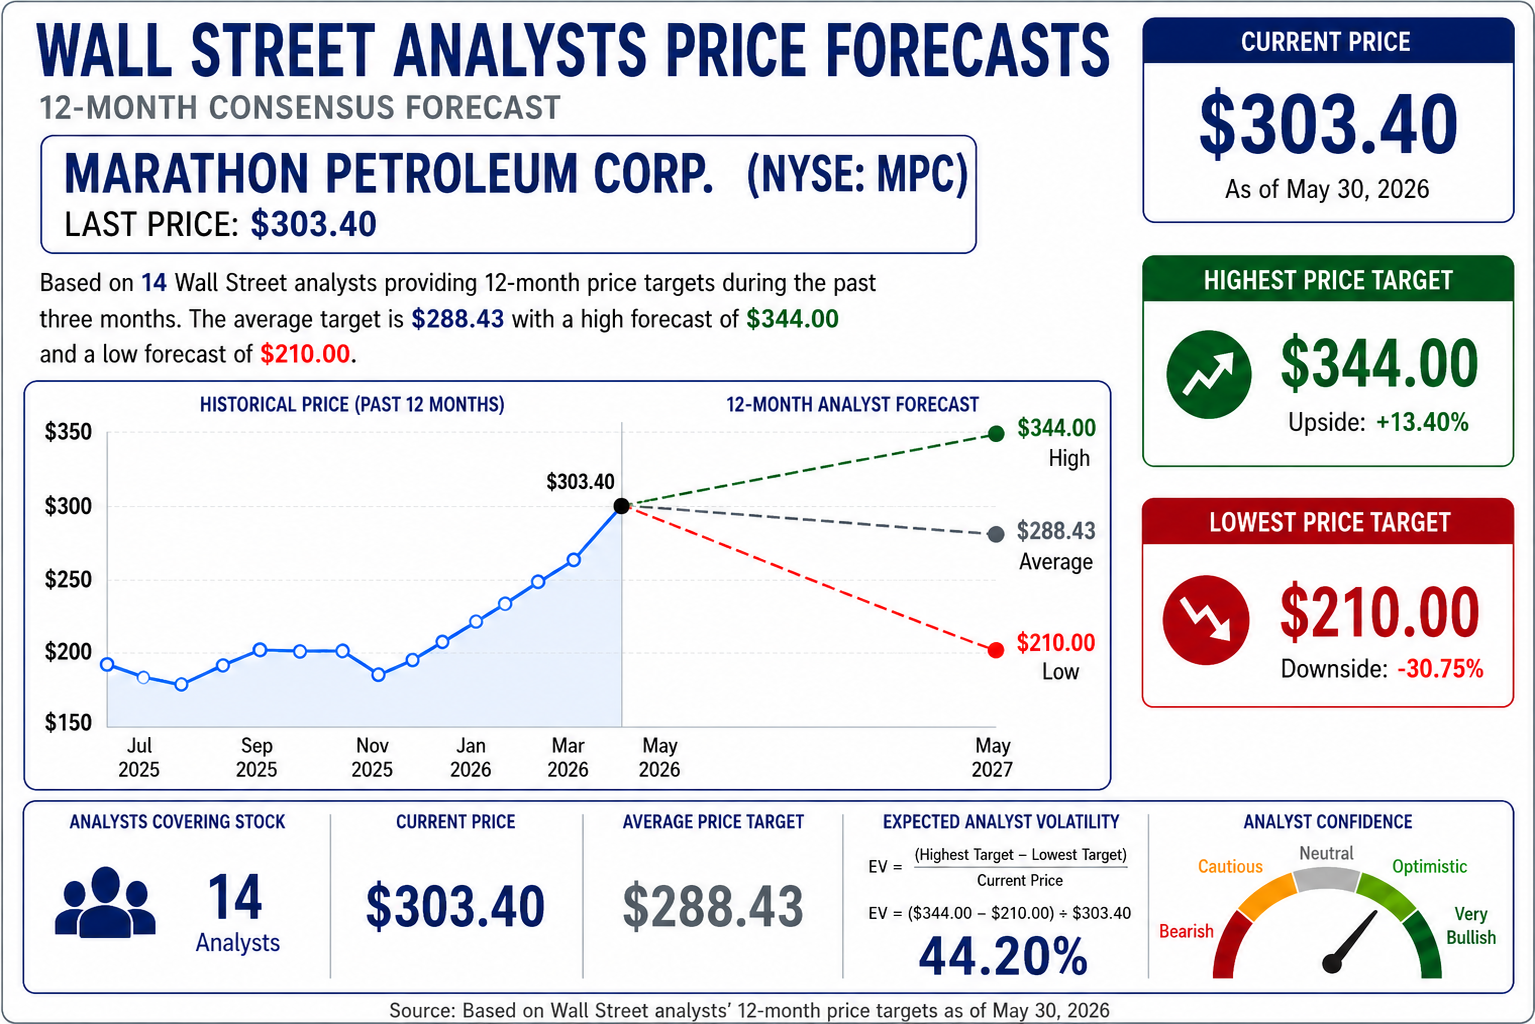
Wall Street analysts have delivered one of those forecasts that deserves admiration for its confidence and suspicion for its arithmetic. Fourteen analysts collectively expect Marathon Petroleum to average $288.43 over the next twelve months, about 4.3% below the current price of $301.00. Yet that same group also believes the stock could climb to $344.00, a respectable 14.3% upside, while the most pessimistic analyst sees it falling to $210.00, roughly 30% lower. That’s not so much a forecast as a polite admission that the future remains stubbornly attached to reality.
The interesting takeaway isn’t the average target. Average price targets are the financial equivalent of saying tomorrow’s weather will be “comfortable.” Nobody trades the average. Markets move toward surprises. What matters is the remarkably wide spread between the highest and lowest estimates. An expected analyst volatility of roughly 44.5% tells you that even the professionals who study Marathon Petroleum for a living cannot agree on where refining margins, fuel demand, and energy prices are headed.
That disagreement is exactly why the stock deserves attention. Marathon Petroleum doesn’t operate in a business where outcomes drift gently from point A to point B. It lives in a world where crack spreads, refinery utilization, OPEC decisions, hurricane season, and consumer demand can change the earnings picture far faster than spreadsheets can keep up. Analysts aren’t really arguing about the company. They’re arguing about the future of the energy cycle.
Ironically, the stock itself has already voted. Marathon Petroleum has climbed to $301, trading above the consensus target. That usually tells you one of two things. Either investors have become too optimistic, or analysts are still catching up to improving fundamentals. History suggests Wall Street analysts often spend more time explaining yesterday than predicting tomorrow. Traders should remember that price is the final vote. Analyst targets are merely opinions, and opinions have never once rung the opening bell.
52-Week High and Low Boundaries
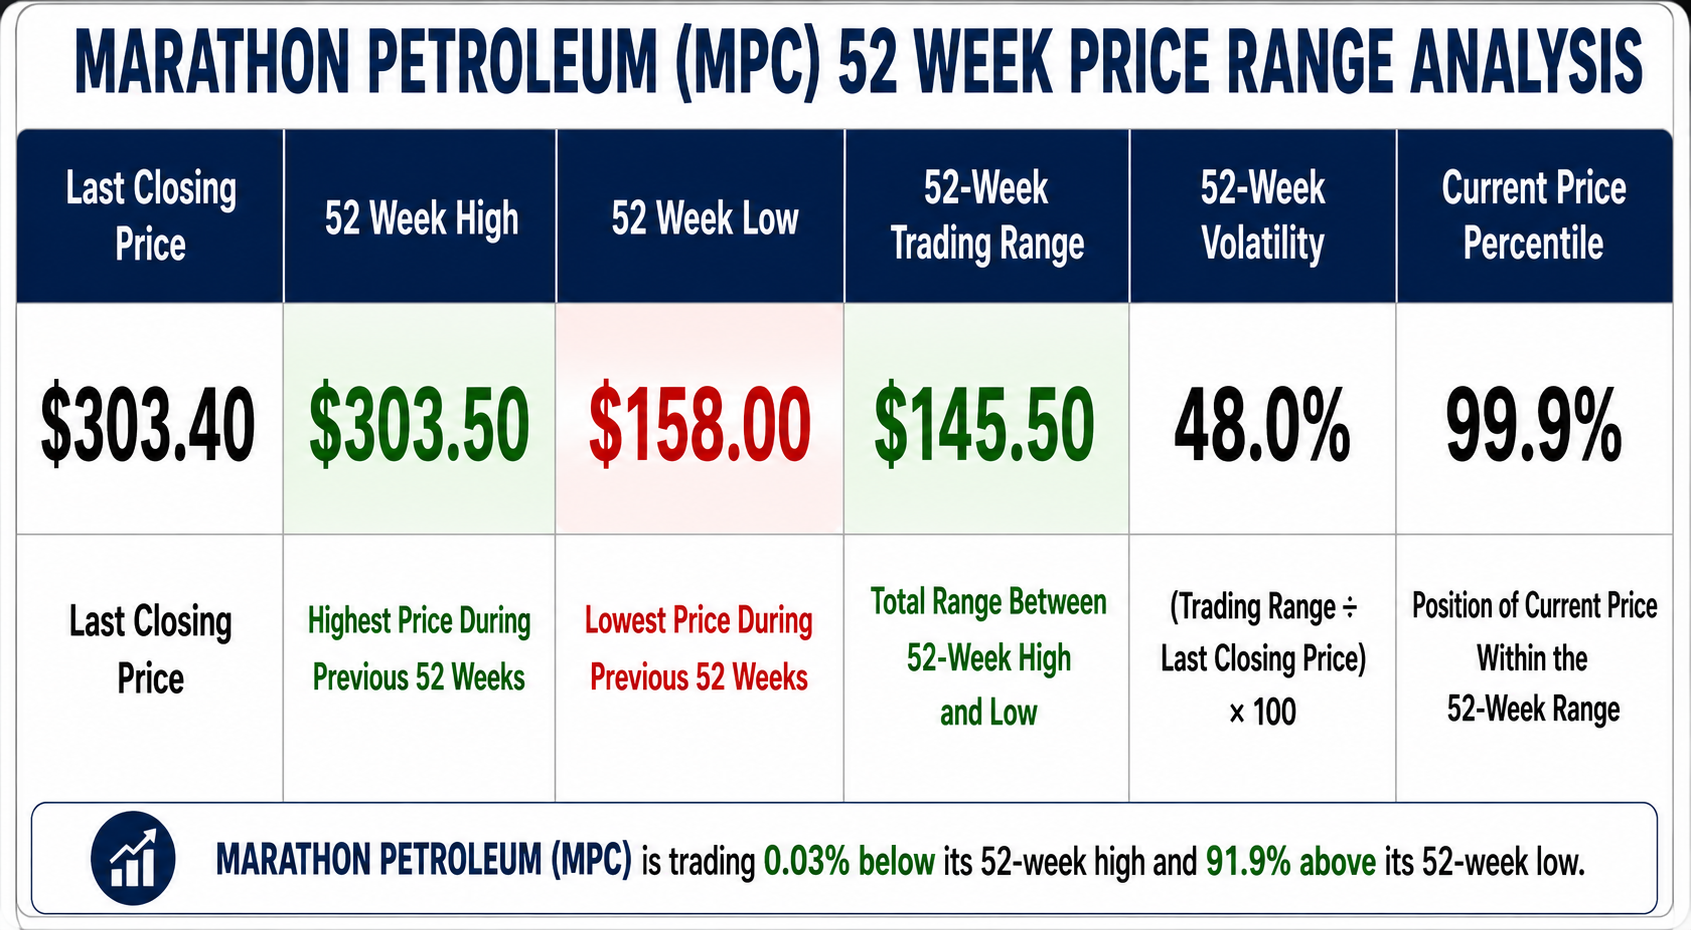
Every trader eventually learns a simple truth. Stocks spend far more time wandering than they do making history. Marathon Petroleum isn’t wandering. At $303.40, the stock sits just ten cents below its 52-week high of $303.50, placing it in the 99.9th percentile of its entire one-year trading range. That’s about as close to the summit as a stock can get without planting a flag. The message from the market is unmistakable. Buyers remain in control.
The numbers tell an even bigger story. Over the past year, Marathon has traveled from a 52-week low of $158.00 to its current level, creating a $145.50 trading range, or roughly 48% of the current stock price. That isn’t random volatility. It’s evidence of a company that has steadily attracted institutional capital while overcoming every bout of profit-taking along the way. Strong trends rarely move in straight lines. They climb a wall of worry, pause, consolidate, and then challenge new highs again. Marathon’s chart fits that script remarkably well.
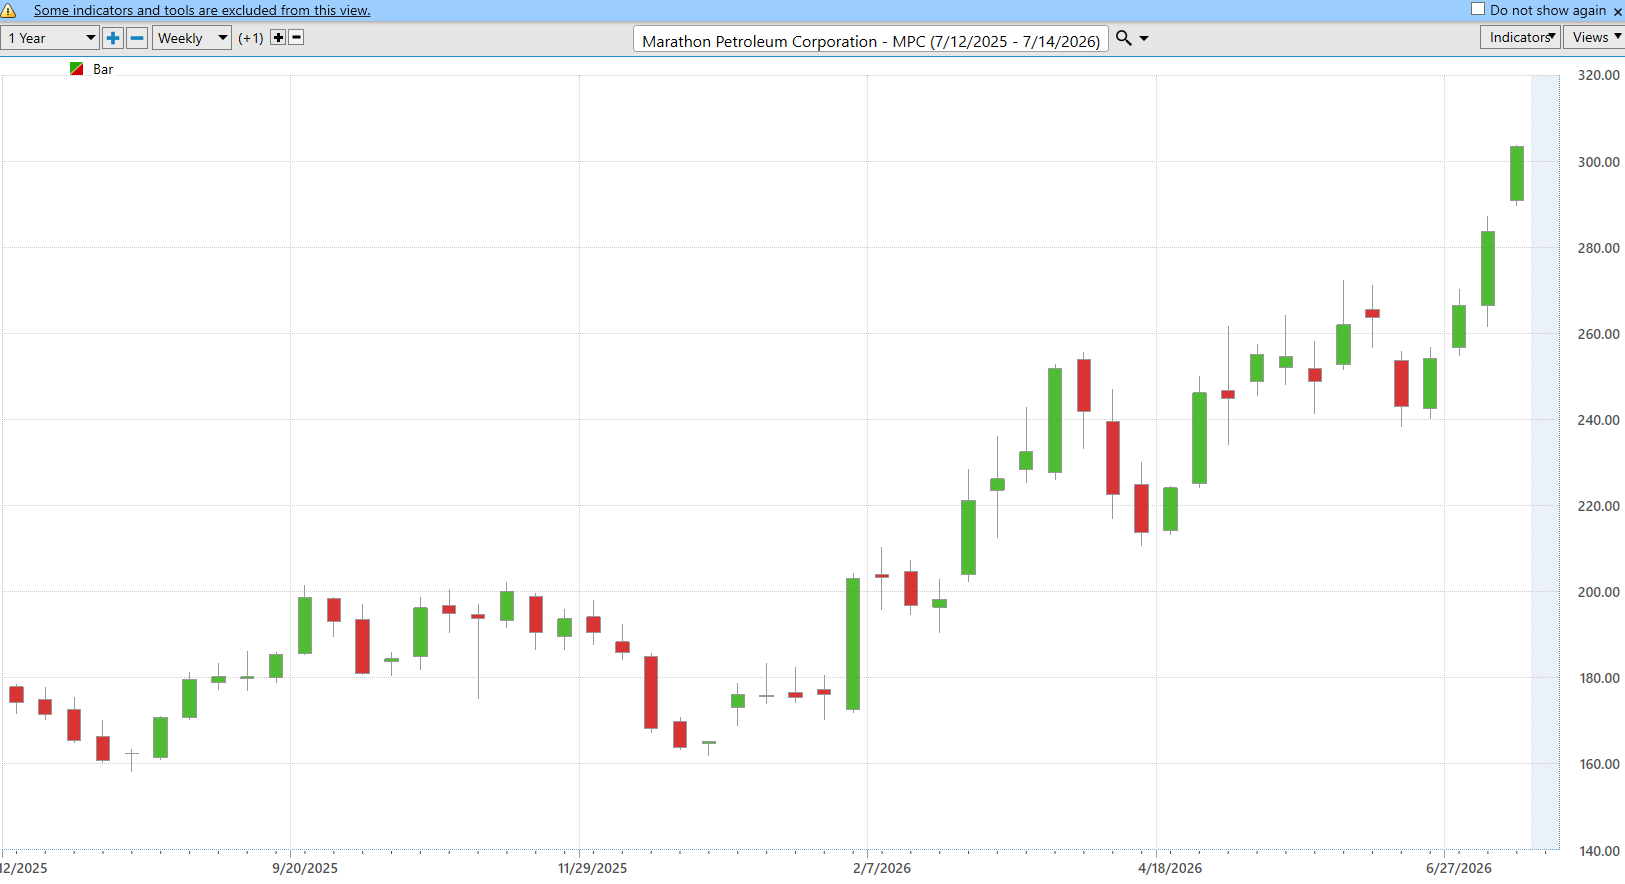
What stands out is how the stock behaved during its inevitable pullbacks. Every meaningful decline over the past year eventually gave way to higher highs and higher lows. That’s one of the oldest definitions of an uptrend, and it reflects persistent demand rather than speculative excitement. Institutions appear willing to accumulate shares on weakness instead of abandoning positions when volatility appears.
Of course, traders should also appreciate what success brings. A stock trading within 0.03% of its 52-week high has very little overhead resistance because almost every shareholder is sitting on a profit. That’s bullish. At the same time, expectations become much higher. Any disappointment in earnings, refining margins, or forward guidance can trigger profit-taking simply because there are so many gains available to protect. Great trends don’t die from old age, but they often pause when optimism becomes crowded.
The chart leaves traders with a straightforward conclusion. Marathon Petroleum is not behaving like a stock searching for direction. It is behaving like a market leader. As long as it continues making higher highs and defending previous breakout levels, the long-term trend deserves the benefit of the doubt. The first warning sign isn’t that the stock fails to make a new high. It’s that buyers stop showing up when prices retreat. Until that changes, the path of least resistance remains higher.
Best-Case/ Worst-Case Scenario Analysis
Volatility has one of the worst public relations departments in finance. Mention it and people picture catastrophe, margin calls, and television anchors speaking in urgent tones while standing in front of large red arrows. In reality, volatility is simply the price of admission. It is not a theory dreamed up by economists who have never placed a trade. It is the record of what a stock has already done. If you want to understand Marathon Petroleum, forget the formulas for a moment and look at its largest uninterrupted rallies and declines over the past year. Those moves tell you exactly what this stock is capable of, both when investors are feeling optimistic and when they’re convinced civilization is ending by Thursday.
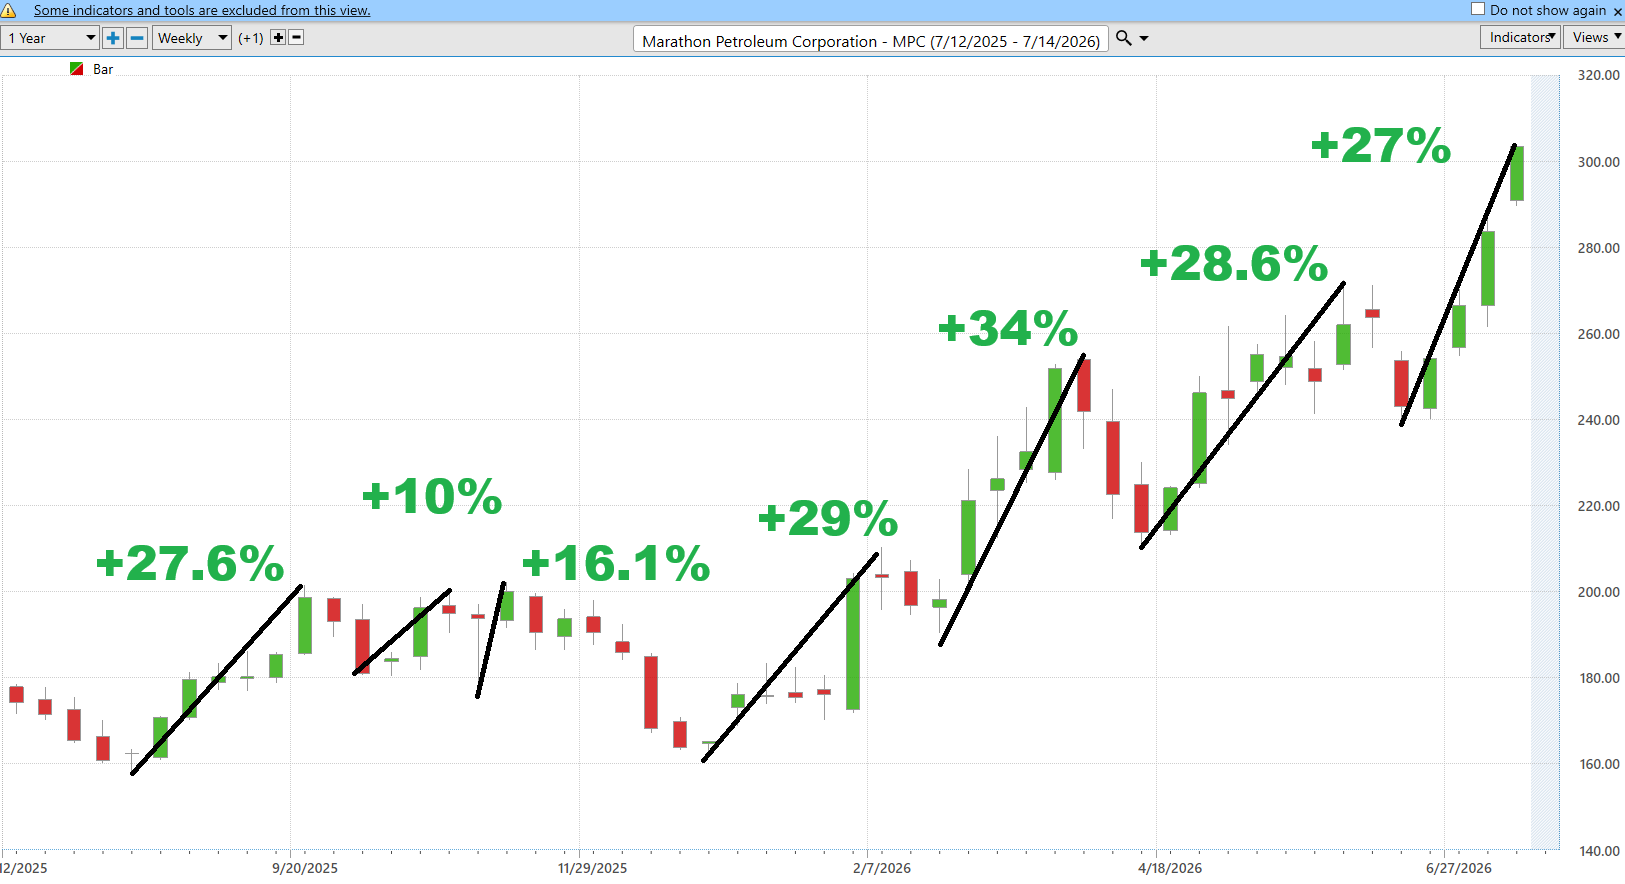
The good news is that Marathon Petroleum has repeatedly reminded traders why leadership stocks earn that title. Over the past year it has produced uninterrupted advances of 27.6%, 10%, 16.1%, 29%, 34%, 28.6%, and most recently 27%. Those aren’t lucky bounces. They’re evidence that large institutional investors have consistently stepped in after periods of weakness and driven the stock to new highs. Strong trends have a peculiar habit of making patient people look brilliant and impatient people look expensive. Every rally reinforces the same lesson. When refining margins remain healthy, cash flow stays strong, and buyers continue accumulating shares, Marathon has demonstrated an ability to reward disciplined traders with gains that are both meaningful and repeatable. No one can promise history will repeat itself, but history has already established what this stock is capable of when conditions remain favorable.
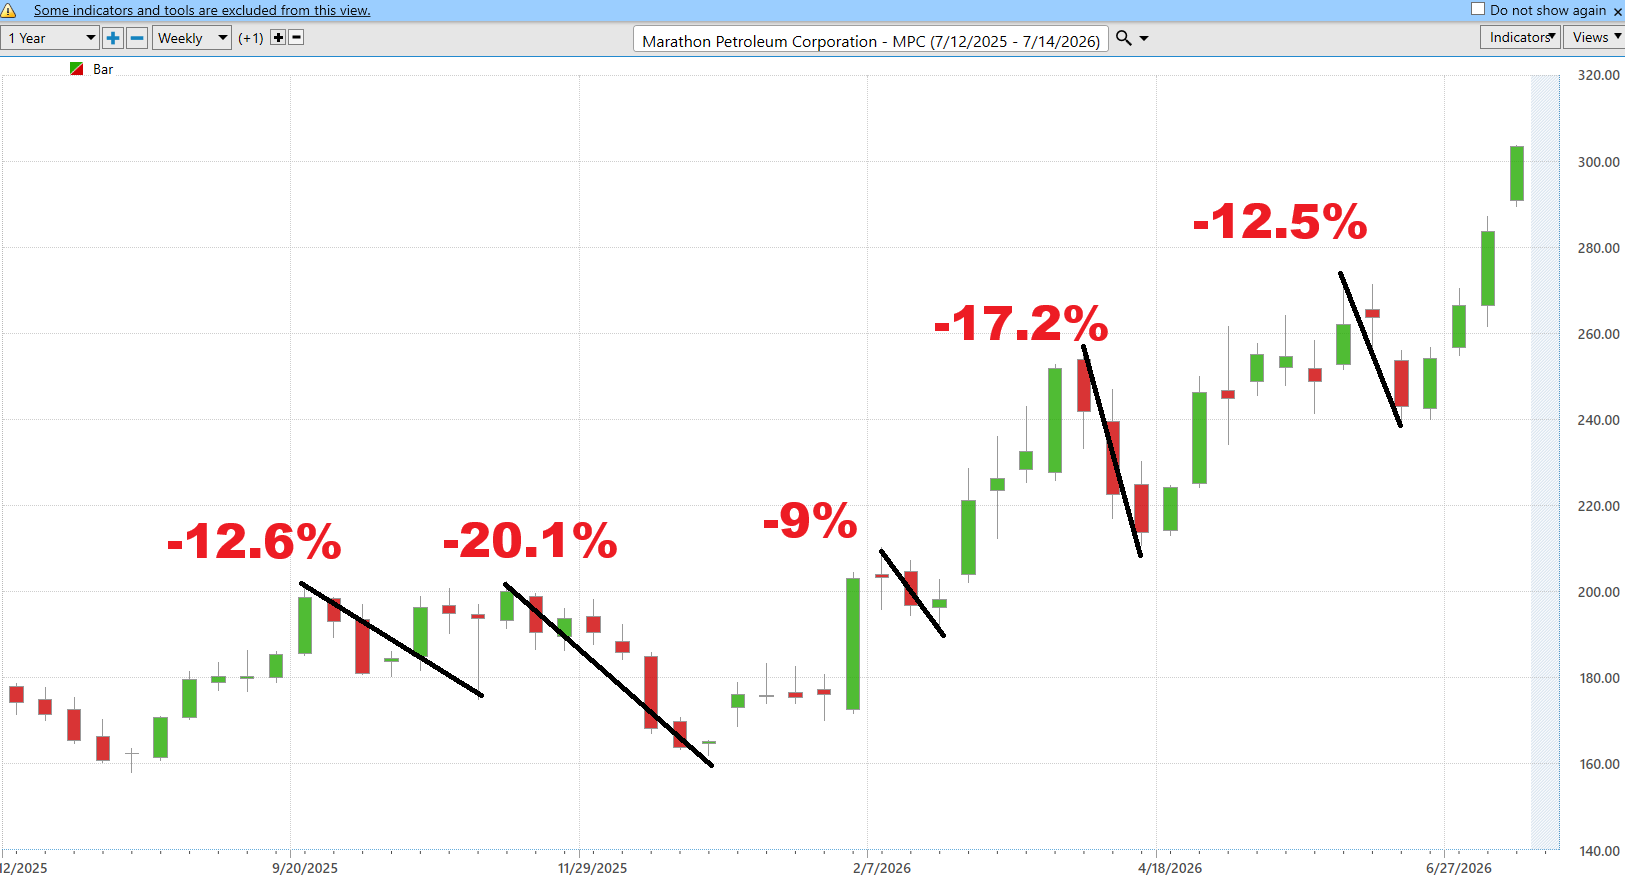
Of course, every parade eventually encounters bad weather. Marathon has also experienced uninterrupted declines of 12.6%, 20.1%, 9%, 17.2%, and 12.5% during the same period. That’s the bill every shareholder must be willing to pay for the opportunity to participate in those larger advances. Traders who panic every time a stock falls 10% probably shouldn’t own a stock capable of rising 30%. The market has an unfortunate tendency to charge admission before showing you the entertainment. That’s why position sizing matters so much. A properly sized trade allows you to survive normal corrections without making emotional decisions that usually benefit someone else. The objective isn’t to predict whether Marathon’s next major move will resemble its best-case history or its worst-case history. The objective is to understand both well enough that neither outcome catches you by surprise. That’s how professionals stay in the game long enough to collect the rewards when the odds finally tilt in their favor.
Next we compare Marathon Petroleum Corooration ($MPC) to the broader stock market averages.
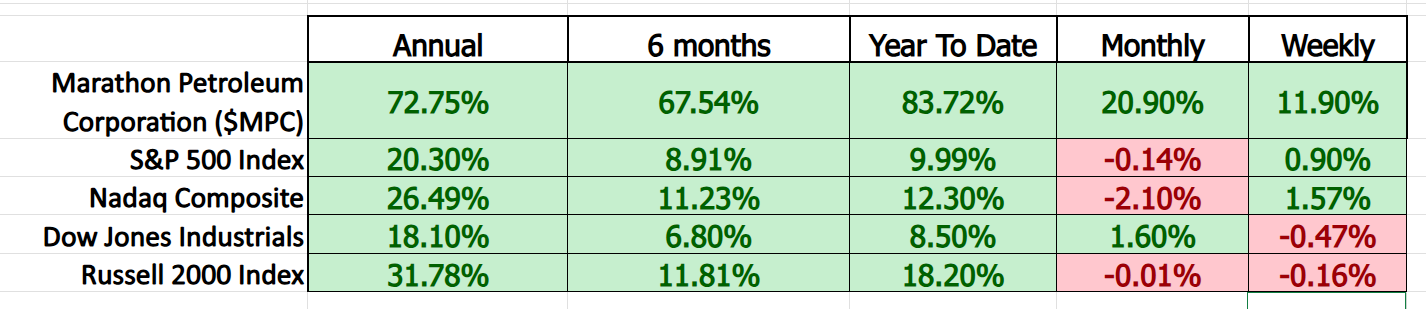
Performance has a way of cutting through narratives. It doesn’t care about television interviews, investor presentations, or clever explanations. It simply answers one question: Where is capital actually flowing? By that measure, Marathon Petroleum has become one of the market’s clearest leaders. Whether you examine the past week, month, six months, year to date, or the last twelve months, the stock has consistently outpaced every major U.S. equity benchmark. That kind of sustained outperformance rarely happens by accident.
The magnitude of the leadership is particularly striking over the longer time horizons. Marathon Petroleum has gained 83.7% year to date and 72.8% over the past year, compared with roughly 10% and 20%, respectively, for the S&P 500. Even against the technology-heavy Nasdaq, which has enjoyed a strong year of its own, Marathon’s returns stand in a different league. That tells us something important. Investors are not simply buying the market. They are actively choosing Marathon Petroleum over many alternative opportunities.
Perhaps the most compelling aspect of this performance is its consistency. Many stocks experience one explosive rally and then spend months giving it back. Marathon has continued to outperform across virtually every meaningful time frame, suggesting this is not a one-off event driven by short-term speculation. It reflects persistent institutional demand, supported by resilient refining margins, disciplined capital allocation, and strong cash generation. Markets can debate why a stock moves. They cannot debate that it has moved.
For traders, this is the framework that matters. Leadership tends to attract more leadership because institutional investors rarely abandon their strongest holdings without a compelling reason. That does not guarantee future gains, nor does it eliminate the possibility of meaningful pullbacks. But as long as Marathon Petroleum continues to outperform both its sector and the broader market over multiple time horizons, the burden of proof remains with the bears, not the bulls.
Vantagepoint AI Predictive Blue Line
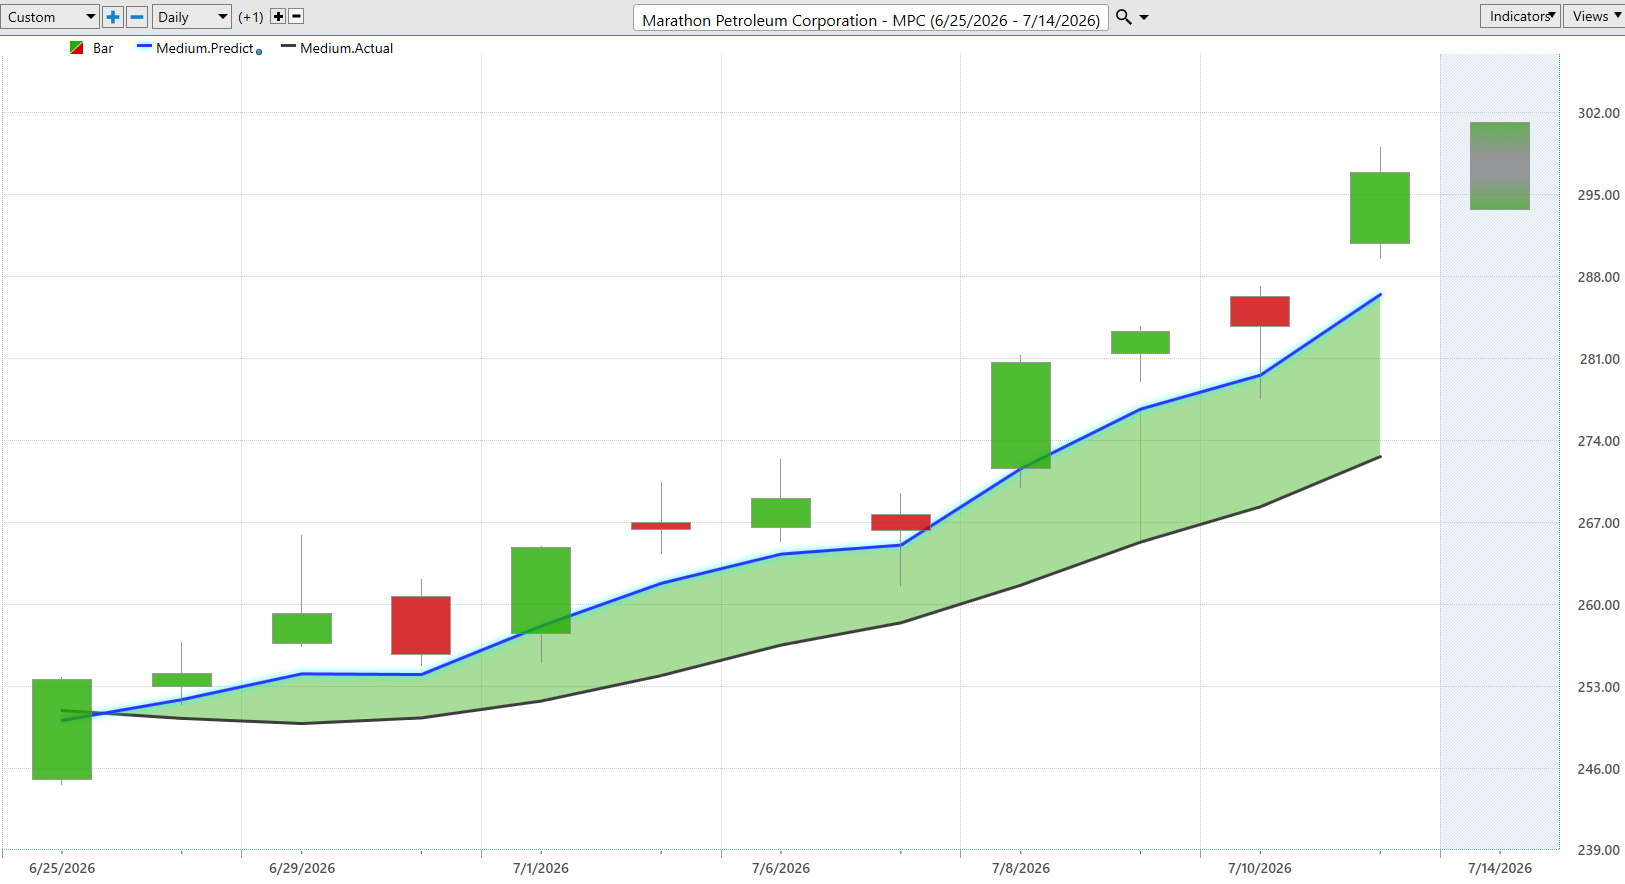
One of the greatest mistakes traders make is believing that trends begin when the headlines arrive. They don’t. By the time the news becomes obvious, the market has usually been quietly voting for days or even weeks. That’s exactly why the Predictive Blue Line deserves attention. It isn’t trying to explain yesterday. It’s attempting to identify where momentum is likely headed before the crowd catches up.
In Marathon Petroleum, the message could hardly be clearer. The Predictive Blue Line is rising steadily and remains comfortably above the actual moving average, creating a widening spread that reflects strengthening upside momentum rather than weakening conviction. Notice how every brief pause in price over the past three weeks was accompanied by a Blue Line that continued to slope higher. That’s important. It suggests the underlying trend never truly lost its footing. Buyers simply paused long enough to catch their breath before stepping back in.
The most recent price action reinforces that story. Following a modest pullback, Marathon quickly resumed its advance, printing another powerful bullish candle while the Predictive Blue Line accelerated higher. This is exactly what traders hope to see in a healthy trend. Price and predictive trend are working together instead of arguing with one another. When those two forces move in the same direction, the probability of trend continuation generally improves.
Perhaps the most encouraging feature of the chart is consistency. There are no violent swings in the Blue Line, no flattening slope, and no evidence that momentum is beginning to roll over. Instead, the predictive trend has been climbing in an orderly fashion while price continues making higher highs and higher lows. Strong institutional trends often look surprisingly boring until they suddenly become obvious to everyone else.
No indicator is perfect, and the Predictive Blue Line should never be viewed in isolation. A sharp reversal in refining margins, disappointing earnings, or an unexpected macro shock could quickly change the picture. But based solely on what this chart is communicating today, the buyers remain firmly in control. Until the Blue Line begins to flatten or turns lower against price, the path of least resistance continues to point upward. Sometimes the most valuable information isn’t found in what the market is saying today. It’s found in what the market appears to be whispering about tomorrow.
VantagePoint AI Neural Index
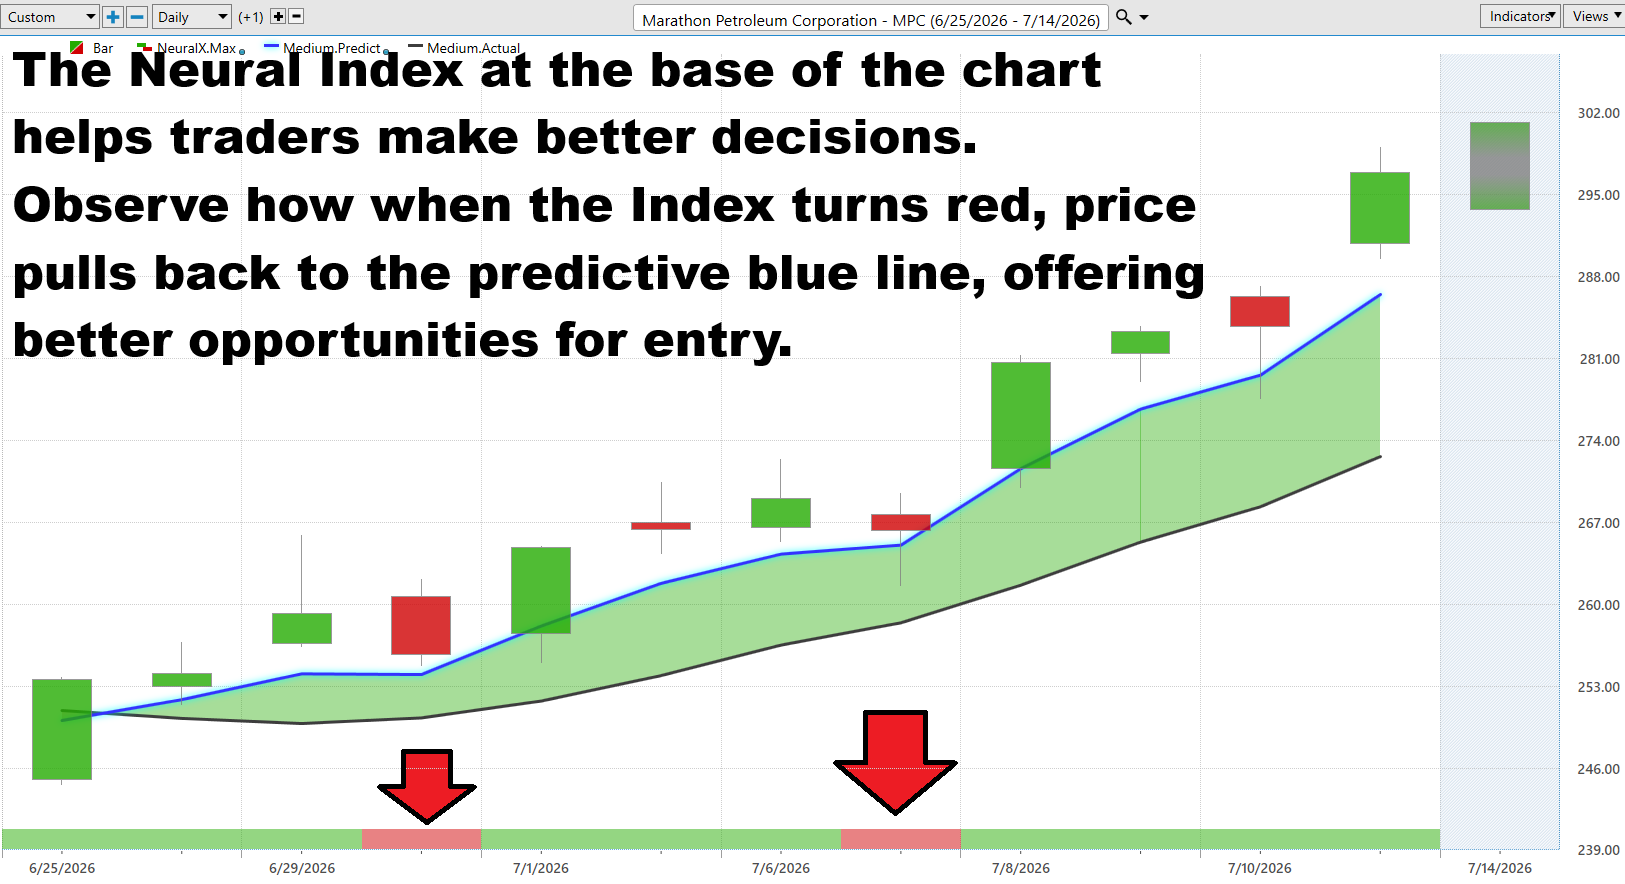
Most investors spend their days asking, “What just happened?” Successful traders ask a far more profitable question, “What is most likely to happen next?” That is the purpose of the Neural Index. It is not designed to predict how far a stock will move. Its job is far simpler, and arguably far more valuable. It attempts to identify whether the next 48 to 72 hours favor higher or lower prices. Think of it as an early warning system for momentum.
The recent behavior in Marathon Petroleum offers an excellent example of why this matters. During the past three weeks, the Neural Index briefly turned red on two occasions. In both instances, the stock did exactly what experienced trend traders hope to see. Rather than signaling the end of the advance, the red readings coincided with modest pullbacks that carried price back toward the rising Predictive Blue Line. Those pauses allowed excess enthusiasm to cool without damaging the underlying uptrend. As soon as the Neural Index returned to green, buyers regained control and the stock resumed its march higher.
That sequence tells an important story. Strong trends rarely move in straight lines. They advance, pause, attract new buyers, and then continue climbing. The Neural Index helps traders distinguish between a healthy pause and the beginning of a meaningful reversal. On this chart, every temporary burst of weakness proved to be an opportunity rather than a warning to abandon the position.
Notice where Marathon Petroleum stands today. The Neural Index is once again green, while the Predictive Blue Line continues rising and price is pressing against fresh 52-week highs. That alignment is precisely what traders hope to see. Momentum, trend, and price are reinforcing one another instead of sending conflicting messages. When multiple independent indicators tell the same story, confidence in the prevailing trend naturally increases.
No indicator enjoys a perfect batting average, and the Neural Index should never replace sound risk management. Unexpected earnings news, geopolitical events, or sharp moves in energy markets can overwhelm even the best predictive models. But based on the evidence before us, Marathon Petroleum continues to exhibit the characteristics of a healthy institutional advance. Until the Neural Index begins producing persistent red signals while the Predictive Blue Line rolls over, the market continues to suggest that temporary weakness should be viewed with curiosity rather than fear. As every successful advertiser understands, consistency builds trust. In the stock market, consistent signals build confidence.
VantagePoint AI Daily Range Forecast
The best traders don’t ask where a stock has been. They ask where it is likely to trade next. That distinction is the difference between reacting and anticipating. The Daily Range Forecast is designed to estimate tomorrow’s probable trading boundaries before the opening bell, giving traders a framework for managing both opportunity and risk. Think of it as a map. It doesn’t tell you exactly where the market will stop, but it does identify the roads most likely to be traveled.
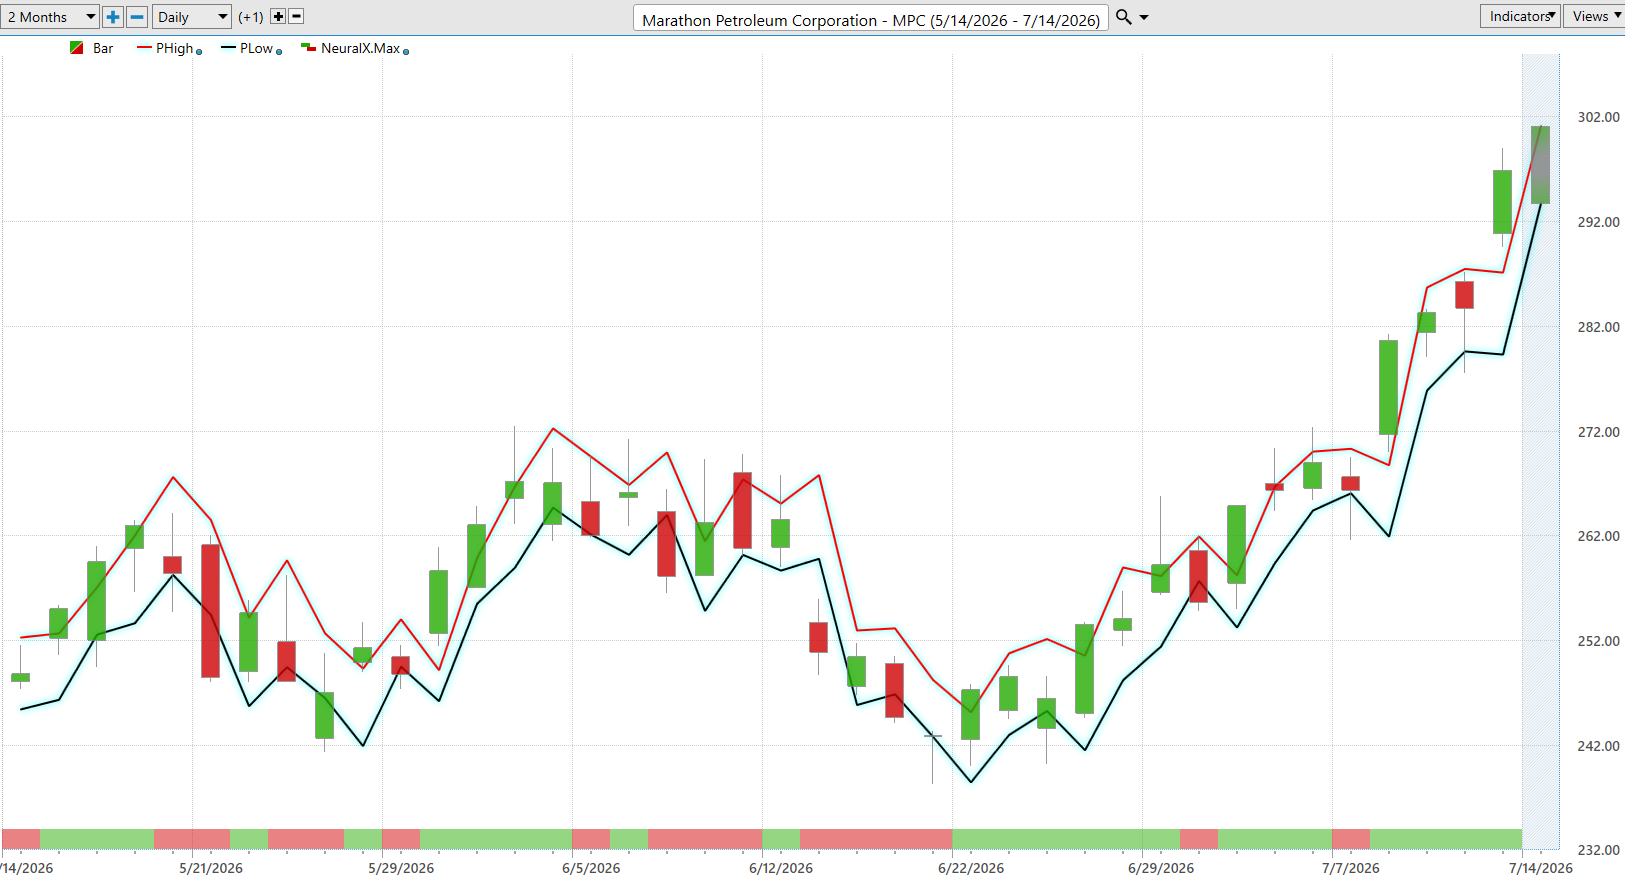
For Marathon Petroleum, the current picture remains decidedly constructive. The forecast range continues to climb alongside price, reflecting a market that is expanding higher rather than exhausting itself. Notice how the recent rally has consistently respected the forecast boundaries. Buyers have repeatedly stepped in near the projected lower range before driving the stock back toward the upper boundary. That is exactly the behavior traders hope to see during a healthy institutional advance.
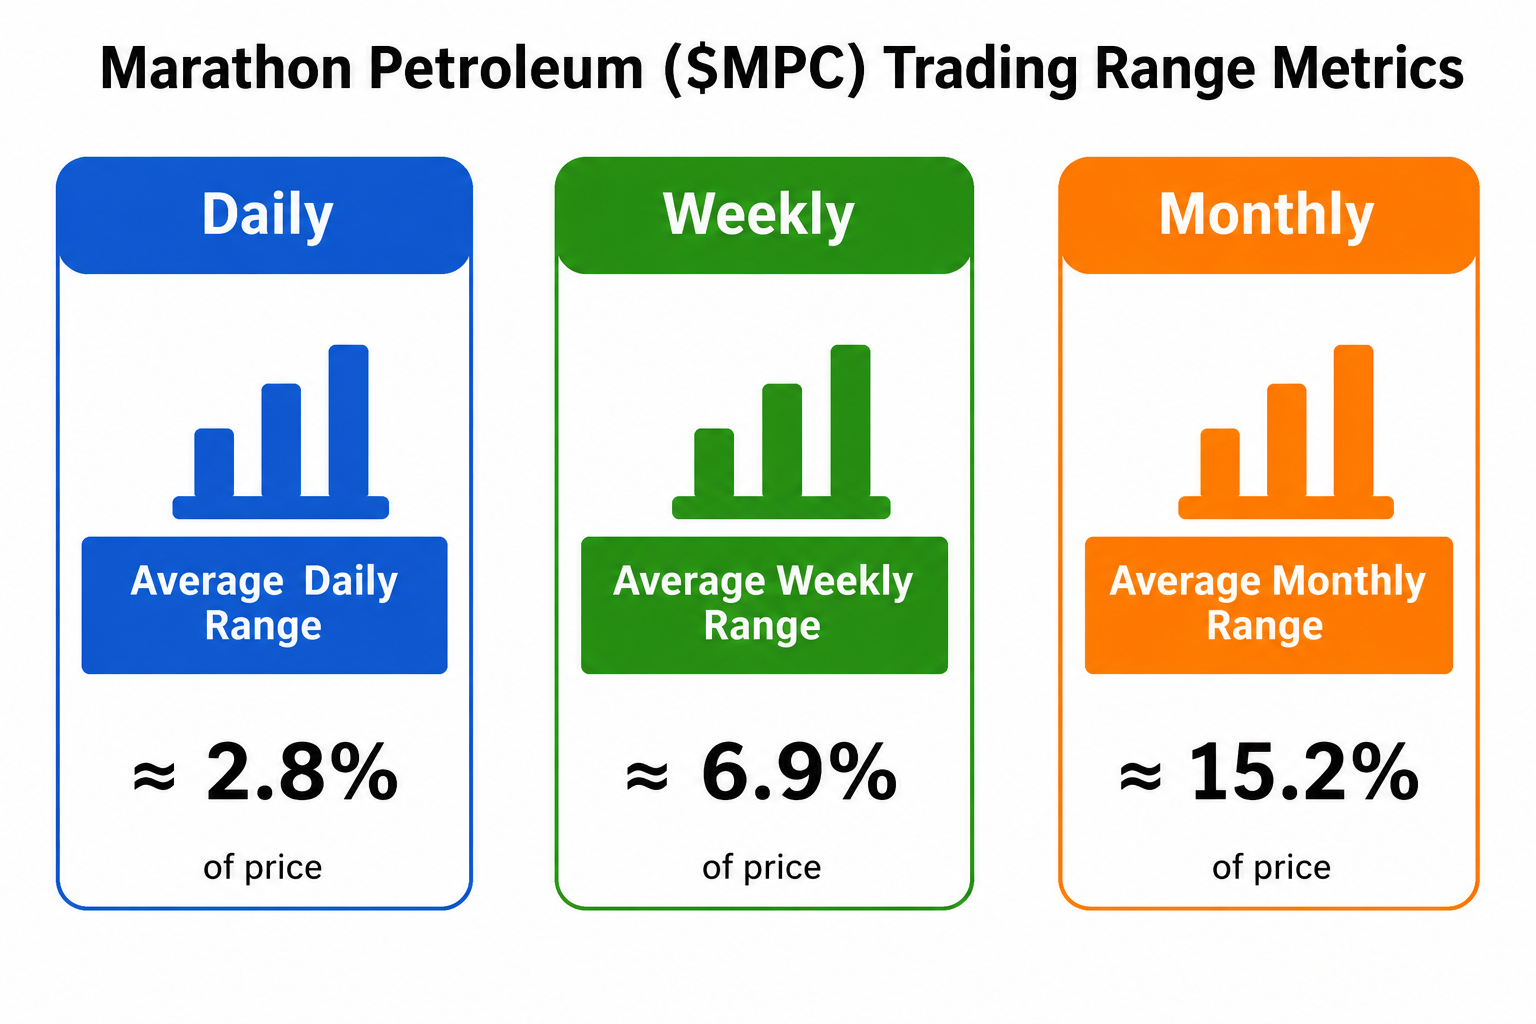
The Trading Range Metrics reinforce that message. Marathon typically moves about 2.8% in a single trading day, roughly 6.9% over a typical week, and approximately 15.2% over the course of a month. Those numbers provide valuable perspective. A one- or two-percent pullback may feel dramatic in the moment, but historically it falls well within the stock’s normal daily rhythm. Understanding that reality helps traders distinguish ordinary market noise from meaningful changes in trend.
The chart also highlights an important psychological advantage. Instead of chasing strong rallies after they have already occurred, traders can use the forecast range to prepare for higher-probability entry opportunities. When price retreats toward the lower portion of an advancing forecast channel while the broader trend remains intact, disciplined traders often view that weakness as an opportunity rather than a reason for panic. The goal is not to predict every tick. It is to stack the probabilities in your favor.
None of this eliminates risk entirely. Marathon Petroleum remains an energy stock, and energy stocks can react quickly to earnings, refinery margins, crude oil prices, geopolitical events, or unexpected macroeconomic news. But based on the current forecast, momentum remains firmly positive. The projected range continues to move higher, price remains near new 52-week highs, and volatility is staying within its normal historical boundaries. Until those conditions begin to change, the Daily Range Forecast suggests that traders should expect normal pullbacks to be pauses within an ongoing uptrend, not evidence that the trend itself has come to an end.
VantagePoint AI Intermarket Analysis
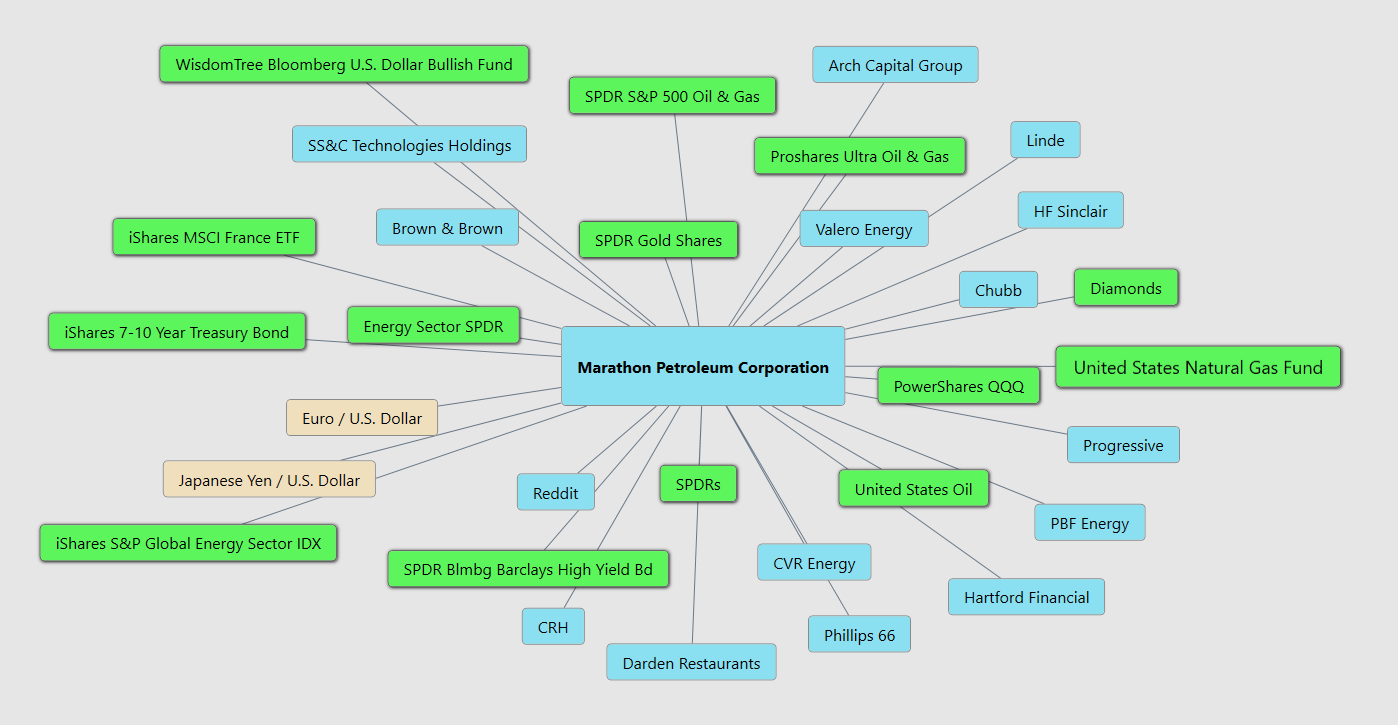
Intermarket analysis is really about understanding one simple idea: nothing in the financial markets moves completely by itself. Oil, stocks, bonds, interest rates, currencies, and the economy are all connected. For Marathon Petroleum, these connections are especially important because the company buys crude oil and turns it into gasoline, diesel, jet fuel, and other products. The intermarket map shows that MPC is connected to energy ETFs, crude oil, natural gas, the U.S. dollar, Treasury bonds, and competing refiners like Valero, Phillips 66, HF Sinclair, CVR Energy, and PBF Energy. All of these markets can provide clues about where MPC may be headed next.
The most important thing to understand is that MPC does not simply need higher oil prices to make more money. Marathon buys crude oil, so oil is actually one of its biggest costs. What really matters is the difference between what Marathon pays for crude oil and what it can charge for the gasoline, diesel, and jet fuel it produces. This difference is called the **refining margin**, often measured by something called a crack spread. If fuel prices rise faster than the cost of crude oil, Marathon can make more money. If crude oil becomes expensive but gasoline and diesel prices don’t keep up, profits can get squeezed. That’s why watching MPC by looking only at oil prices is like watching half the game and trying to guess the final score.
There are other important clues. Companies like Valero, Phillips 66, HF Sinclair, CVR Energy, and PBF Energy can tell us whether Marathon is moving because of something happening specifically at MPC or because the entire refining industry is getting stronger. Energy ETFs help us see whether big institutional investors are moving money into or out of energy stocks. The U.S. dollar affects commodity prices around the world, while Treasury yields and high-yield bonds can provide clues about whether the economy is getting stronger or weaker. A healthy economy usually means more people driving, more trucks delivering goods, and more airplanes flying. All of that requires fuel, which is good for Marathon’s business.
For traders, the big lesson is simple: MPC is not just an oil trade. Watch crude oil prices, but also watch refining margins, gasoline and diesel demand, refinery capacity, the economy, competing refiners, and geopolitical events. When refining margins are improving, fuel demand is strong, other refining stocks are rising, and big investors are moving money into energy, the wind is usually at Marathon’s back. When those relationships begin weakening, traders should pay attention. The price chart tells you what is happening. Intermarket analysis helps you understand why it’s happening, and whether the forces pushing the stock higher are getting stronger or starting to fade.
Our Suggestion
Marathon Petroleum is doing something traders should always respect: it’s winning. The stock is trading near its 52-week high, the Predictive Blue Line is rising, the Neural Index remains constructive, and MPC has dramatically outperformed the major market indexes across multiple time frames. The fundamentals are cooperating. First-quarter 2026 Refining & Marketing adjusted EBITDA rose to $1.4 billion, compared with $489 million a year earlier, while adjusted EBITDA per barrel improved from $1.91 to $5.37. Management also increased its share-repurchase authorization by $5 billion, leaving roughly $8.6 billion authorized at the time of the announcement.
Management’s message from the last two earnings cycles has been remarkably consistent: run the refineries efficiently, take advantage of strong refining margins, invest selectively where returns justify it, and return excess capital to shareholders. In the fourth quarter, refining margins jumped 44% year over year while utilization reached roughly 95%. In the first quarter, management emphasized that MPC’s predominantly U.S. and Canadian crude sourcing leaves it relatively insulated from global crude supply disruptions, while international fuel shortages have created opportunities for U.S. refiners. The company also brought forward significant maintenance work and expects higher second-quarter throughput, positioning the system to capitalize on strong demand.
Here’s the catch, because there’s always a catch. At roughly $303, MPC is no longer Wall Street’s best-kept secret. The stock has raced to new 52-week highs, and expectations have risen right along with the price. Refining is notoriously cyclical, and today’s wonderful crack spreads have an annoying habit of becoming tomorrow’s disappointing crack spreads. Traders should watch refining margins, utilization, fuel demand, and operating costs closely. The stock does not need perfection to keep rising, but at these levels it probably needs continued evidence that the earnings engine is still running hot.
Our suggestion is to respect the trend without worshipping it. MPC remains a market leader, and the weight of the evidence continues to favor the bulls. But after such an extraordinary advance, chasing vertical price movement carries considerably more risk than buying normal weakness within an established uptrend. The Daily Range Forecast can help identify those periods when price retreats toward anticipated support while the Predictive Blue Line and Neural Index remain constructive. That’s where risk and opportunity can become far more attractive.
The next earnings report will be the market’s opportunity to check whether the story still matches the stock price. Marathon Petroleum’s next earnings call is scheduled for Tuesday, August 4, 2026, at 11:00 a.m. Eastern Time. The company will discuss its second-quarter 2026 financial results. Traders should focus less on whether Marathon merely “beats earnings” and more on what management says about refining margins, throughput, utilization, product demand, operating costs, and capital returns. If those remain strong, the trend has fundamental fuel behind it. If margins begin compressing while management’s outlook becomes cautious, that would be an early warning that expectations have outrun reality.
For now, the trend is up, the fundamentals have improved sharply, and institutional money appears to be voting with its wallet. That’s a combination worth respecting. Just remember the first rule of owning a stock that has nearly doubled from its 52-week low: the higher the mountain gets, the more important it becomes to know where you put your feet. Position-sizing is critical.
It’s not magic.
It’s machine learning.
Disclaimer: THERE IS A HIGH DEGREE OF RISK INVOLVED IN TRADING. IT IS NOT PRUDENT OR ADVISABLE TO MAKE TRADING DECISIONS THAT ARE BEYOND YOUR FINANCIAL MEANS OR INVOLVE TRADING CAPITAL THAT YOU ARE NOT WILLING AND CAPABLE OF LOSING.
VANTAGEPOINT’S MARKETING CAMPAIGNS, OF ANY KIND, DO NOT CONSTITUTE TRADING ADVICE OR AN ENDORSEMENT OR RECOMMENDATION BY VANTAGEPOINT AI OR ANY ASSOCIATED AFFILIATES OF ANY TRADING METHODS, PROGRAMS, SYSTEMS OR ROUTINES. VANTAGEPOINT’S PERSONNEL ARE NOT LICENSED BROKERS OR ADVISORS AND DO NOT OFFER TRADING ADVICE.