


This week’s ai stock spotlight is Micron Technology ($MU)
Micron is the Idaho chipmaker riding the A.I. wave. Revenues are exploding, margins are fattening, and Wall Street suddenly loves a company it ignored for years. But it’s a boom-and-bust business — when demand slips, this baby crashes harder than a meme stock hangover. Traders who time it right make bank. Those who don’t end up learning “risk management” the hard way.
Now let’s dig in before your next caffeine hit wears off.
Micron Technology is the quiet monster behind the scenes of your tech addiction. Founded in the 1970s and headquartered in Boise, Idaho — yes, the potato capital — it’s one of the last U.S. survivors in the cutthroat world of memory chips. Their CEO, Sanjay Mehrotra, is the kind of engineer-turned-executive who can talk about nanometers like a poet talks about sunsets. Under his watch, Micron isn’t just shoveling out flash drives; they’re building the backbone of the digital economy — those microscopic slabs of silicon that let your phone, your laptop, and your shiny A.I. servers actually remember stuff.
Here’s what they do: DRAM, NAND, NOR — the alphabet soup of modern memory. Translation? They make the chips that store, move, and recall data faster than you can forget your passwords. Their products go into everything: data centers, AI servers, electric cars, your kid’s gaming rig. And when they sell to hyperscalers like Amazon or NVIDIA partners, they don’t just move inventory — they move markets. Their entire business model runs on one simple but brutal truth: when memory demand explodes, you mint money; when it contracts, you bleed red ink by the gallon.
Now, competitors. Think of this as the global Hunger Games of silicon. On one side, you’ve got Samsung — the South Korean juggernaut that could build memory chips out of thin air if it wanted. On the other, SK Hynix, another Seoul-based powerhouse with a chip-on-its-shoulder the size of a skyscraper. Both are massive, ruthless, and allergic to letting Micron have an easy quarter. And yet, somehow, the scrappy Idaho kid keeps showing up, swinging, and landing punches.
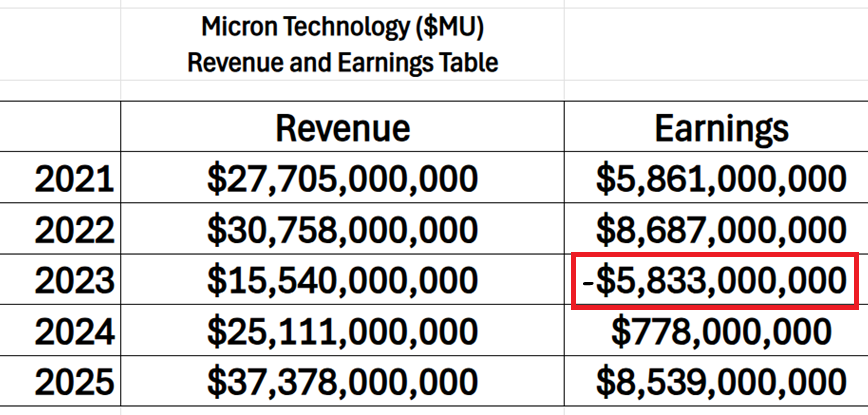
Financially, Micron is in beast mode. Revenue surged to roughly $37 billion this year, up from $25 billion the year before. That’s not growth, that’s detonation. Margins exploded from the low 20s into the high 30s, and operating margins tripled. Cash is piling up like snowdrifts in Boise, now close to $10 billion, while long-term debt sits around $14 billion. That’s a manageable tab for a company that’s printing free cash flow north of $17 billion. Translation: they’ve got dry powder for the next fab, the next node, the next war in the silicon trenches.
The reason traders can’t stop salivating? The A.I. boom. Every fancy algorithm, every chatbot, every robot pretending to be smart — it all runs on data. And data runs on memory. Micron’s high-bandwidth chips are the unsung heroes inside the A.I. arms race. When NVIDIA builds supercomputers that talk back, Micron’s silicon helps them remember what was said. It’s not glamorous, but it’s gold. Wall Street knows it, too, that’s why MU’s chart looks like a SpaceX launch.
But let’s not break out the champagne just yet. Because this game has a hangover built in. Memory chips are cyclical. When times are good, everyone expands capacity; when times are bad, there’s a silicon glut so deep you could swim in it. Prices crater. Margins vanish. Analysts panic. The same traders who were cheering start shorting. It’s happened before and it’ll happen again. The only variable is timing — and your nerve.
Then there’s China. Micron’s relationship with Beijing is like a bad romance: too big to ignore, too risky to trust. The Chinese government has blocked some of their data-center business and tightened restrictions. That’s a problem when you sell globally. Add in Washington’s export controls and you’ve got geopolitical landmines all over the supply chain. You can’t make memory chips without materials and machines that cross borders — so one wrong diplomatic tweet, and the whole house shakes.
So, what could go right? Plenty. If A.I. demand keeps roaring, Micron’s profits could double again. The U.S. government is practically throwing money at domestic chipmakers. Cloud spending is accelerating. High-bandwidth memory is in short supply. And if Samsung or SK Hynix stumble — well, Idaho might finally beat Korea at something other than potatoes.
What could go wrong? Pretty much everything else. If hyperscalers pull back, if A.I. hype fizzles, if prices for DRAM and NAND slide, Micron’s margins will collapse faster than a meme coin. They’re still tied to global consumer electronics — smartphones, PCs, cars. Any slowdown there, and investors run for cover. And because traders have already priced in perfection, one cautious comment from management can take 10% off the stock overnight.
So, what’s the verdict? Micron is not for the faint of heart. It’s a high-beta, adrenaline-fueled, momentum stock wrapped in a shiny tech narrative. It’s where you go if you want volatility with a side of euphoria. But it’s also where you go if you want to test your discipline. Because when the music stops, memory names don’t “correct” — they crater.
Study the finances for the last five years and you see massive volatility in the finances of $MU.
Here’s the trader’s takeaway: Micron is a rocket in a fireworks factory. The upside is real. The story is strong. The catalysts — A.I. expansion, cloud demand, and fat margins — are powerful. But don’t get married to it. Trade it. Ride the wave. Watch the earnings calendar like a hawk. Respect your stop losses. Because Micron has a cruel sense of humor — it gives you the rush of victory before reminding you what gravity feels like.
If you’re in it for the thrill, MU is your playground. If you’re in it for safety, go buy Treasury bills and take a nap. Micron isn’t a stock you own — it’s a stock you ride. And right now, the ride’s screaming higher. Just remember: when the cycle turns, the exit door always looks smaller on the way out.
In this stock study, the goal isn’t to glorify a ticker or get swept up in the noise. It’s to understand the underlying forces shaping price and sentiment. Markets move for reasons — structural, psychological, and sometimes, purely mechanical. The question we’re answering is straightforward: Does this stock merit your capital and your focus or is it simply another name riding the current?
The indicators we’re using aren’t impulses or impressions. They come from observed behavior, historical probabilities, and machine learning models designed to detect shifts before they appear in the headlines.
- Wall Street Analysts Ratings and Forecasts
- 52 Week High and Low Boundaries
- Best-Case / Worst-Case Scenario Analysis
- VantagePoint A.I. Predictive Blue Line
- Neural Network Forecast (Machine Learning)
- VantagePoint A.I. Daily Range Forecast
- Intermarket Analysis
- Our Suggestion
Artificial intelligence provides an anchor — yes — but it’s not a replacement for judgment. Before leaning into any signal, we return to the core of the company itself. Its fundamentals. It’s competitive footing. It’s risk complexion.
And for $MU, that context matters. Perhaps more now than at any point in this cycle.
It’s what tells us not only what the models are projecting — but why the probabilities are skewing in a particular direction. Whether the next move shows genuine conviction… or whether the market may be bracing for confusion instead.
Wall Street Analysts Forecasts
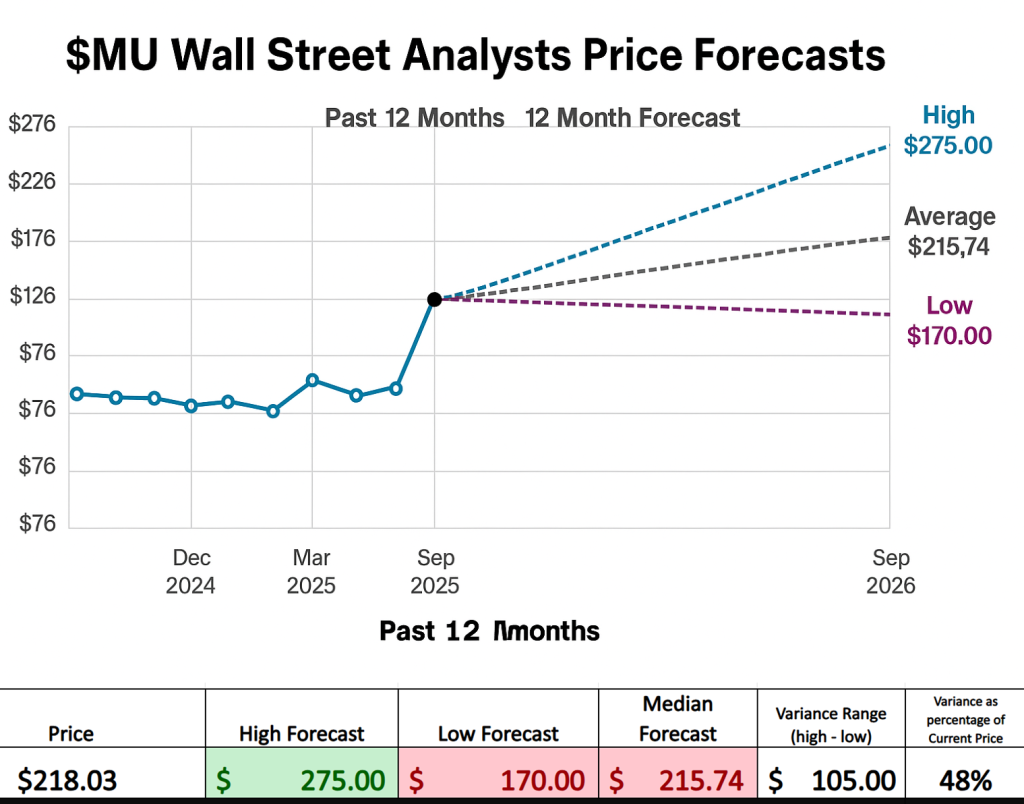
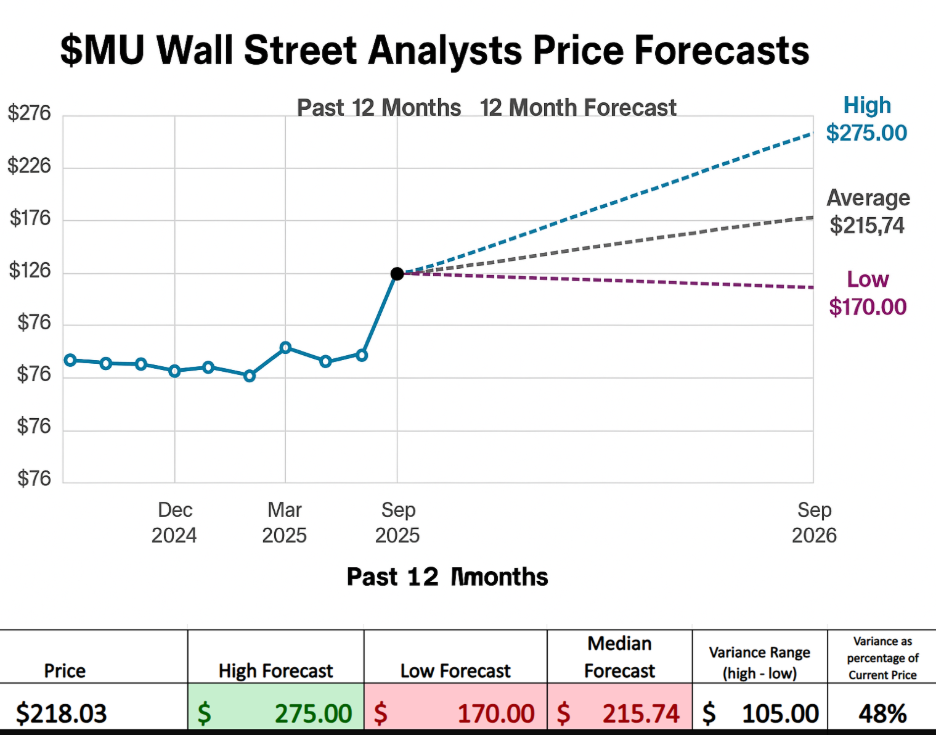
In the world of trading, there’s often more truth hidden in the spread than in the headline numbers. That’s why we pay close attention to the variance between the most bullish and most bearish Wall Street Price forecasts. It’s not just a disagreement among analysts — it’s the baked-in volatility of the stock itself. And when seasoned professionals, who watch this stock around the clock, can’t agree within 48% of the current price, that’s not noise, that’s opportunity and risk shaking hands.
Look at $MU. The most optimistic forecast sits at $275, while the most cautious calls for $170. That’s a gap of $105, or roughly 48% of the current price. That variance doesn’t come from guesswork; it comes from different interpretations of the same data — earnings trends, demand cycles, and global chip dynamics. The analysts all see the same company, yet their price targets stretch across a canyon of uncertainty.
For traders, that spread is pure signal. It tells you that $MU is in a zone where conviction is expensive and volatility is cheap — where big moves can happen fast and often. A variance this wide doesn’t fade quietly; it implies momentum, rotation, and reaction. And here’s the kicker: there’s no reason to think that volatility will calm down anytime soon. The semiconductor space is fast, cyclical, and emotional. The story of $MU isn’t about consensus, it’s about conviction. And conviction, when volatility’s this high, is exactly where the most interesting trades begin.
52 Week High and Low Boundaries
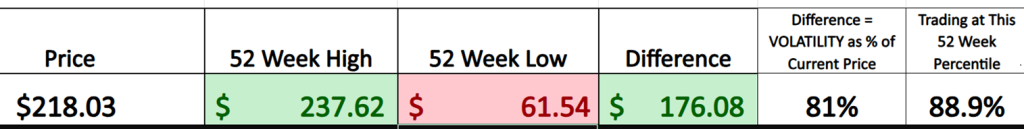
Let’s get one thing straight: those aren’t just numbers in that table. They’re emotional weather reports for the market — barometric readings of fear, greed, panic, mania, buyer’s remorse, and the occasional “Dear God, why did I do that?”
We’re looking at the annual trading range here. High of $237.62, low of $61.54. That’s a spread of $176.08 — which is basically a full personality disorder in price form. Then you divide that $176.08 by today’s price, $218.03, and discover this thing has been swinging around at 81% volatility.
That’s not “normal market movement.” That’s “trying to ride a mechanical bull after three bourbons and a motivational speech.”
This is how you compare volatility across markets — strip out the narratives, the press releases, the Reddit chants and the CNBC hand-wringing. Just look at the range and divide by the price. If the number is small, the market is wearing khakis and speaking softly. If the number is big — like 81% big — the market is shirtless, barefoot, and screaming about destiny.
Traders obsess over these 52-week levels because they mark the psychological shoreline where rational thought goes to drown. The 52-week low is where everyone once agreed the world was ending, civilization had collapsed, and the stock was worth less than a used lawnmower. The 52-week high, by contrast, is where humanity decides it’s a genius — where optimism inflates like a cheap parade balloon that’s one breeze away from catastrophe.
And when a stock starts skulking around the upper end of its range — like this one is — it’s not just a price anymore. It’s a confession. It’s saying, “People are betting big. People are sweating. Someone out there has already mortgaged the dog.”
With volatility at 81%, the mood here isn’t “steady climb” or “long-term value.” No. This is white-water trading. This is rafting without helmets. The river used to meander — slow, lazy, maybe even boring. Then, without warning, the current turned vicious. The stock shot upward like it had someplace urgent to be, possibly involving fireworks, champagne, and jail time.
Breaking to new highs is exciting — sure. It’s also when momentum traders saddle up, grandparents call their brokers, and every short seller in America begins whispering prayers usually reserved for medical emergencies. Momentum is a delightful ride — right up until it kicks you in the teeth. Every rally is forever… until the day it isn’t.
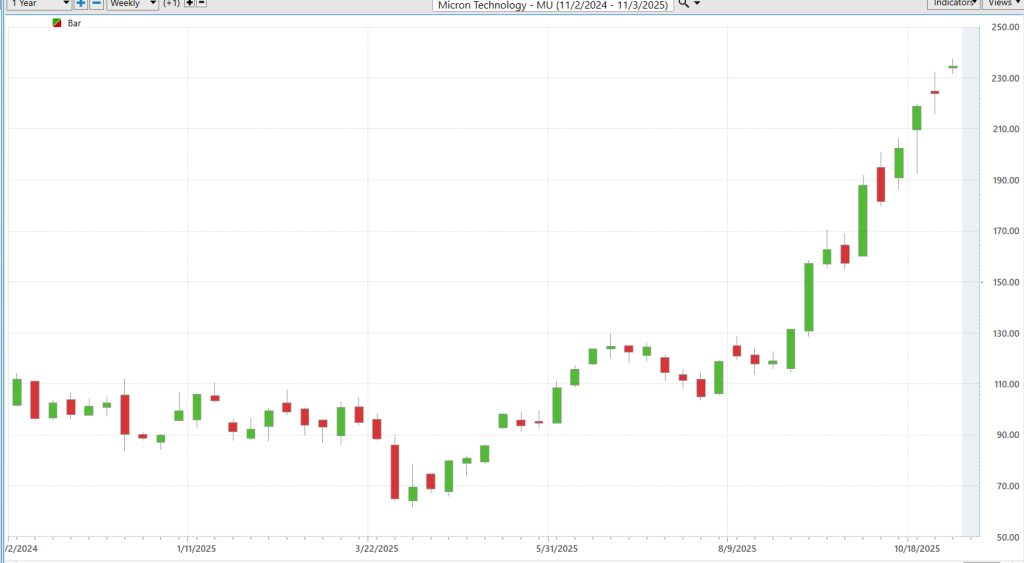
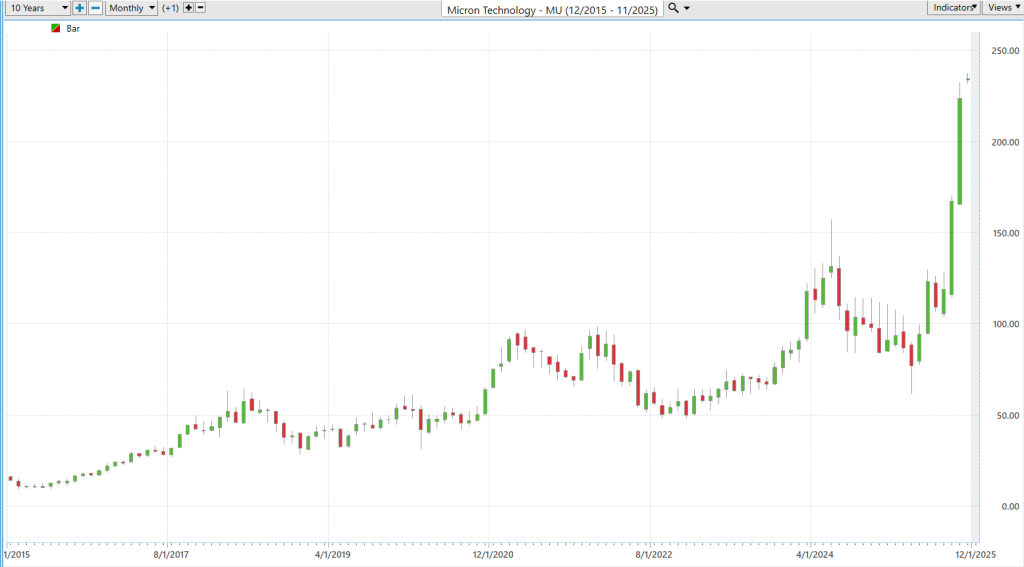
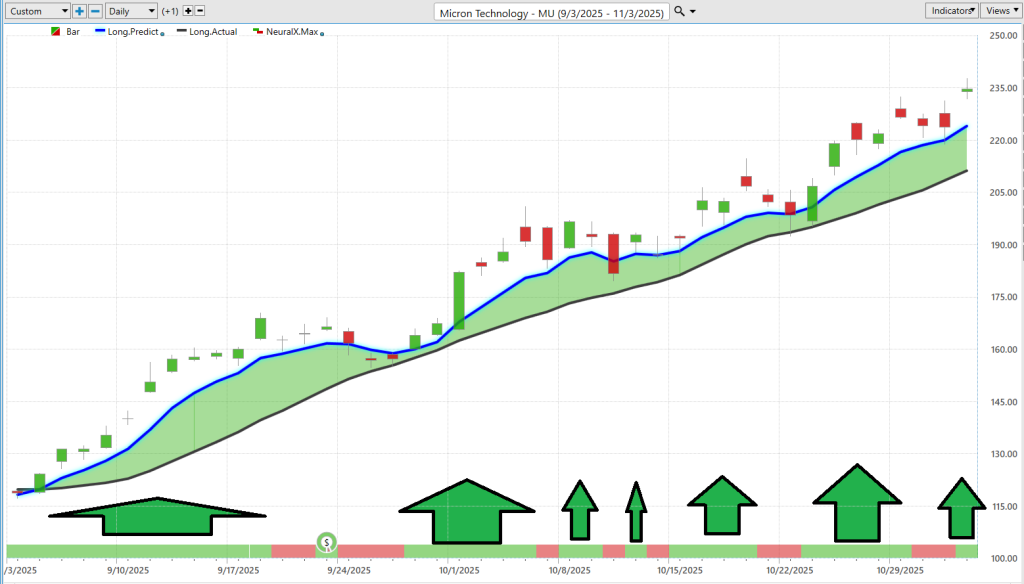
We also advise that you zoom out and look at the longer-term chart to understand the longer-term trajectory the stock has had. One of our favorite trading setups is whenever we find an asset that is simultaneously making new 52-week and new 10-year highs. $MU has been is this condition for the last few months.
Best-Case/Worst-Case Analysis
Wall Street loves to make volatility sound like it requires a PhD in Advanced Quantitative Sorcery. They’ll throw acronyms at you like they’re casting spells: Beta-weighted Vega, Implied Volatility Skew, Stochastic Variance Surface Modeling.
They’ll make it sound like the only way to understand volatility is to stare at quadratic equations until your eyes water.
But here’s the truth:
Volatility is just how far something goes up and how far it goes down.
That’s it.
No secret handshake.
No hidden priesthood.
No Gregorian chants required.
Take the biggest rallies and the biggest declines over the past year, measure them in percentages and, boom, you now understand volatility better than half the analysts on CNBC.
This simple exercise tells you three things:
- How fast the stock can fall when things go bad.
- How fast the stock can rise when things go well.
- What kind of emotional medication you should keep nearby.
Volatility isn’t theory.
It’s risk and reward measured in bruises and trophies.
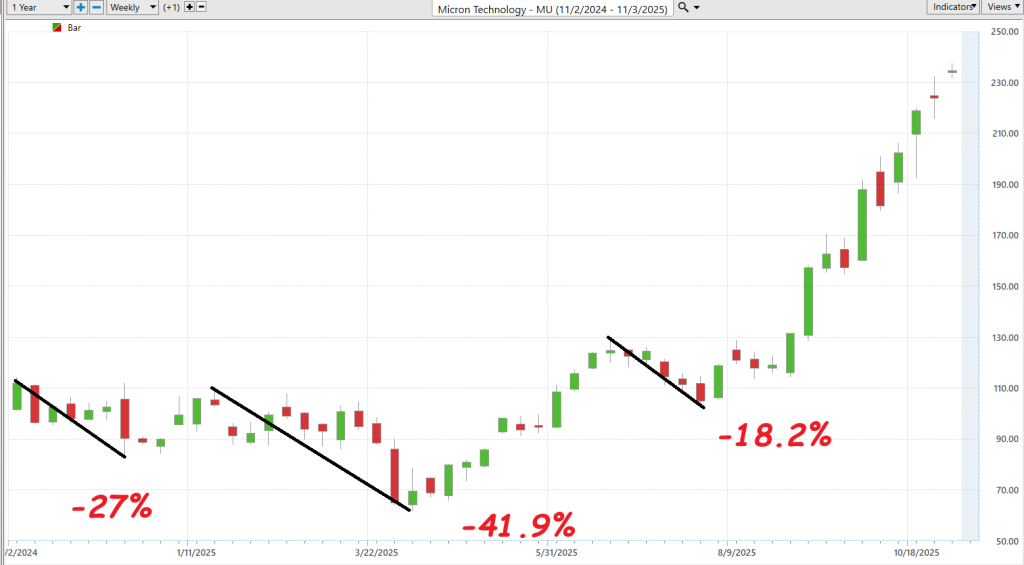
Picture Micron (MU) over the past year like a heavyweight contender with a caffeine problem. The first chart shows the drawdowns — the gut-punches:
- First drop: -27%
- Then -41.9% (the kind that makes long-term investors start googling “alternative careers”)
- Then another -18.2% on the way up just to keep everyone humble.
This is the market saying:
“You sure you want to be here?”
Now flip to the second chart — the rallies — the payoffs:

- +28.99%
- +21.9%
- Then a monster +104.15%
- And the “are you kidding me?” +126.5% moonshot.
This is the market saying:
“Fortune favors the stubborn.”
So, what does this tell us?
Micron is not a stock you own.
Micron is a roller coaster that you ride intentionally.
You respect the dips because they’re real — and you ride the waves because they’re powerful.
If you show up expecting stability, you’re going to lose a shoe and maybe a limb.
But if you show up prepared for motion — with stops, position sizing, and the understanding that volatility is the feature, not the bug — then Micron is an opportunity machine.
Because when a stock can drop 40% and then rip 100%+?
That’s not boring.
That’s not random.
That is a trader’s playground.
And here’s the key:
You don’t need a formula to trade volatility.
You just need to measure the swings and respect the tide.
Everything else?
Noise for people who like to sound smart more than make money.
Look, nobody stares at a stock in a vacuum. We always compare it to something we already know. It’s how the brain works. It’s how traders keep score. So when we stack Micron ($MU) up against the Nasdaq, S&P 500, Dow, and Russell 2000, the picture gets loud and undeniable.
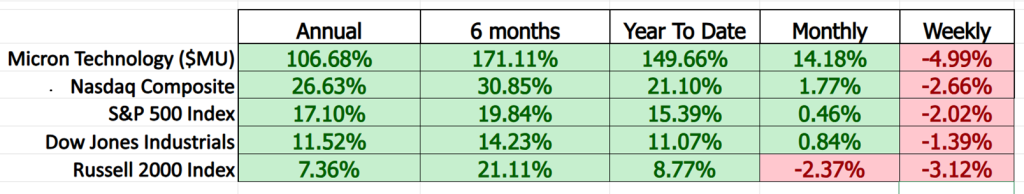
While the major indexes are jogging — respectable double-digit gains, slow and steady like they’re training for a charity 5K — Micron is running like it stole something.
Over the past year? +106%.
Six months? +171%.
Year-to-date? +149%.
That’s not “outperforming.”
That’s escaping orbit.
But here’s the important part…
We compare $MU to the indexes not to brag about the numbers, but to understand the environment. If the whole market was ripping like this, we’d shrug and call it a rising-tide story. But it’s not. The indexes are up, sure — but they’re up like normal markets rise.
$MU is moving like it’s plugged into a different power source.
That tells you one thing:
This isn’t just momentum.
This is leadership.
And in markets, leaders lead until they don’t.
The smart money watches them.
The timid money chases them.
The late money regrets them.
Right now?
Micron isn’t following the market.
The market is trying to catch Micron.
Vantagepoint A.I. Predictive Blue Line
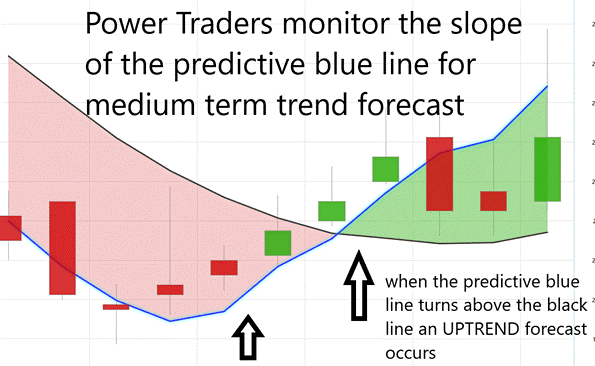
The VantagePoint Predictive Blue Line is designed to do something that most traders spend years trying to master: identify the real trend before the crowd sees it. It works by forecasting where price is likely to move based on intermarket relationships, meaning it doesn’t just look at the stock itself, but at the macro web of influences surrounding it: futures, related equities, sector ETFs, global indexes, and even currencies and commodities. The rule is straightforward: when the Predictive Blue Line is above the black line (the Actual), the trend is considered up and long positions are favored. When the Blue Line crosses below the black line, the trend has shifted, and positions should be reduced, protected, or exited. No guessing, no gut feel. The line defines the trend. It becomes a roadmap: stay long as long as the blue line stays in control; step aside when it gives way. The simplicity is the edge.

Now, look at the chart. The entry signal appears at the very beginning of the move — before the headlines, before the analyst upgrades, before the momentum-chasing crowd arrived. From that point forward, the Blue Line stays consistently above the Actual line, forming a rising green “value zone” where buyers step in again and again. Even during the normal pullbacks — moments that shake out weaker hands—the trend remained intact. The system didn’t flinch. And as price climbed from the low $120s all the way into the $230s, the message remained consistent: the trend is up — stay with it. This is what disciplined trend identification looks like: not prediction, but alignment with the strongest force in the market—momentum.
Neural Network Forecast (Machine Learning)
Most traders don’t like to admit it, but the truth is simple: most decision-making in the markets is barely more sophisticated than flipping a coin. We dress it up with news headlines, analyst opinions, gut feelings, moving averages, Fibonacci levels, and whatever someone on YouTube said last Tuesday — but when the pressure hits, most decisions come down to emotional impulse. Hope or fear. In or out. Buy or sell. And when decisions are emotional, outcomes are random.
This is exactly where the VantagePoint A.I. Neural Index changes the equation.
At the bottom of the chart, you’ll see the Neural Index displayed as a simple color-coded signal: green or red.
- Green indicates strength — meaning the A.I. expects higher prices or upward momentum over the next 48 to 72 hours.
- Red signals weakness — suggesting lower prices or downward momentum over that same short-term window.
This doesn’t replace the trend — it enhances decision timing inside the trend. The Neural Index doesn’t guess. It doesn’t feel. It evaluates patterns and intermarket relationships the human mind simply cannot compute on its own. It’s running probability models across dozens of correlated markets simultaneously — something even the most experienced trader with three screens and four cups of coffee has zero chance of doing manually.
So while human traders react to the present — the Neural Index is estimating outcomes.
It acts like a probability amplifier — telling you when the wind is at your back and when it’s shifting against you.
Because the real goal isn’t just to know the trend —
It’s to know the moments when the trend is likely to accelerate or stall.
And that is the advantage:
Where most traders flip coins, you evaluate probabilities.
Where most decisions are emotional, yours become informed.
Where most react to the market, you anticipate it.
VantagePoint A.I. Daily Range Forecast
Let’s start with the obvious: traders love statistics the way accountants love Scotch — enthusiastically and often with a quiet sense of dread.
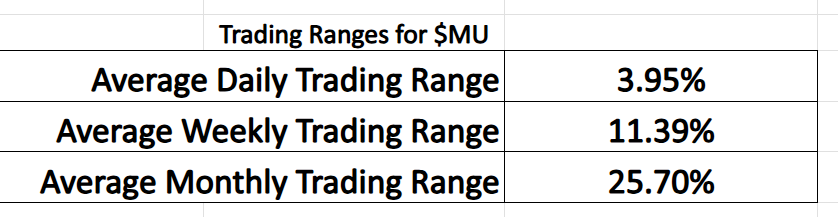
So yes, we can quote the average daily trading range of 3.95%, the weekly swing of 11.39%, and the monthly chaos at 25.70% like we’re reading weather reports from a slightly deranged meteorologist. These numbers tell us one thing: $MU moves. It doesn’t stroll, it doesn’t shuffle, it leaps like it’s being chased by a tax audit. Which is great. But knowing how far something moves tells you nothing about where to do anything about it. It’s like knowing a bull is charging — useful, but not nearly as useful as knowing which direction it’s coming from.
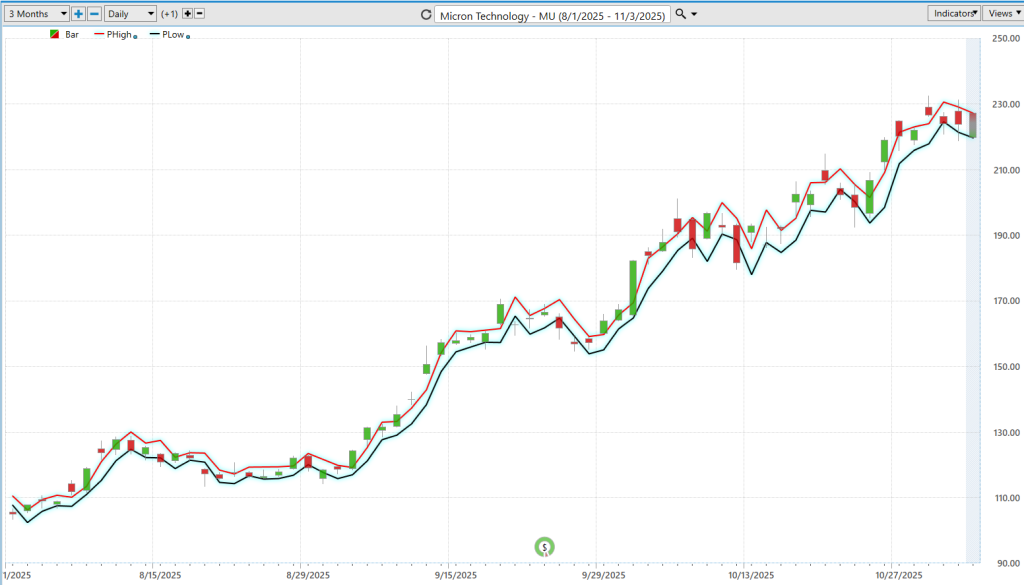
Now take a look at the second chart — the Daily Range Forecast — those tidy little projected highs and lows that appear as if the market suddenly got manners. This is where things stop being philosophy and start becoming tradeable reality. Because even though Micron swings around like a caffeinated rodeo horse, the daily range forecast gives you a sense of where buyers are likely to step in and where sellers might start making trouble. In other words: the edges. And edges are where traders live, profit, curse, and refill their coffee. Without a framework like this, trading volatility is just gambling with better stationery.
Because here’s the punchline: Volatility is only an opportunity if you know where to stand while the fireworks are going off. Otherwise, it’s just loud noises and regret. With $MU, there’s plenty of meat on the bone — juicy, satisfying, high-protein trading potential every single day. But the key is precision. Not “I think it might go up,” but “Here’s where the probabilities align.” The Daily Range Forecast is essentially saying, “Sure, the market’s crazy — but here’s how to survive and maybe even look smart doing it.” And in the world of trading, that’s about as close to dignity as it gets.
Intermarket Analysis
Micron ($MU) doesn’t move in a vacuum — it moves because the rest of the market pushes, pulls, nudges, and occasionally body-slams it. This is intermarket analysis, which is just a fancy way of saying: follow the money, follow the relationships, follow who’s influencing who.
First, Tech leadership. Micron runs with the A.I. crowd — Nvidia, AMD, the Nasdaq overall. When the big dogs in AI are charging, Micron gets dragged higher with them. When they stumble, Micron feels it instantly. Chips are the oxygen of AI right now — and if demand for compute keeps accelerating, this stock has the wind at its back.
Second, interest rates. When money gets expensive, building chip factories becomes a pain. When money gets cheap, capital flows, expansion kicks in, and the market starts pricing in the future. If the Fed is easing, Micron becomes a growth story. If the Fed is tightening, Micron becomes a cost story. Big difference.
Third, commodities and supply chains. Chips don’t magically appear — they require raw materials, energy, and well-oiled global logistics. If input costs rise, margins get squeezed. If China ramps up demand or opens the export spigot, the opposite happens. This is where macro meets micro in real time.
Fourth, the Dollar. Strong dollar hurts Micron overseas. Weak dollar helps. It’s that simple. If the global customer base can afford more chips, revenue expands. If they can’t, revenue contracts. No complicated economics required.
And finally, policy and geopolitics. We are in the era of semiconductor nationalism. The CHIPS Act, reshoring, and strategic tech competition with China all matter. These aren’t headlines — they are structural tailwinds and headwinds.
So what’s the punchline?
Micron is tied into the core of the global economy — A.I., energy, supply chains, interest rates, currencies, and national strategy. When these forces align, Micron moves like it has a rocket strapped to it. When they clash, it retreats fast.
This is the market in motion.
And a trader who watches the drivers doesn’t react — they anticipate.
Here are the 31 key drivers of $MU price action:
Our Suggestion
Micron isn’t just doing well — it’s on a tear. Revenue didn’t “grow.” It blew up — from $25B to $37B in one year. Margins went from “we’re doing okay” to “pop the hood this engine is on fire.” Cash? They’re stacking nearly $10B of it, while the debt is manageable and the free cash flow is pouring in like beer at a tailgate. Translation: they’ve got ammo. Lots of it.
And here’s the real juice — the entire A.I. boom runs on memory. Every chatbot, every robot, every futuristic “look-mom-I’m-thinking” processor needs Micron’s high-bandwidth chips just to function. NVIDIA might get the headlines, but Micron is the guy backstage making sure the lights stay on. That’s why the stock chart looks less like a stock chart and more like a rocket launch sequence.
But — and it’s a big but — this is a cycle. When demand is hot, profits rain from the sky. When demand cools, the whole memory market turns into a bargain bin at a yard sale. Prices collapse. Traders panic. And all those “to the moon” tweets age like warm milk.
So yeah — the upside is real. But don’t get cute. This one rewards timing… and punishes tourists.
Position sizing is crucial here. As is great money management. We think it deserves to be on your trading radar as it will create numerous trading opportunities over the next year.
Use the VantagePoint A.I. Daily Range forecast to locate short-term trading opportunities.
Let’s Be Careful Out There.
It’s Not Magic.
It’s Machine Learning.
Disclaimer: THERE IS A HIGH DEGREE OF RISK INVOLVED IN TRADING. IT IS NOT PRUDENT OR ADVISABLE TO MAKE TRADING DECISIONS THAT ARE BEYOND YOUR FINANCIAL MEANS OR INVOLVE TRADING CAPITAL THAT YOU ARE NOT WILLING AND CAPABLE OF LOSING.
VANTAGEPOINT’S MARKETING CAMPAIGNS, OF ANY KIND, DO NOT CONSTITUTE TRADING ADVICE OR AN ENDORSEMENT OR RECOMMENDATION BY VANTAGEPOINT AI OR ANY ASSOCIATED AFFILIATES OF ANY TRADING METHODS, PROGRAMS, SYSTEMS OR ROUTINES. VANTAGEPOINT’S PERSONNEL ARE NOT LICENSED BROKERS OR ADVISORS AND DO NOT OFFER TRADING ADVICE.


