This week’s ai stock spotlight is NOKIA ($NOK)
Nokia is a global communications powerhouse that builds the essential network infrastructure — mobile systems, cloud connectivity, and high-performance data routes — that keep our digital lives online and moving forward. Nokia is that seasoned heavyweight fighter, still stepping into the ring with purpose while the flashy startup crowd dances around looking for likes. This is a company built for real-world impact, not viral trends. Traders often forget that our entire digital economy depends on the unsung heroes who wire the world together. Without players like Nokia, your smartphone becomes an overpriced flashlight and your binge-watching habits turn into a weekend with actual books.
We’re not talking about the nostalgia-era Nokia that gave us unbreakable phones and the greatest mobile game of its time. This is the modern Nokia: the architect of global connectivity. They build the infrastructure that keeps data flowing, conversations happening, and innovation expanding. Mobile networks, cloud pathways, optical technology, everything that powers the modern experience and helps us avoid awkward face-to-face conversations. This is the backbone of the digital future, and Nokia is still right there tightening every bolt.
They’re headquartered in Finland because someone has to keep the place warm with 5G base stations. They supply North America, China, India, and every other region that wants a digital life upgrade. Revenue is in the €19–22 billion range. Margins exist. Growth exists. It’s just the slow-and-steady kind that traders pretend they don’t like, then quietly buy anyway when the fear of missing out turns into the terror of missing yield.
Competition? Ericsson. Huawei. The battle for telecom superiority is like an expensive cage match where everyone keeps slipping on regulatory banana peels.
Nokia tries to separate itself through network performance, cloud services, and enough R&D to power a thousand nerd conferences. The mission: convince carriers to spend more money sooner instead of doing what they always do, which is “Eh… maybe next year.”
Their cash pile and debt load won’t win awards, but the foundation is solid enough that the building won’t collapse when the global economy catches a cold.
They just need capex spending from telecom giants to speed up, not slow down like a Sunday driver in the left lane.
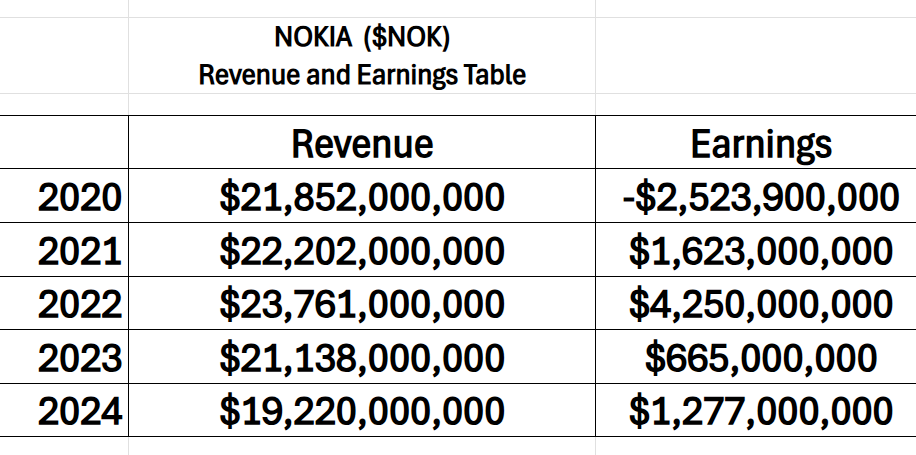
Look at this revenue and earnings table for the last 5 years like it’s a battle map. Nokia has spent the last five years trudging through a financial war zone where every step forward came with a surprise explosion. One year, the company looks like it’s finally catching stride. The next year, a pothole the size of a small nation appears. That’s the telecom infrastructure business for you: massive ambition, heavy equipment, and more economic landmines than anyone cares to admit.
Revenue has been a roller coaster with a chip on its shoulder. Growth spurts followed by sudden dips, as if the market couldn’t decide whether it wanted the future of connectivity or a return to rotary phones. Meanwhile, earnings have swung between comeback-kid energy and “let’s just survive this quarter” humility. It’s the financial equivalent of trying to run a marathon in a thunderstorm while carrying a base station on your back.
Yet here’s what matters. Through the volatility, through the headwinds, through the whiplash of investor sentiment, Nokia is still in the ring. Companies that build the backbone of the digital world don’t win by looking smooth. They win by staying upright. Nokia’s story isn’t a straight line upward. It’s a gritty trail of persistence. And sometimes, that’s exactly where the biggest turnarounds are born.
What could spark a rally?
The 5G/6G build-out isn’t optional. It’s like gravity and taxes: permanent and annoying. The more data humans binge, the more Nokia is in business. Any shock event that makes countries say “We need secure networks now” could drop a pile of contracts on Nokia’s doorstep like Amazon packages after Black Friday.
The Risks?
Everything else. Telecom operators are cheap, competition is vicious, regulation is political theater, and technology keeps changing faster than teenagers’ slang. If Nokia slips up, traders won’t give them a Hallmark moment. They’ll give them a funeral.
So, here’s the takeaway.
Nokia finally crashed the A.I. party and showed up with something the market actually cares about: data-center networking gear that makes A.I. models talk to each other instead of crashing like your uncle’s ancient router. Demand from A.I. and cloud customers is rising, especially in North America, and that’s giving Nokia a new identity beyond the ghost of indestructible flip phones. Management has been shouting this from the earnings-call rooftop: the future is network infrastructure wired for A.I. traffic, not the tired old mobile-network business that keeps dragging its feet like Monday morning.
Then there’s the less-sexy stuff that traders pretend doesn’t exist until it kicks them in the P&L: currency swings, tariffs, and soft mobile-network spending are still punching the numbers in the face. Revenue and profit guidance have been clipped. The old business is shrinking faster than the new AI-powered one is growing, so Nokia has to hustle if it wants to call this a comeback instead of a mid-life crisis.
But here’s the good news tattooed across the stock chart: NVIDIA just wrote a billion-dollar love letter to Nokia. A 2.9 percent stake and a collaboration deal is Wall Street for “we approve this message,” and the stock exploded to near decade-highs the moment the news hit. That’s not just a partnership. That’s Nvidia handing Nokia a VIP pass to the A.I. infrastructure club. If they execute, this turns into a real growth story. If they fumble, well…at least they tried.
Nokia is that middleweight fighter who knows how to take a punch and keep going. It’s not a meme rocket. It’s not a moonshot biotech lottery ticket. It’s a real business doing real things that real society depends on. If you want volatility candy, look elsewhere. If you want a steady grind with the potential to surprise the market when the world finally admits it needs to upgrade the internet again, Nokia deserves a seat in the watchlist… maybe right next to the stocks your financial advisor says are “boring” right before they beat his performance by 3% annually.
Pay attention to network spending cycles. Watch earnings. Don’t fall asleep. Because the company that once fit in your pocket might wind up powering everything in it.
In this weekly stock study, we will look at an analysis of the following indicators and metrics which are our guidelines which dictate our behavior in deciding whether to buy, sell or stand aside on a particular stock.
· Wall Street Analysts Ratings and Forecasts
· 52 Week High and Low Boundaries
· Best-Case/Worst-Case Analysis
· Vantagepoint A.I. Predictive Blue Line
· Neural Network Forecast (Machine Learning)
· VantagePoint A.I. Daily Range Forecast
· Intermarket Analysis
· VantagePoint A.I. Seasonal Analysis
· Our Suggestion
While we make all our decisions based upon the artificial intelligence forecasts, we do look at the fundamentals briefly, just to understand the financial landscape that $NOK is operating in.
Wall Street Analysts Forecasts
Listen up. Every trader worth more than a crusty Robinhood account knows this truth: if you want to understand where a stock can really go, you don’t obsess over the middle-of-the-road analyst target. That’s like betting on the horse that “probably won’t finish last.” Boring. Safe. Useless.
The real action lives at the extremes.
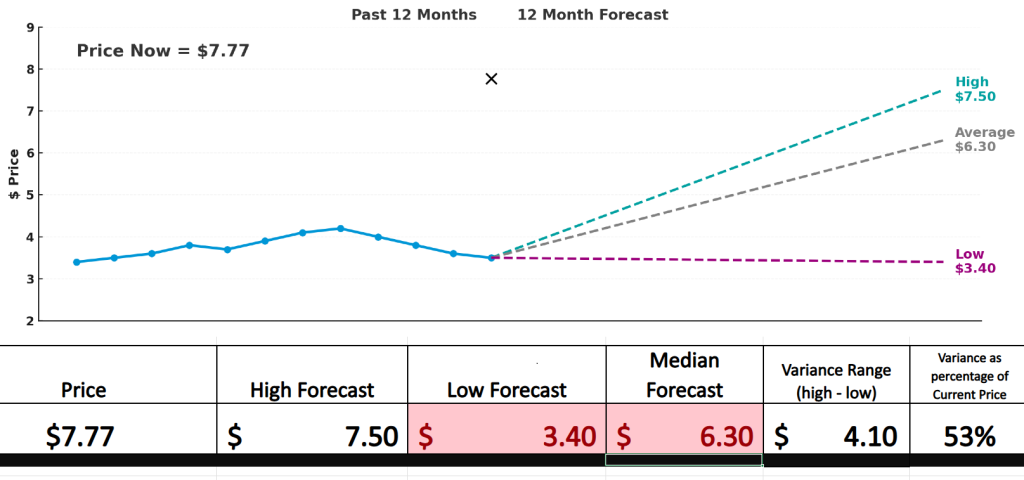
You want the most bullish forecast some Wall Street hotshot is willing to put his name on. Then you want the most bearish doom-and-gloom prediction from the guy who thinks everything eventually craters. Those are the poles of tension. Hope vs. panic. Optimism vs. despair. Hedgies vs. Reddit. And right there in the spread between those two numbers… that’s where volatility is born.
Here’s the punchline: you take the high forecast, subtract the low forecast, and that’s your forward battleground. In this case, the spread comes out to $4.10. That’s 53% of the current price. Which means? The market is gearing up for a fight. A big one. A bucking bronco of potential movement that could yank your account into glory or face-plant it into the dirt if you’re not strapped in tight.
So don’t kid yourself with cushy averages. Pay attention to the edges. Because volatility doesn’t ring the doorbell. It busts the hinges clean off.
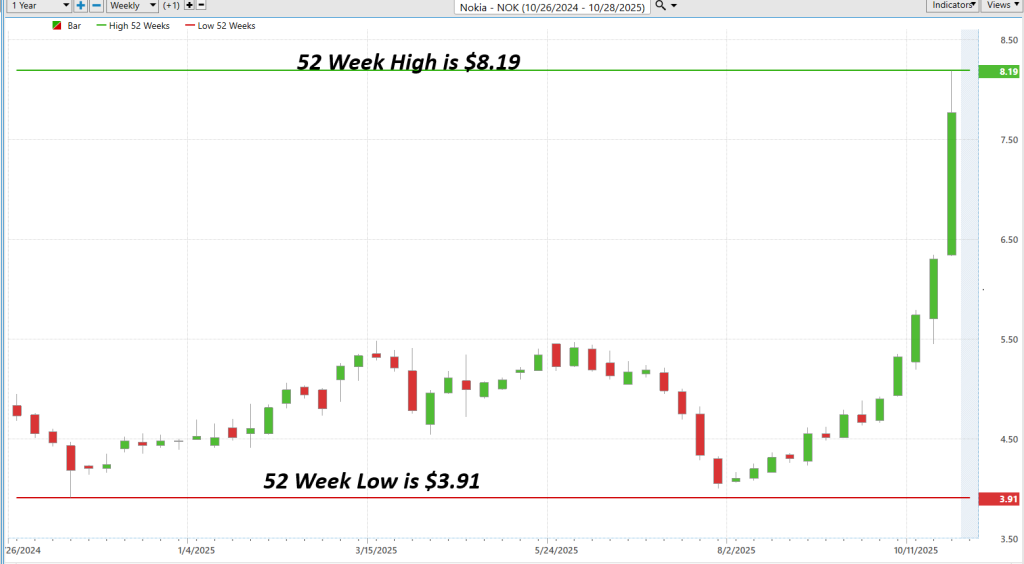
52 Week High and Low Boundaries
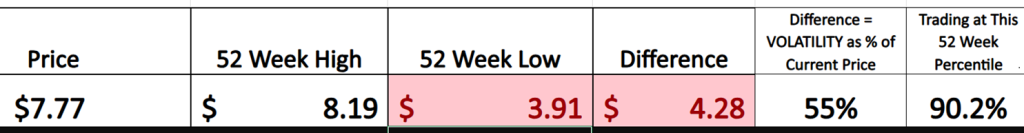
Take a look at these charts and tables like they’re the guardrails on a mountain road. On one side, you’ve got Nokia’s 52-week high. On the other, the 52-week low. A clean, simple snapshot of how savage and unpredictable the telecom game can be. The distance between those extremes is $4.28. That’s not just a number. That’s the battlefield where bulls and bears have been trading punches for an entire year.
Now here’s the punchline that should make traders sit up in their seats: that $4.28 gap represents 55% volatility based on the current price. That’s the stock market equivalent of a roller coaster that requires a seatbelt and possibly a signed waiver. And that’s not some manufactured statistic from an options pricing model, either. That’s what the market actually did over the last 52 weeks.
Then… go ahead and compare that to Wall Street’s expected volatility. Analysts have drawn their high and low targets and the distance between them represents 53% expected volatility. Think about that. Two completely different calculations. One based on real-world price behavior. One based on expert projections about the future. Yet they arrive at almost the same wild number.
When the math from history and the forecasts from the smartest people in the building line up that closely, it isn’t a coincidence. It’s a signal. The market is telling us that Nokia doesn’t trade like a sleepy old telecom name anymore. It trades like a stock with something big brewing. That kind of volatility doesn’t show up for no reason. It shows up when there’s a new narrative taking over… and everyone wants to know whether they should chase it or short it into oblivion.
The guardrails are wide. The speed is high. This is where real traders thrive.
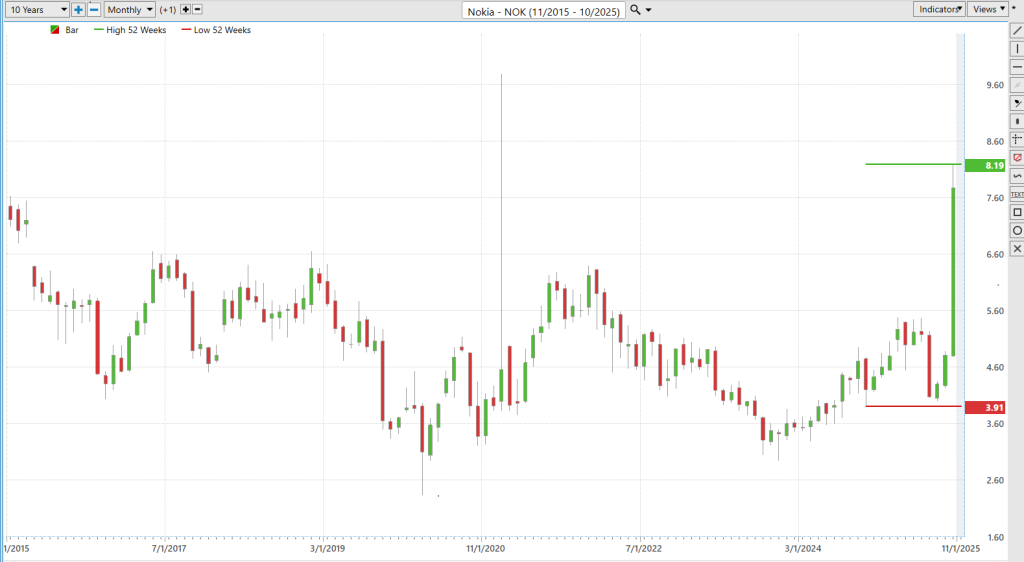
Notice how $NOK is making new 52-week highs and challenging its $10 year high. You should place $NOK on your watchlist for this reason. Stocks that are challenging decade long high levels always offer tremendous instructional lessons as well.
Best-Case/Worst-Case Analysis
Volatility isn’t a math problem. It’s not a Greek symbol hiding inside a pricing model or some equation the quants use to feel smarter than everyone else. Wall Street has an entire cathedral of formulas trying to bottle the chaos of the market, but out here in the real world, volatility is what you feel in your gut when a stock rips higher or caves beneath your feet.
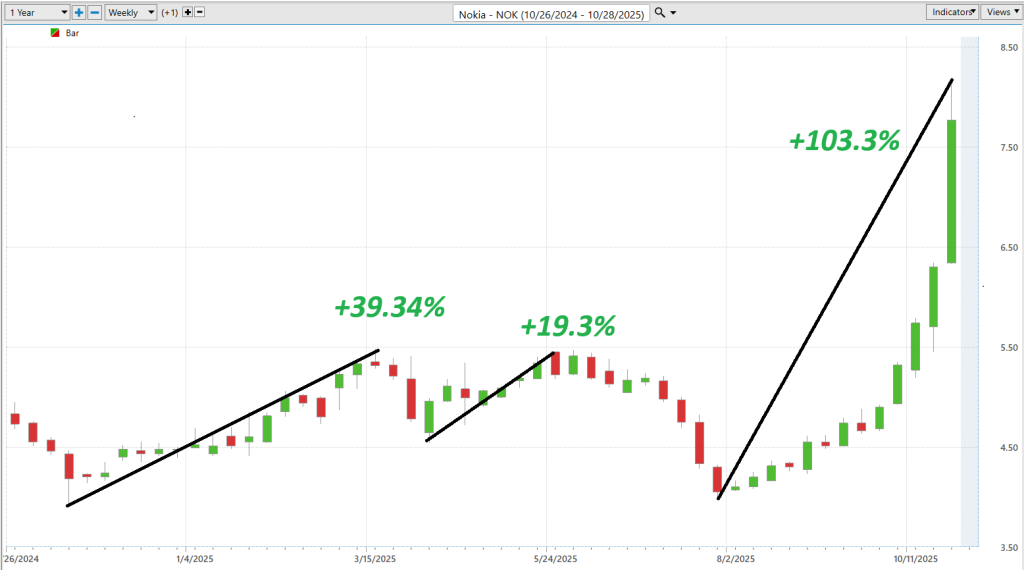
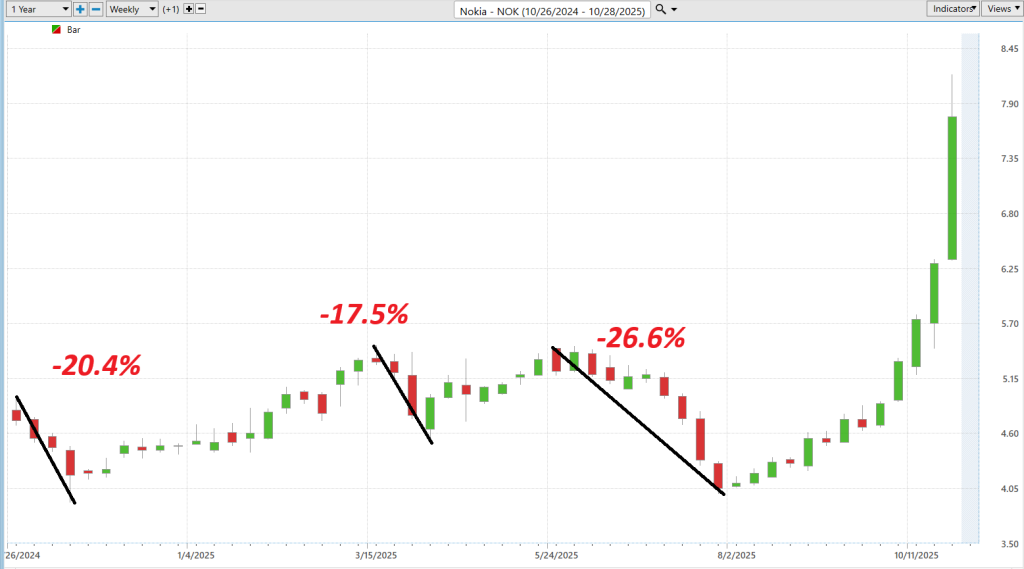
So, I take a simpler approach. Practical. Human. I look at the best rallies and the worst declines over the past year. That’s it. Because if a stock has already proven it can rocket +40%, +100% in a matter of weeks, that tells me what kind of upside this beast is capable of when momentum starts throwing haymakers. And if that same stock has dropped −20%, −26%, −17% with no warning, that tells me the exact danger zone I’m entering every time I hit “buy.”
This is what we call Best-Case / Worst-Case Analysis. Not theoretical volatility — experienced volatility.
Now look at the first chart. Those bright green ascents. Explosive doesn’t even begin to describe them. One run is +39.34%. Another is +19.3%. And that last surge? A jaw-dropping +103.3% rocket launch. Those aren’t numbers from a sleepy telecom relic. That’s the behavior of a stock that has tasted adrenaline and wants more.
Then the second chart yanks your head back to reality. You’ve got three brutal swoons: −20.4%, −17.5%, −26.6%. Those aren’t tiny fluctuations. Those are the kinds of drops that make amateurs panic-sell and professionals double-check their stop-losses. Then the second chart yanks your head back to reality. You’ve got three brutal swoons: −20.4%, −17.5%, −26.6%. Those aren’t tiny fluctuations. Those are the kinds of drops that make amateurs panic-sell and professionals double-check their stop-losses.
Together, these pictures tell a story every trader needs to hear:
Nokia isn’t a gentle stroll up the mountain. It’s a climb-then-fall-then-climb-again adventure. The upside is real. The downside is real. And volatility? It’s not some abstract concept — it’s right there on the chart beating its chest.
Best-Case / Worst-Case Analysis gives us a clear map of what has already happened. And if there’s one eternal truth in markets, it’s this:
Past volatility doesn’t guarantee the future…but it sure warns you what the road feels like.
Here’s the story behind that chart, and it’s a compelling one.
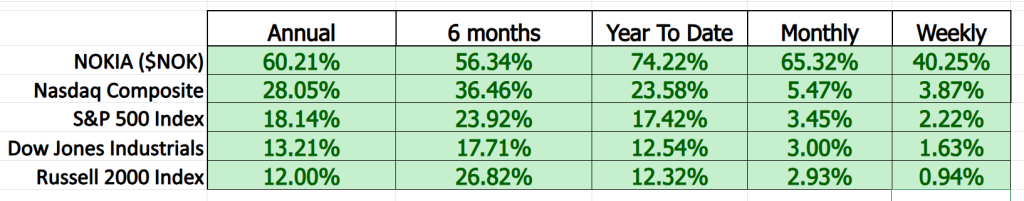
When you stack Nokia up against the major U.S. equity benchmarks — the Nasdaq Composite, the S&P 500, the Dow Jones Industrials, the Russell 2000 — something jumps out immediately. This isn’t a quiet recovery or a modest bounce. Nokia is outperforming the market… across every major timeframe.
Over the past year, the Nasdaq’s impressive rally has been driven by AI leaders and cloud titans, yet Nokia more than doubles that performance. The S&P 500 — home to the most powerful corporations in the world — looks almost sleepy by comparison. Even in the monthly and weekly snapshots, where volatility can distort trends, Nokia’s momentum remains pronounced and consistent.
This is important, because traders and investors don’t make decisions in a vacuum. Outperformance relative to the indexes is a scoreboard that can’t be ignored. It signals money flow. It signals belief. It signals that someone — perhaps quietly at first — has been accumulating shares with conviction.
And when a stock dramatically outpaces the broader market not just once, but repeatedly over different time horizons, it suggests the move isn’t a fluke. It’s a trend. It reflects changing expectations about the company’s role in the future of communications infrastructure and AI-driven data networks.
The market has spoken with capital, and the message is clear: Nokia is no longer playing catch-up. It’s leading.
Vantagepoint A.I. Predictive Blue Line
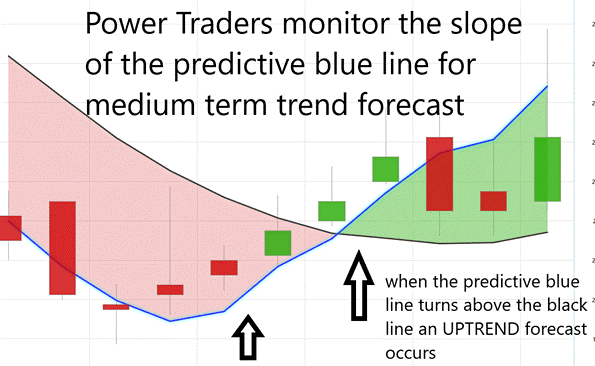
Here’s how to think about the Predictive Blue Line like a professional would — not as a mystical signal, but as a forward-looking gauge of where the market is actually leaning.
The rules are clear, and frankly, elegant. When the Predictive Blue Line moves above the dark line — that’s your cue: momentum is shifting higher, and the favorable trade is long, not neutral, not short. When the Blue Line dips below that same black line — the advantage flips, and caution or outright bearish positioning becomes the smart play. The distance between those two lines isn’t decorative — it reflects the strength of the trend and the conviction of money flow behind it.
You’re not reacting to yesterday’s prices. You’re trading off a forecast — an A.I.-powered expectation of tomorrow’s direction.
That’s what the chart below puts on full display. From the moment that Blue Line crossed above the long-term baseline — marked by that green arrow — Nokia didn’t just drift higher. It went vertical. A slow climb turned into a sudden acceleration, and then into a breakaway move that most traders only notice when it’s already front-page news. The kind of run that takes analysts from polite curiosity to open astonishment.
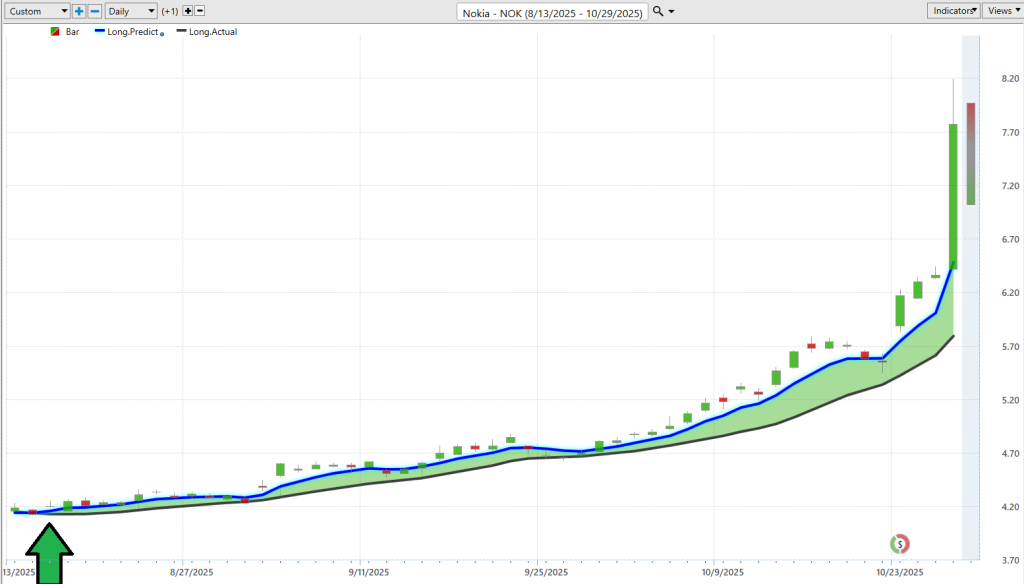
This is the power of artificial intelligence applied to financial markets: it turns uncertainty into clarity, and hesitation into action. Not by guessing… but by getting ahead of the crowd.
Neural Network Forecast (Machine Learning)
A neural network for trading is basically a souped-up artificial brain built from math and silicon instead of neurons and caffeine. It studies historical market data the way a detective studies crime scenes: looking for patterns the human mind is too impatient, emotional, or downright blind to notice. It takes price, volume, intermarket relationships, volatility, money flow, even how other assets are behaving — and it blends them into a model that keeps learning. Every day. Every tick. Every mistake.
How is it built? Think of layers. Input layers feed it raw market data. Hidden layers grind through all the ugly complexity — nonlinear relationships, correlations, lead/lag effects. Then an output layer spits out simple and actionable signals traders can actually use. Buy or sell? Strong or weak? Smooth sailing or incoming storm clouds? The network doesn’t guess. It calculates, adapts, and recalibrates — constantly.
Why does this help traders? Because humans stink at consistency. We chase green candles, we fear red ones, we swear we’ll be disciplined until the moment greed or panic grabs the wheel. A neural network doesn’t care about feelings. It cares about probability. It gives traders something priceless: a statistical edge in the moments when hesitation becomes the enemy.
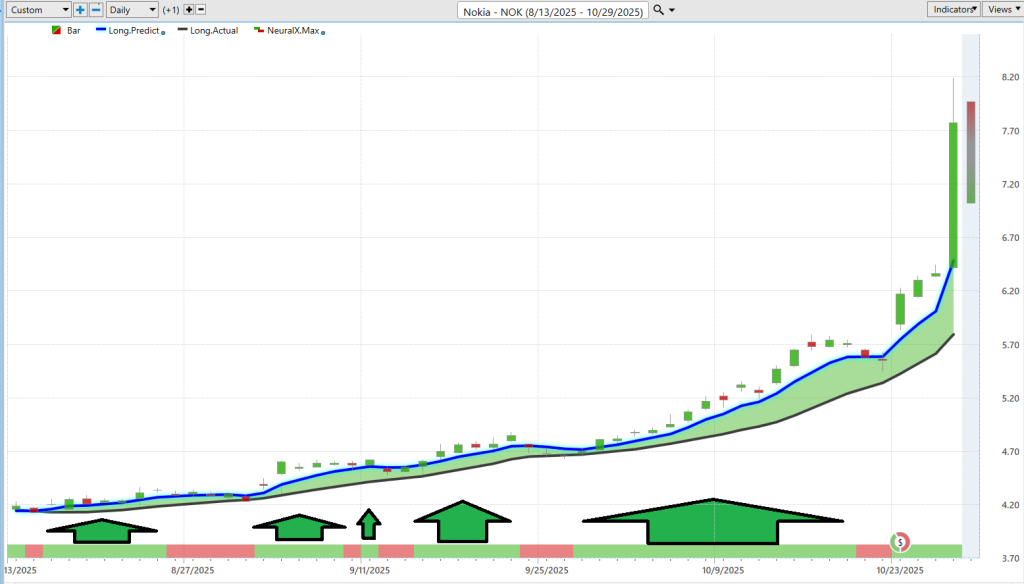
Now look at the chart. At the bottom? That’s the Neural Index: green and red bars that reveal the network’s short-term forecast. Green means the next 48–72 hours favor the long side — demand is strengthening, upside pressure is winning. Red means the bears are sharpening claws — favor the short side or stay out of the way. These aren’t long-term prophecies. They’re tactical signals designed to put traders on the right side of momentum before the crowd figures it out.
See what happened here. The Neural Index fired green early — quietly, confidently — while the price still looked like a boring telecom chart stuck in neutral. Then the move started. Slow at first. Then faster. Then Nokia turned into a rocket slingshotting past resistance, leaving latecomers racing to chase a trend already in motion.
No frantic news-scanning. No guessing which analyst is right. Just math-driven foresight saying:
“Momentum is coming. Get in while the door is still open.”
That bottom bar? It’s the whisper before the market shouts.
A neural network won’t make you fearless. It won’t cure impatience. It won’t stop you from sabotaging yourself.
But it will hand you a clearer picture of what the market is likely to do next.
And in this game… that little edge can change everything.
VantagePoint A.I. Daily Range Forecast
Here’s the brutal truth about short-term trading: you either know where price is likely to move next… or you’re just gambling with a nice chart background.
Where the rubber meets the road is precision. Knowing the boundaries. Anticipating the battlefield before the first shot is fired. That’s why the smartest traders don’t wake up asking, “Will Nokia go up or down today?” They ask:
“How far can it go?”
Because that’s where the profit lives.
Now look at this graphic which provide the information as to what the average daily, weekly and monthly trading ranges have been.
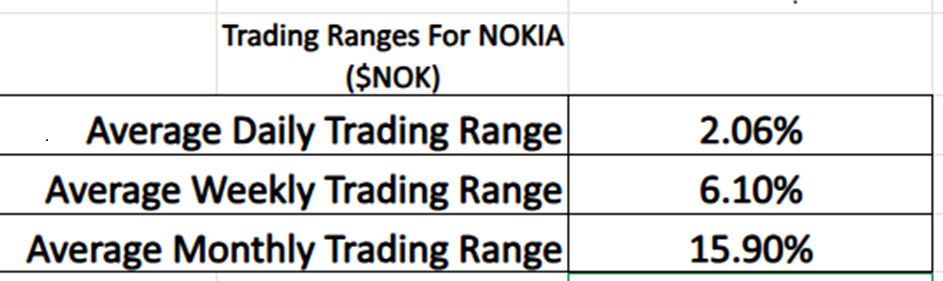
Nokia isn’t some sleepy telecom stock waiting for retirement. It moves. The average daily range is 2.06%. Weekly? 6.10%. Monthly? 15.90%. That is a ton of tasty price movement. There’s plenty of meat on this bone for the traders who like to take a bite every day. You don’t need a fortune teller. You need a plan.
And that brings us to VantagePoint A.I.’s Daily Range Forecast — the closest thing you’ll ever get to seeing tomorrow’s trading lanes painted on today’s chart. Those upper and lower boundary lines? They aren’t drawn by hope or hindsight. They are calculated in advance using a web of global market relationships so complex your laptop would need therapy to comprehend it.
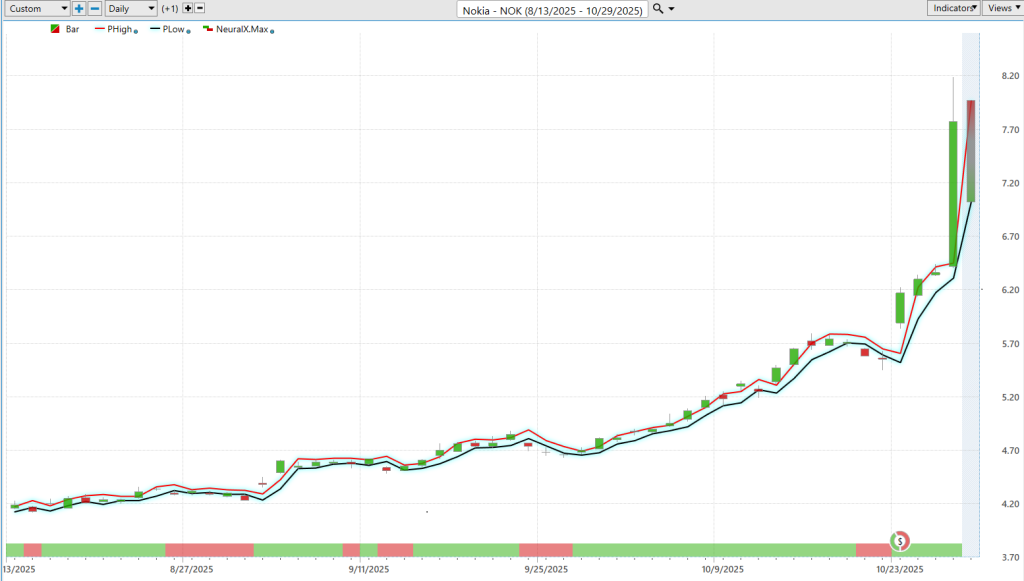
Go ahead. The price has been marching higher, pushing into a full-blown breakout. Yet every single day, those forecast boundaries adjusted perfectly — expanding when volatility expanded, tightening when the trend paused for breath. The forecast hugged price action like it already knew what the market was planning.
That’s not luck.
That’s a tactical edge.
Traders who knew these boundaries weren’t panicking when the candles fired straight up like a rocket. They were riding it. Scaling in on the lower boundary. Taking profits near the upper boundary. Controlling risk like professionals instead of adrenaline junkies.
Meanwhile, the amateurs were busy tweeting about “FOMO” and wondering if they should chase the move after it was halfway over.
Short-term trading isn’t about predicting direction with a prayer.
It’s about anticipating the playable range with certainty.
Nokia is giving traders the kind of volatility they dream about.
The Daily Range Forecast gives them the confidence to capture it.
That’s how the real money gets made.
Intermarket Analysis
Nokia isn’t some nostalgia-soaked phone relic. It’s the crew laying down the invisible superhighways that let the entire digital economy run full-speed. Every uptick in that stock price isn’t random. It’s the market placing bets on whether Nokia keeps wiring the future or gets trampled by the next wave of tech. The smart money watches $NOK like a hawk because the company’s success is tied to the growth of AI networks, data centers, and 5G infrastructure. In other words, they’re selling the shovels in the new digital gold rush.
Here’s where the plot thickens. Nokia’s stock doesn’t move in isolation like some lonely monk in a Finnish forest. It reacts to the big dogs around it. Nvidia throws a billion-dollar lifeline into the AI-networking partnership pool? Boom — Nokia rockets to decade-highs in a single trading session. Global tech rallies? Nokia surfs that wave. But if interest rates choke spending or Europe’s currency wobbles, suddenly Nokia feels like it’s pedaling uphill with two flat tires. The world’s capital markets yank this stock around like a pitbull with a rope toy.
So, what comes next? Nokia is riding a monster tailwind: A.I. infrastructure expansion meets 5G deployment meets a suddenly very interested Wall Street. This stock is no longer waiting politely for investors to notice it. It’s kicking the saloon doors open and demanding attention. Traders who understand how these macro forces collide have a shot at catching the next explosive move. Those who don’t? They’ll be stuck watching the chart after the real money has already been made.
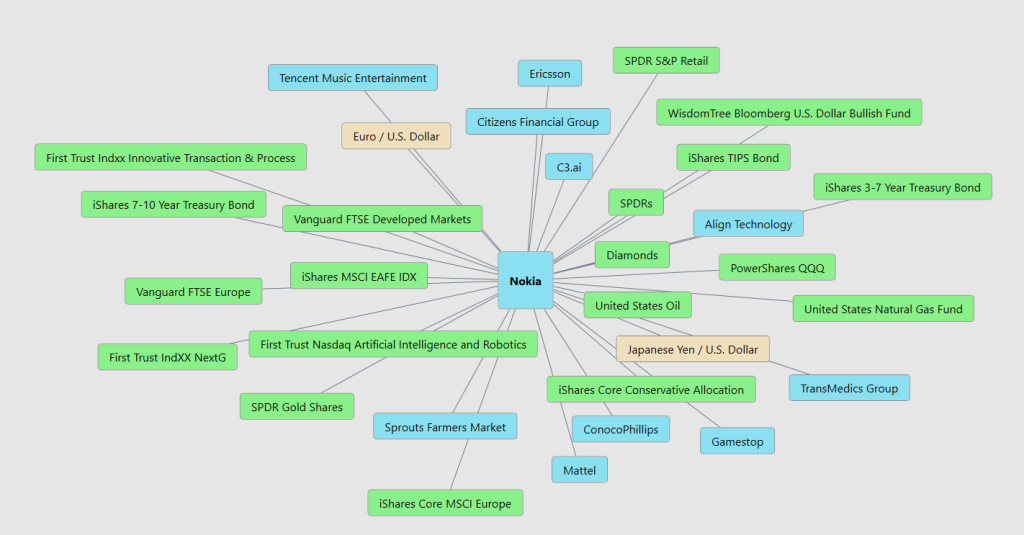
This intermarket map reveals the 31 key price drivers of Nokia ($NOK), the hidden forces shaping every major move the stock makes. It’s not just about telecom peers like Ericsson or AI partners like C3.ai — $NOK responds to sweeping global currents: currency strength (Euro/USD, Yen/USD), commodity demand (oil, natural gas, diamonds), interest rates (multiple Treasury bonds), and even the performance of massive ETFs like QQQ and SPDRs. These relationships are where traders uncover real edge. Study this chart closely and you’ll spot the unexpected allies and silent saboteurs influencing Nokia’s valuation every single day. If you want to forecast where $NOK is heading next, this is the roadmap.
Our Suggestion
Across the last two earnings calls, Nokia sounded like a company finally comfortable telling a growth story again. Management leaned hard into a pivot from “handset nostalgia” to “A.I.-era plumbing,” pointing to rising orders tied to data-center interconnect, optical transport, and cloud-scale networking. They framed the business as a beneficiary of hyperscaler build-outs and carrier upgrades, while acknowledging the drag from slower mobile-network spending and regional capex hesitancy.
On goals, they’re hitting the ones that matter to this narrative: mix shifting toward higher-margin infrastructure, disciplined cost control, and a tighter focus on cash generation. The misses are familiar: timing risk on carrier budgets, uneven regional demand, and currency/tariff noise that can dent margins quarter to quarter. The risk ledger is clear: execution on large AI-adjacent contracts, competitive pressure from Ericsson/Huawei, and the classic telecom cycle slippage that turns “next quarter” into “next year.” Now the headline: an endorsement and partnership with NVDA is a genuine step-function upgrade to credibility in A.I. networking. It validates the roadmap and broadens distribution into the hottest stack in tech.
How much farther can the stock go? That depends on proof, not press releases. If A.I./optical wins turn into multi-quarter revenue cadence and margin lift, the rerate can continue; if carrier spend stalls or integration disappoints, the multiple compresses just as quickly as it expanded.
Where the risk really sits: three places. First, capex timing — beautiful slide decks don’t ship routers. Second, margin integrity — components, currencies, and price competition can whipsaw profitability. Third, expectations—the bar is higher after the rally; even “good” prints can underwhelm if the market wants “great.”
Why NVDA matters: it’s not just capital; it’s the signal. Being wired into NVDA’s A.I. infrastructure roadmap turns Nokia from a peripheral vendor into a perceived core supplier for low-latency, high-throughput AI networks. That expands the opportunity set and compresses the doubt — so long as deliveries match the press.
Nokia just muscled its way from the kids’ table to the main stage. Two calls in a row, management talked less about surviving cycles and more about selling the highway the A.I. boom needs. Risks are real — carriers delay, margins wobble, competition bites — but the thesis finally has an engine, not just a hood ornament.
Put $NOK on the watch list. Call it what it is: a potential turnaround with a lot more mileage. It’s printing fresh 52-week highs and — yes — pushing decade highs. That’s not luck; that’s money flow voting for the new story. Trade it like a pro: define risk first, size positions sanely, trail winners, and never fall in love with a ticker. Solid money management on every trade, every time. That’s how you let the upside do its job while you live to trade the next setup.
Let’s Be Careful Out There.
It’s not magic.
It’s machine learning.
Disclaimer: THERE IS A HIGH DEGREE OF RISK INVOLVED IN TRADING. IT IS NOT PRUDENT OR ADVISABLE TO MAKE TRADING DECISIONS THAT ARE BEYOND YOUR FINANCIAL MEANS OR INVOLVE TRADING CAPITAL THAT YOU ARE NOT WILLING AND CAPABLE OF LOSING.
VANTAGEPOINT’S MARKETING CAMPAIGNS, OF ANY KIND, DO NOT CONSTITUTE TRADING ADVICE OR AN ENDORSEMENT OR RECOMMENDATION BY VANTAGEPOINT AI OR ANY ASSOCIATED AFFILIATES OF ANY TRADING METHODS, PROGRAMS, SYSTEMS OR ROUTINES. VANTAGEPOINT’S PERSONNEL ARE NOT LICENSED BROKERS OR ADVISORS AND DO NOT OFFER TRADING ADVICE.