





This week’s AI stock spotlight is Navitas Semiconductor ($NVTS)
Navitas Semiconductor is one of those companies that sounds boring right up until you realize it sits directly in the middle of several trillion-dollar industrial knife fights. Founded in 2014, the company set out to replace old silicon power chips with faster, cooler, more efficient gallium nitride technology. Then the world decided it wanted electric vehicles, artificial intelligence data centers, solar power, robotics, and enough electricity to light up Las Vegas from orbit. Navitas suddenly looked less like a science project and more like a strategic weapons supplier for the modern digital economy. The company went public through the fashionable SPAC circus in 2021, which at the time was a little like entering a beauty pageant during a food fight. A SPAC, or Special Purpose Acquisition Company, is essentially a publicly traded shell company created to raise money from investors so it can merge with a private company and take that company public without using the traditional IPO process.
Since then, the stock has behaved exactly the way speculative semiconductor stocks behave. It has soared, crashed, terrified shareholders, and then rallied again whenever Wall Street remembered that power efficiency matters. Today Navitas remains small compared to giants like Texas Instruments, Infineon, or ON Semiconductor, but the reason traders care is simple: if gallium nitride and silicon carbide adoption accelerates, Navitas could become one of the tiny toll booths sitting on a very crowded AI and electrification highway.
The business itself is surprisingly straightforward once you strip away the semiconductor jargon. Navitas designs next-generation power chips that help electronic systems waste less energy. Every data center, electric vehicle, fast charger, solar inverter, industrial robot, and AI server farm faces the same problem: heat and power consumption. Traditional silicon chips are increasingly running into physical limits, which is why gallium nitride and silicon carbide have become the semiconductor industry’s version of performance-enhancing drugs. Navitas licenses and sells these advanced power semiconductors into fast-growing markets where efficiency matters more every year. Revenue comes primarily from mobile fast charging, electric vehicles, solar applications, consumer electronics, industrial power systems, and increasingly AI infrastructure. The moat here is technological expertise and first-mover positioning, although calling it a moat today might be generous. Right now it is more like a castle under construction with competitors actively trying to blow holes in the walls.
Industry trends are unquestionably favorable. Artificial intelligence is creating an enormous electricity problem. AI data centers consume staggering amounts of power, electric vehicles need faster charging systems, and utilities are scrambling to modernize infrastructure that still behaves like it was designed during the Eisenhower administration. Navitas sits in the middle of all of this because efficient power conversion is becoming critical. The bull case is easy to understand. If gallium nitride and silicon carbide continue replacing traditional silicon across multiple industries, Navitas could ride a multi-year adoption wave similar to what Nvidia experienced in AI accelerators, albeit on a much smaller scale. The bear case is equally obvious. Semiconductor history is littered with brilliant technologies that never generated meaningful profits because competition crushed margins before adoption reached escape velocity. Traders need to remember this company is still small, still unprofitable, and still dependent on scaling successfully before larger rivals dominate the market.
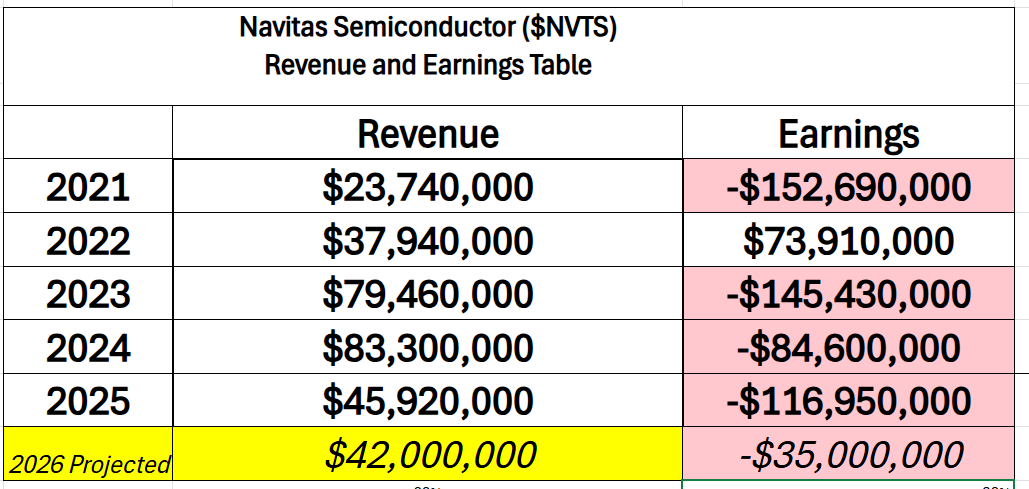
Financially, Navitas remains a story stock more than a mature business. Revenue growth over the past five years has been volatile but generally upward as adoption expanded across power management applications. Gross margins remain respectable for a semiconductor growth company, but profitability is still elusive because management continues investing aggressively in research, product development, and customer acquisition. Free cash flow has been inconsistent, and net income remains negative. Five of the last six years the company has lost money.
This is not a sleepy dividend-paying industrial company that quietly compounds wealth while retirees play shuffleboard. This is a high-volatility growth stock attempting to establish itself inside one of the most competitive industries on Earth. Debt levels remain manageable relative to many early-stage semiconductor firms, which helps, but the balance sheet still depends heavily on maintaining investor confidence and access to capital markets.
What traders often misunderstand is that companies like Navitas are not valued on current earnings. They are valued on future positioning. Wall Street is not buying what the company earns today. It is buying the possibility that Navitas becomes strategically important tomorrow. That distinction matters because it explains why the stock can rally violently even while losses continue. If investors believe gallium nitride adoption is accelerating faster than expected, the stock rises long before accountants can prove the business model works at scale. Traders who wait for perfect fundamentals in emerging semiconductor technologies usually arrive just in time to buy the top from somebody who got there three years earlier.
Right now traders are asking three big questions. First, can Navitas actually achieve large-scale commercial adoption fast enough to justify its valuation? Second, will AI infrastructure spending materially increase demand for the company’s power solutions? Third, can management eventually generate sustainable profitability before competitors compress margins? Those are the real debates driving the stock. Nobody on Wall Street wakes up wondering whether Navitas will sell slightly more charging chips next quarter. Traders care about whether this becomes a category-defining semiconductor platform or simply another promising technology company swallowed by larger rivals.
The stock’s recent strength has been driven largely by the broader semiconductor and AI momentum trade. The semiconductor sector has become the market’s version of a gold rush saloon. Every company remotely connected to AI, electrification, or advanced computing suddenly attracts speculative capital like free beer attracts college students. The powerful rally in SOXL has absolutely helped Navitas because institutions increasingly lump power semiconductors into the broader AI infrastructure narrative. AI servers consume enormous power. Efficient energy conversion matters. That thematic linkage has brought buyers into names throughout the semiconductor supply chain, including Navitas.
But here is where traders should stay skeptical. Much of the narrative is already priced into the stock. Wall Street understands the AI electricity story. Analysts understand gallium nitride adoption trends. What the market may still be underestimating is execution risk. Semiconductor manufacturing is brutally competitive, customers move slowly, and scaling production profitably is far harder than making exciting investor presentations with colorful charts and futuristic buzzwords. History shows that emerging semiconductor winners usually endure brutal volatility long before becoming dominant franchises.
The opportunity here is substantial if Navitas successfully establishes itself as a meaningful supplier inside electric vehicles, AI infrastructure, and industrial power management. The biggest upside surprise would likely come from hyperscaler adoption or major AI infrastructure partnerships that dramatically accelerate revenue growth. But traders should also respect the blind spot. Stocks like this can decline 40%, 50%, or even 70% without warning if growth disappoints or financing conditions tighten. Small semiconductor companies live and die on future expectations, and expectations are emotional creatures.
The next major catalysts are earnings reports, customer design win announcements, and updates tied to AI infrastructure demand. Traders should pay close attention to revenue guidance, gross margin trends, and management commentary regarding hyperscaler adoption. Those numbers matter because this market currently rewards semiconductor companies that demonstrate accelerating demand tied to AI electrification themes. It punishes everybody else.
Ultimately, Navitas is best suited for aggressive growth traders who understand volatility is not a side effect here. It is the entire business model. For the trend to continue, revenue growth must accelerate, AI-related adoption must remain credible, and the semiconductor sector itself must stay healthy. Early warning signs would include slowing customer wins, deteriorating margins, weakening semiconductor momentum, or broader breakdowns across AI infrastructure stocks. Right now the market is still treating Navitas like a speculative call option on the future of efficient power delivery. That can create extraordinary upside. It can also create extraordinary pain for traders who forget that semiconductor revolutions tend to mint fortunes and destroy optimists at roughly the same pace.
In this analysis we will review and evaluate forecasts using the following set of indicators and tools.
Wall Street Analysts Ratings and Forecasts
52 Week High and Low Boundaries
Best-Case / Worst-Case Scenario Analysis
VantagePoint AI Predictive Blue Line
Neural Network Forecast (Machine Learning)
VantagePoint AI Daily Range Forecast
Intermarket Analysis
Our Suggestion
We use artificial intelligence to improve probabilities, not replace judgment. Because here’s what many traders miss: a powerful signal means very little if the underlying business is weak. That’s why we study the fundamentals too. Revenue growth. Earnings. Cash flow. Competitive position. The real economics behind the ticker symbol. When fundamentals and price action move in harmony, the probabilities often shift dramatically in the trader’s favor.
Wall Street Analysts Price Forecasts
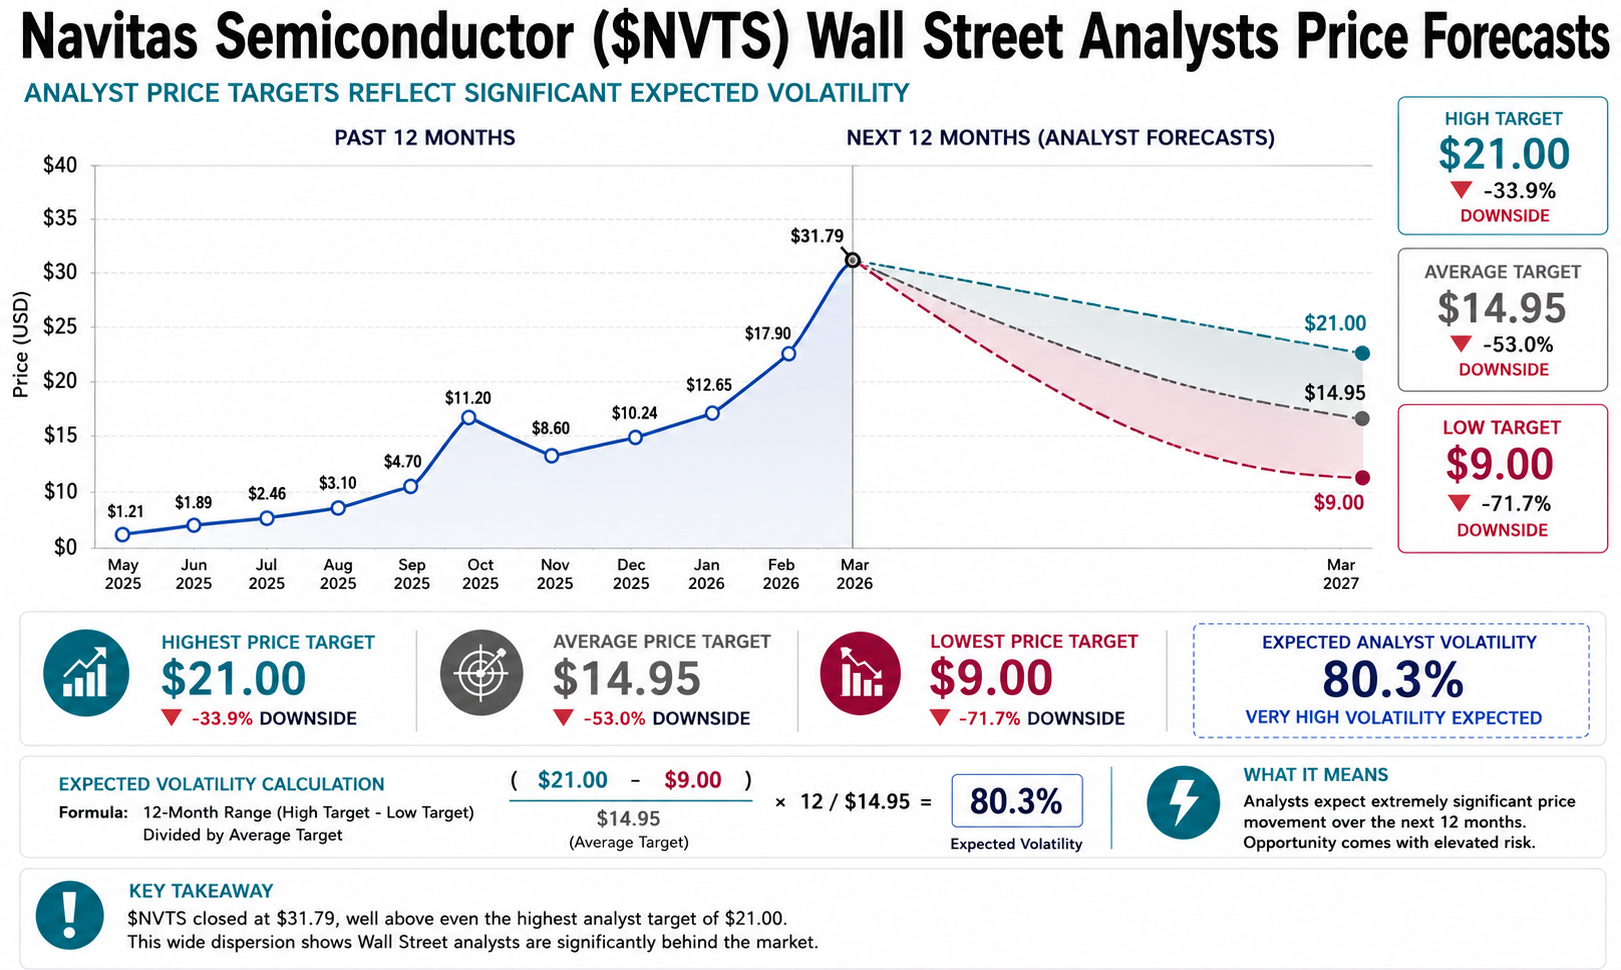
The thing about Wall Street analysts is that they all stare at the same numbers, attend the same conference calls, build the same spreadsheets, and somehow still end up looking like a group of tourists arguing over a road map in a foreign language. One analyst says $NVTS is worth $21. Another says $9. Meanwhile the stock is sitting up at $31.79 like a tipsy cowboy riding past the sheriff’s office at midnight. That spread tells you something very important: Wall Street is not confidently forecasting the future here. Wall Street is guessing while pretending to use mathematics.
The expected volatility comes in around 80.3%, which is an extraordinarily polite statistical way of saying nobody really knows what this thing is worth. These analysts watch the stock 24 hours a day, inhale semiconductor reports like oxygen, and still can’t agree whether the company is mildly overvalued or completely detached from earthly reality. More importantly, the market has already blasted through even the highest analyst target. That usually means one of two things. Either institutional money discovered something analysts underestimated, or traders collectively lost their minds and decided profits are optional in the AI age. Modern markets have a habit of making both possibilities look equally reasonable.
For traders, this is not a smooth Sunday-afternoon investment. This is a high-voltage momentum stock with enough disagreement underneath it to make violent price swings almost inevitable. Momentum traders probably love it because the stock clearly does not care what analysts think right now. Mean reversion traders are staring at it the way a homeowner watches a kitchen grease fire. Eventually, something forces Wall Street to move its targets higher, or the stock moves lower to reconnect with reality. Until then, $NVTS looks less like a consensus investment and more like a live experiment in speculative capitalism.
52-Week High and Low Boundaries
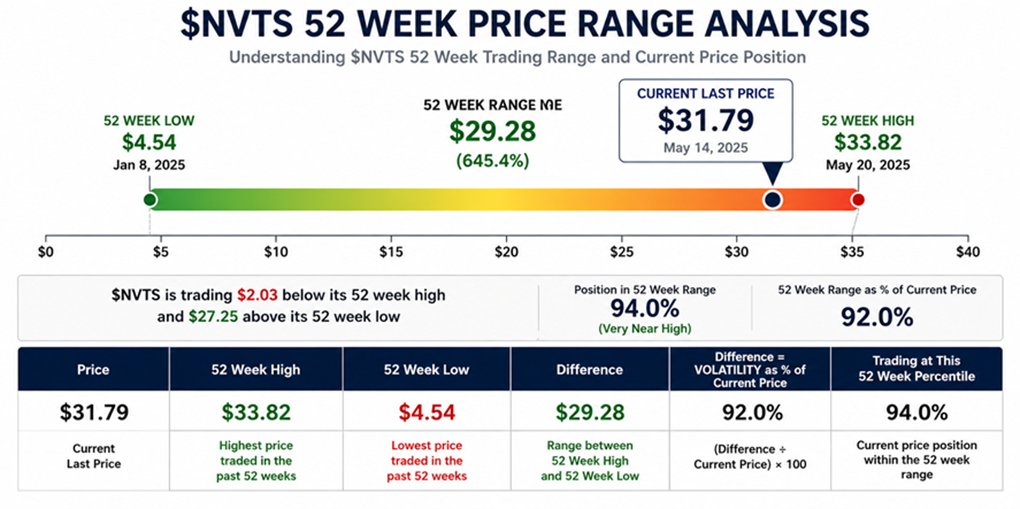
At $31.79, $NVTS is trading at roughly the 94th percentile of its entire 52-week range. In plain English, this stock is camped out just beneath its highs, not wandering around the middle of the field wondering where to go next. Over the past year, the stock traded as low as $4.54 and as high as $33.82, which tells you two things immediately. First, this is not a sleepy utility stock built for retirees clipping coupons. Second, the market has aggressively repriced the company higher over the last twelve months. Stocks that consistently live near their highs tend to behave like leaders because institutional money rarely keeps piling into weak merchandise. Smart traders understand something important here: the annual trading range is one of the simplest ways to understand what an asset is actually capable of doing. And in the case of $NVTS, the answer is simple. This stock moves. Violently.
The annual trading range between the high and low comes to $29.28. Divide that by the current stock price of $31.79, and you get a historical volatility proxy of roughly 92%. That means the stock covered an amount equal to nearly the entire current share price over the past year. That is extraordinary movement. It tells traders this stock does not drift quietly from point A to point B. It explodes, corrects, surges, and scares people half to death along the way. Right now the positioning reflects expansion, not compression. The stock has already made a massive move higher and continues holding near the upper edge of its range. That usually signals strong momentum, but it also means expectations are no longer modest.
For traders, this becomes a classic battle between momentum and exhaustion. Momentum traders will argue the stock is acting exactly the way powerful emerging technology leaders are supposed to act: strong price action, persistent buying pressure, and very little willingness to break down meaningfully. Mean reversion traders will look at the same chart and quietly wonder how much oxygen remains in the tank after a move from $4.54 to over $31 in a year. The breakout signal would be a decisive move through the $33.82 high with continued volume and institutional participation. The warning sign would be failure to hold the upper portion of the range, especially if the stock starts slipping back below recent support levels. Right now the reward still favors aggressive momentum traders, but the volatility profile makes one thing very clear: position sizing matters because this stock has already proven it can move enormous distances in both directions.
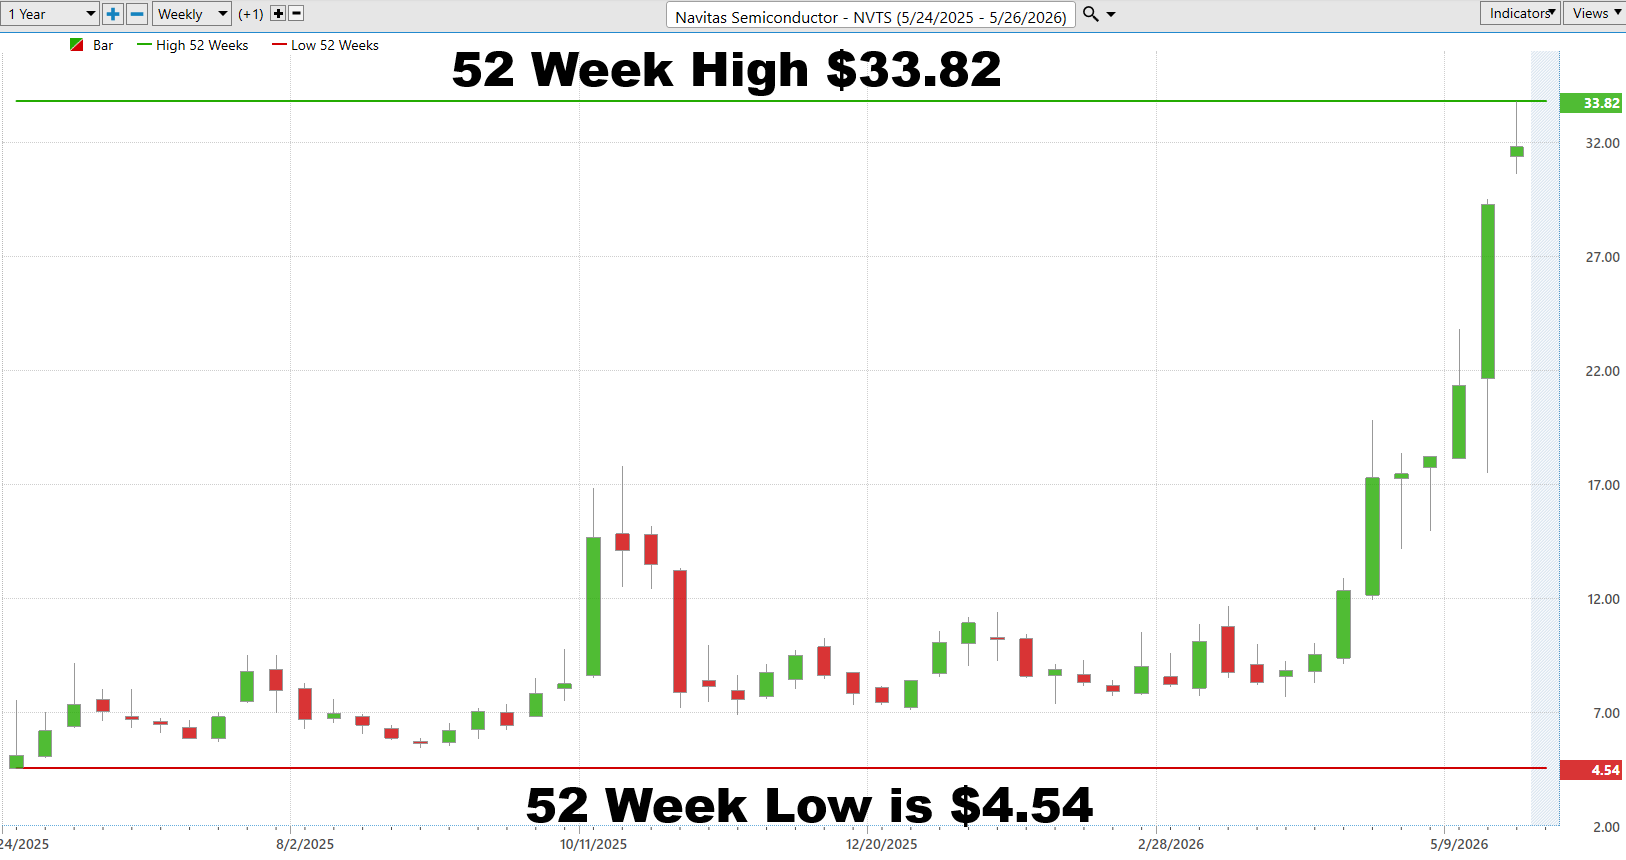
One of our favorite trading setups is stocks simultaneously making new 52-week highs and new 10-year highs because those moves often signal something much bigger than short-term momentum. They signal that a company is overcoming every prior barrier to its success including skepticism, competition, weak sentiment, and old resistance levels that stopped previous rallies dead in their tracks. $NVTS now checks all of those boxes. Looking at the long-term chart, the stock spent years trapped in a volatile sideways range before suddenly exploding higher and pushing into entirely new territory. That kind of breakout behavior matters because when a stock enters true price discovery mode with no historical overhead resistance, the moves can become extremely powerful as institutional money scrambles to reprice the company’s future potential in real time.
Best-Case/Worst-Case Scenario Analysis
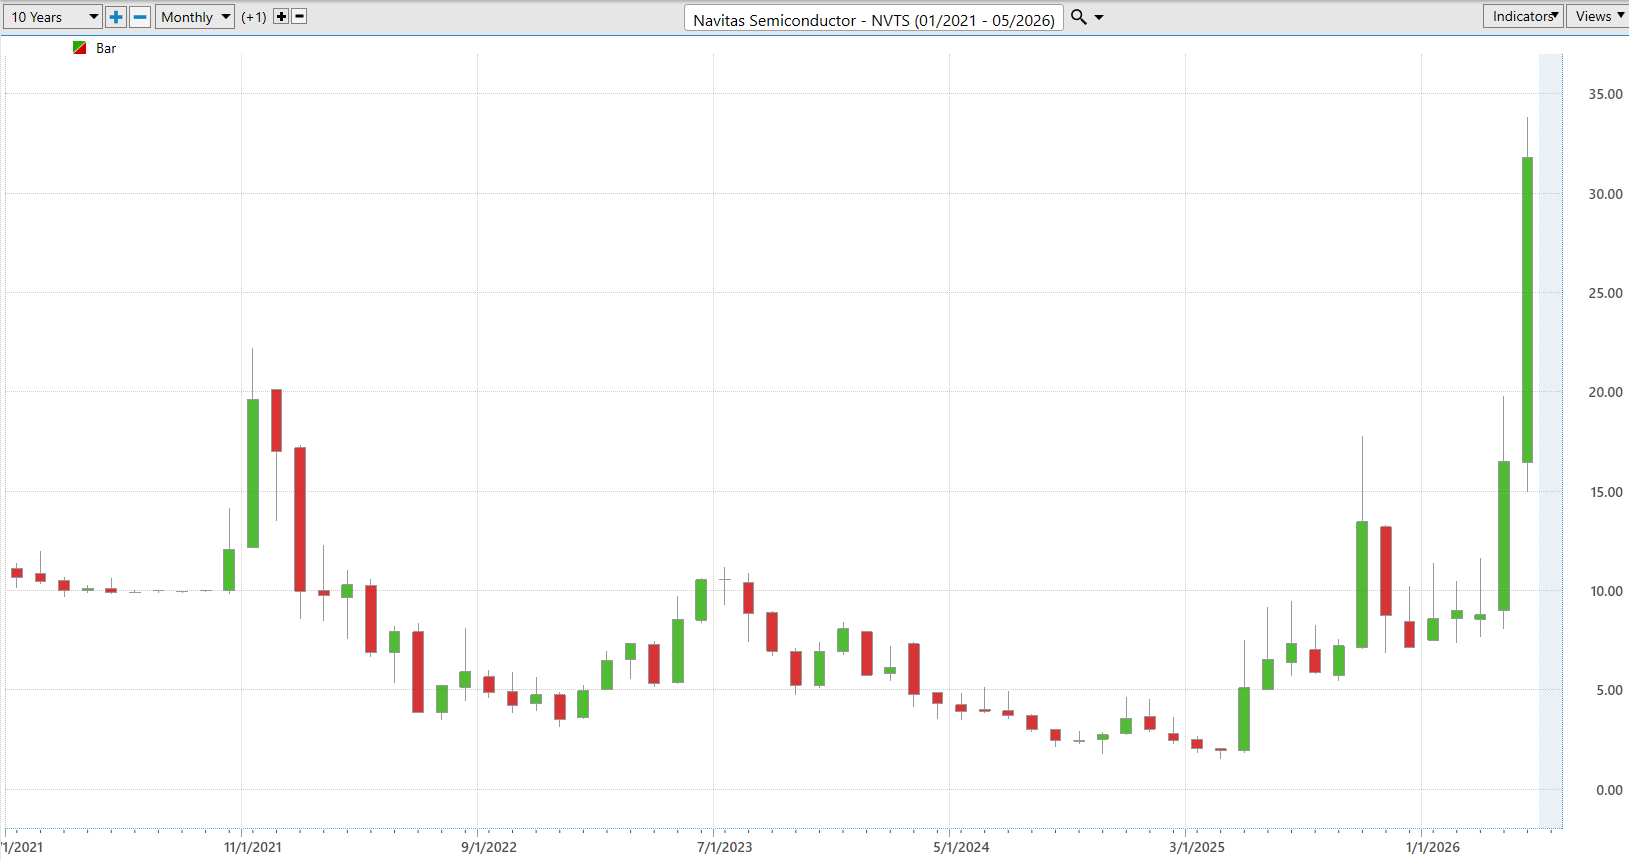
Volatility is not theoretical. Every trader eventually learns that the market does not care about opinions, predictions, or beautifully crafted spreadsheets. The simplest way to understand what a stock is capable of doing is to study its largest uninterrupted rallies and declines over the past 52 weeks. Start with the upside. Looking at the chart of $NVTS, the most explosive uninterrupted rally reached roughly +353%. That is not a typo. If a move even remotely close to that happened again from the current price near $31.79, the stock could theoretically travel into territory most traders would currently consider absurd. But that kind of move does not happen in a vacuum. It would likely require continued AI enthusiasm, expanding semiconductor demand, strong momentum, institutional accumulation, and a market environment willing to reward speculative growth stories aggressively. The important lesson is not the exact number. The lesson is that this stock has already demonstrated the ability to move violently higher in a relatively short period of time.
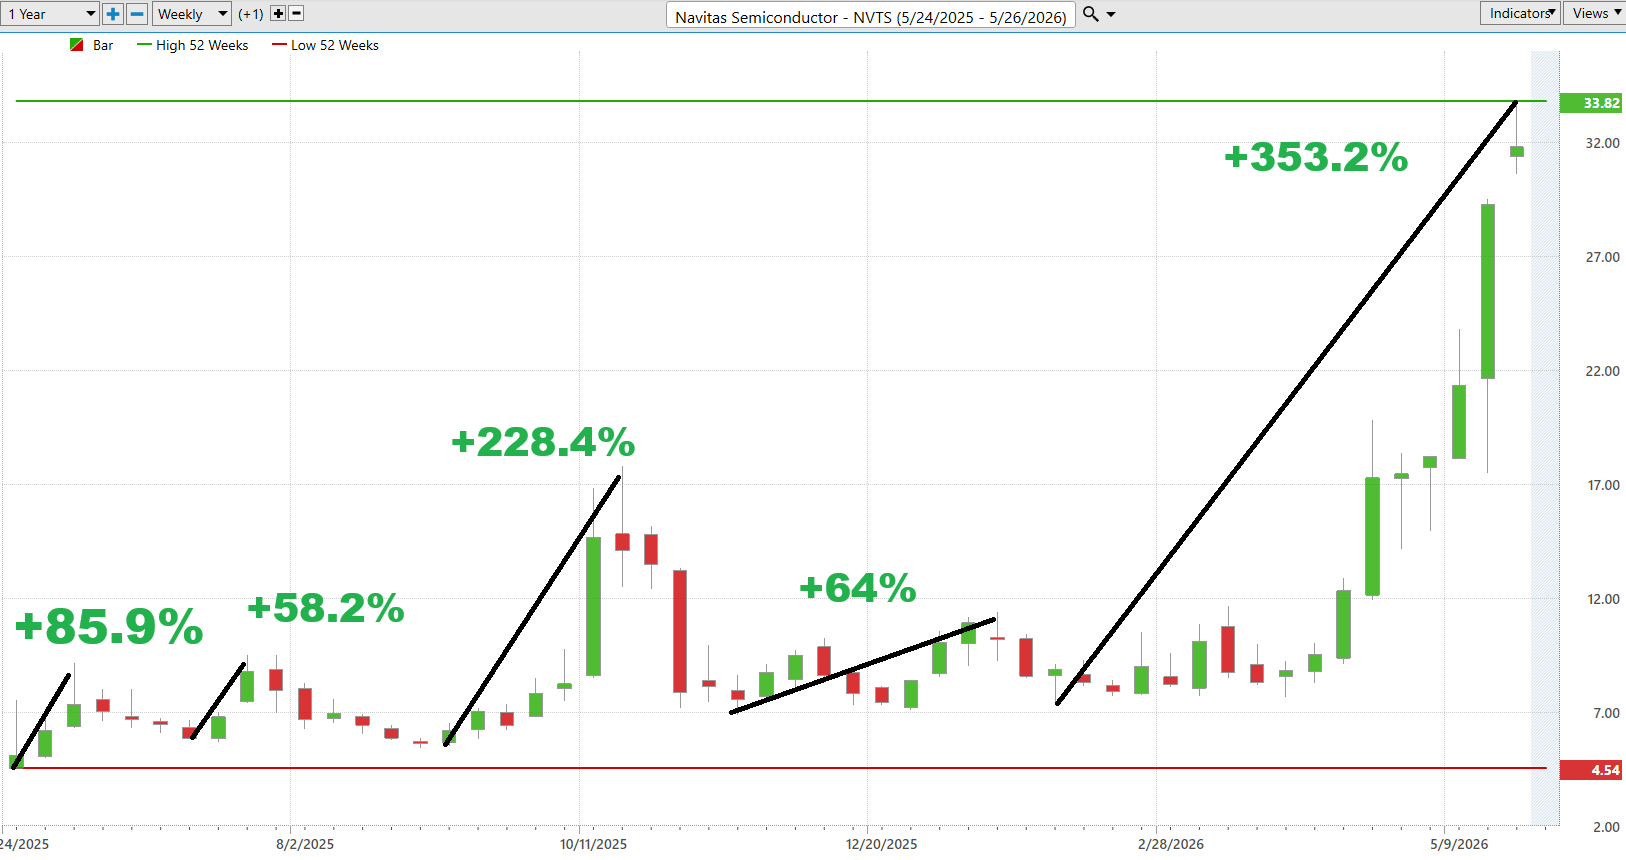
Now look at the downside. The largest uninterrupted decline on the chart approached roughly -60.8%. That means this same stock that can triple in spectacular fashion is also fully capable of cutting investors in half emotionally, financially, and psychologically. A decline of that magnitude from current levels would erase enormous amounts of capital very quickly. Traders love talking about upside because it feels exciting. Nobody enjoys visualizing what it feels like to wake up watching a position collapse week after week while every headline suddenly changes from optimism to panic. But markets do not suspend volatility simply because a company operates in artificial intelligence or semiconductors. In fact, those sectors often amplify it. The chart is effectively screaming a very simple message: this asset is capable of enormous movement in both directions, and there is no evidence that volatility is suddenly disappearing now.
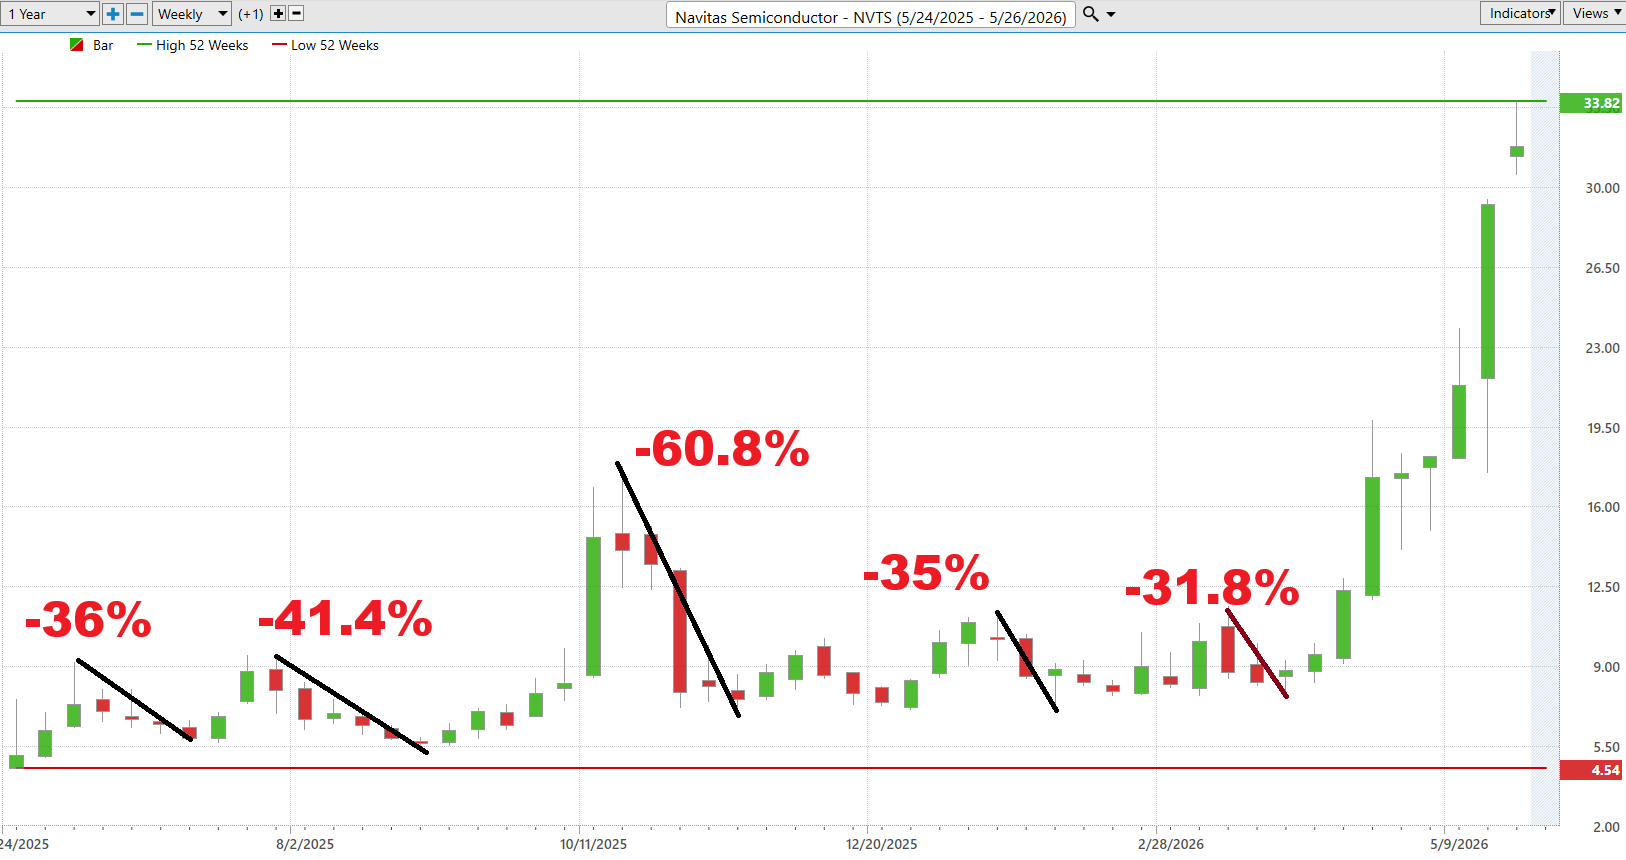
That is the trader’s reality. Both scenarios matter simultaneously. Most traders obsess over how much money they can make while spending almost no time thinking about whether they are positioned to survive the inevitable downside swings. Proper position sizing solves much of this problem because it allows traders to participate in potentially explosive opportunities without placing themselves in a position where one bad move becomes financially or emotionally catastrophic. This exercise is not about prediction. Nobody knows whether the next major move in $NVTS will be another breakout or a violent correction. This is about preparation. If you cannot emotionally and financially handle the worst-case scenario, then you have no business chasing the best-case outcome.
Next we compare $NVTS to the broader stock market averages.
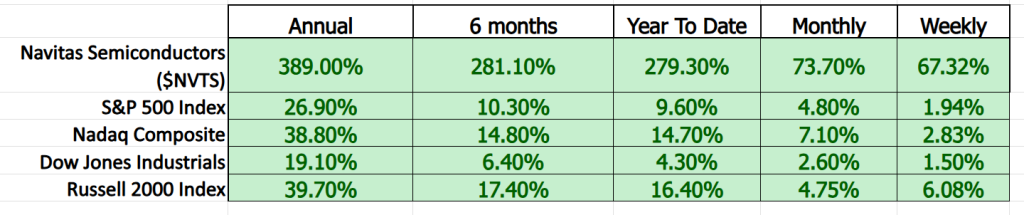
The comparison scoreboard table tells a story that is becoming increasingly common in modern markets: capital is no longer moving evenly across the investing landscape. It is stampeding into very specific themes with extraordinary force. In the case of $NVTS, the stock is not merely outperforming the broader market. It is completely overwhelming it across virtually every measurable timeframe. Over the last twelve months, $NVTS advanced roughly 389% versus just 26.9% for the S&P 500 Index. Even more striking, the stock dramatically outpaced the Nasdaq Composite, which itself has been relatively strong due to the artificial intelligence boom. That kind of outperformance rarely happens accidentally. It usually signals that institutional investors believe they are positioned early in front of a potentially transformative trend.
What makes the table particularly fascinating is the consistency of the relative strength. This is not a one-week meme-stock burst driven by social media excitement. The stock is outperforming over the annual, six-month, year-to-date, monthly, and weekly periods simultaneously. In other words, momentum is accelerating, not fading. The market is effectively treating $NVTS as a high-beta semiconductor and AI infrastructure play at a time when investors remain desperate to identify the next generation of technology winners. When a stock consistently outperforms every major index across multiple timeframes, professional traders pay attention because it suggests money managers are actively accumulating shares rather than simply reacting to short-term headlines.
Of course, this type of leadership cuts both ways. Stocks that massively outperform the market tend to attract momentum traders, aggressive hedge funds, and increasingly optimistic narratives, all of which can push valuations far beyond traditional fundamentals. But relative strength like this should never be dismissed casually. Markets are ultimately giant discounting mechanisms, and stocks displaying this level of persistent outperformance are often signaling that investors expect materially better growth, larger future opportunities, or strategic importance that consensus models still underestimate. Right now, $NVTS is behaving less like a typical semiconductor stock and more like a market-selected leader in one of the most aggressively pursued investment themes on Earth.
Vantagepoint AI Predictive Blue Line
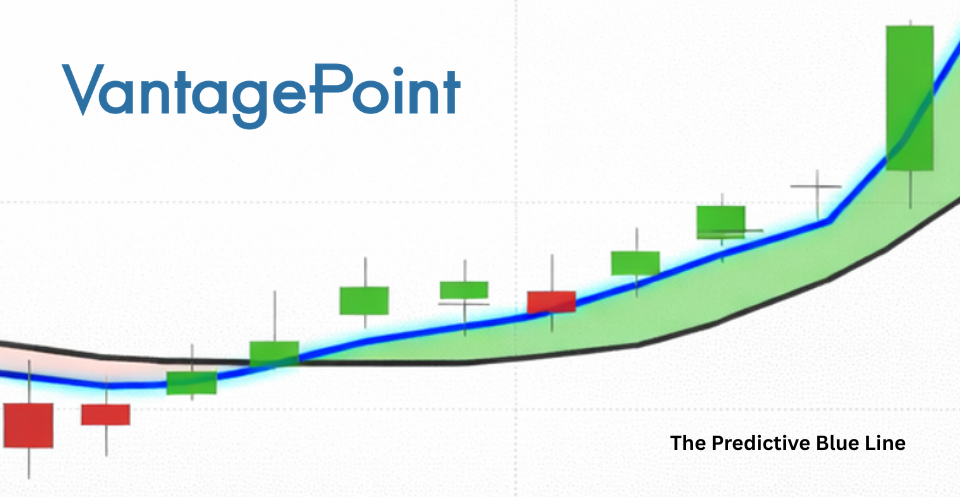
The attached chart is exactly the kind of setup trend traders spend their careers searching for. The blue Predictive Blue Line remains firmly above the black actual moving average, and more importantly, the slope of the Predictive Blue Line continues pointing aggressively higher. That matters because the slope tells you the direction of the underlying short-term trend before traditional indicators fully react. In the case of $NVTS, the trend is not drifting sideways or hesitating. It is accelerating upward.
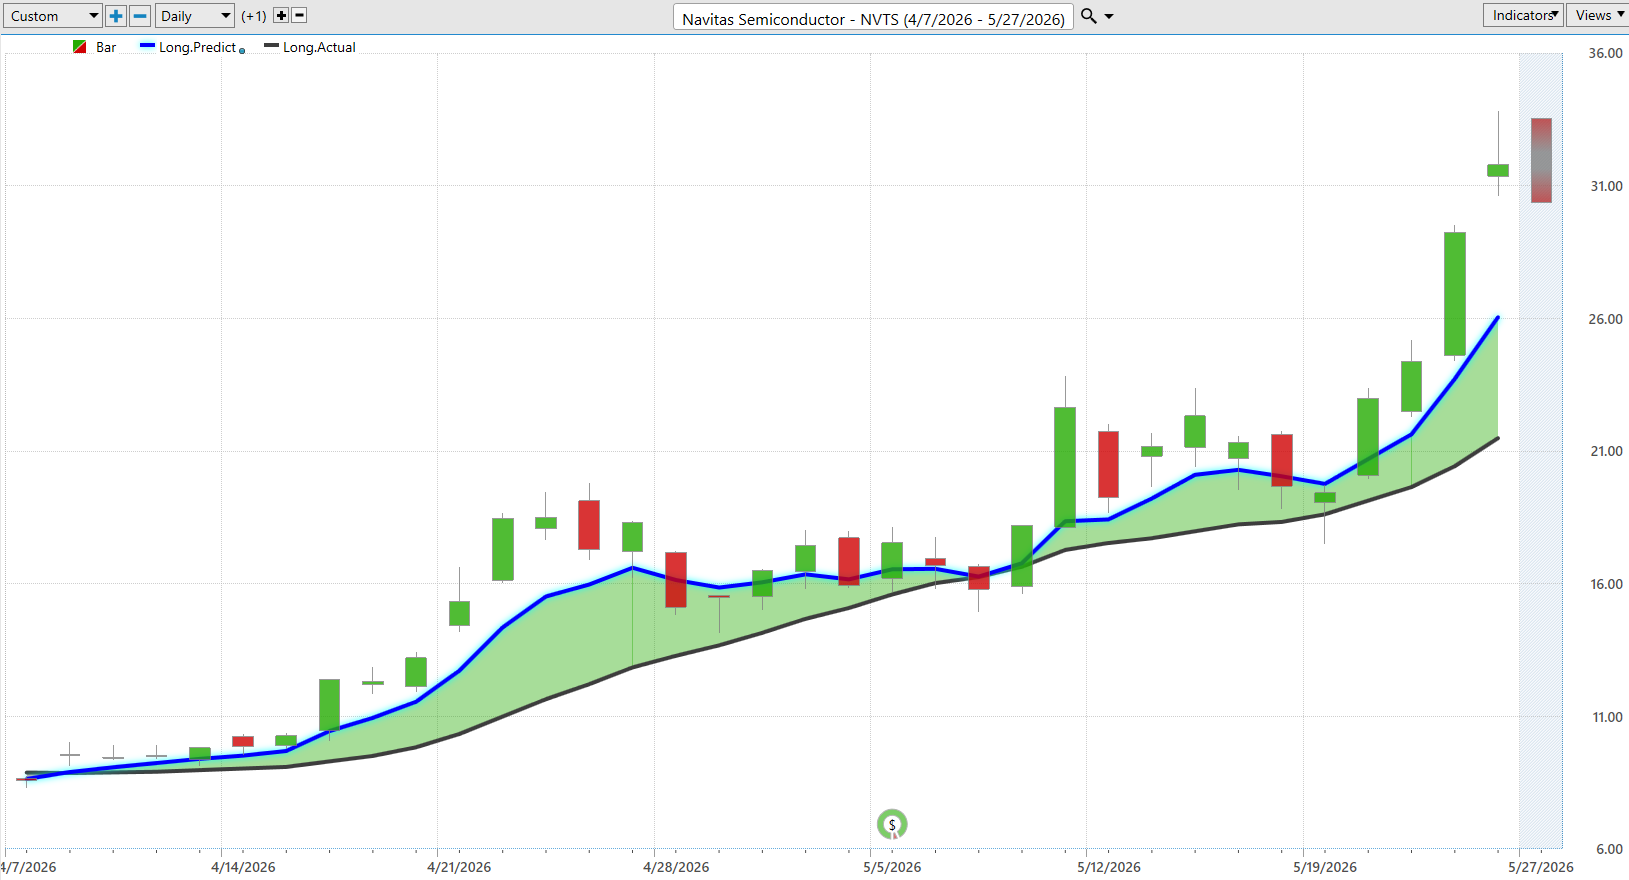
One of the most important lessons traders eventually learn is that strong trends rarely move in straight lines forever. They advance, pause, consolidate, and then continue higher if institutional money remains committed. That is precisely what this chart shows. Multiple times throughout April and May, price briefly pulled back toward the Predictive Blue Line before buyers stepped back in aggressively. Each pullback effectively became a launching pad for the next move higher. This is why traders focus so heavily on the relationship between price and the Predictive Blue Line. When price remains above a rising predictive line, the market is effectively telling you buyers still control the tape.
The most powerful part of the current setup is what happened during the final stretch of the chart. The Predictive Blue Line began rising sharply even before the most explosive upside candles appeared. That is exactly what traders want to see from artificial intelligence driven forecasting tools: early recognition that momentum and underlying strength are expanding beneath the surface. Meanwhile, the widening distance between the blue line and the black actual moving average confirms that momentum itself is strengthening, not weakening. As long as the Predictive Blue Line remains above the black line and continues sloping upward, the path of least resistance for $NVTS remains higher. The first warning sign would be a flattening slope in the blue line followed by a bearish crossover beneath the black line. Until that happens, the trend remains firmly in the bulls’ favor.
VantagePoint AI Neural Index (Machine Learning)
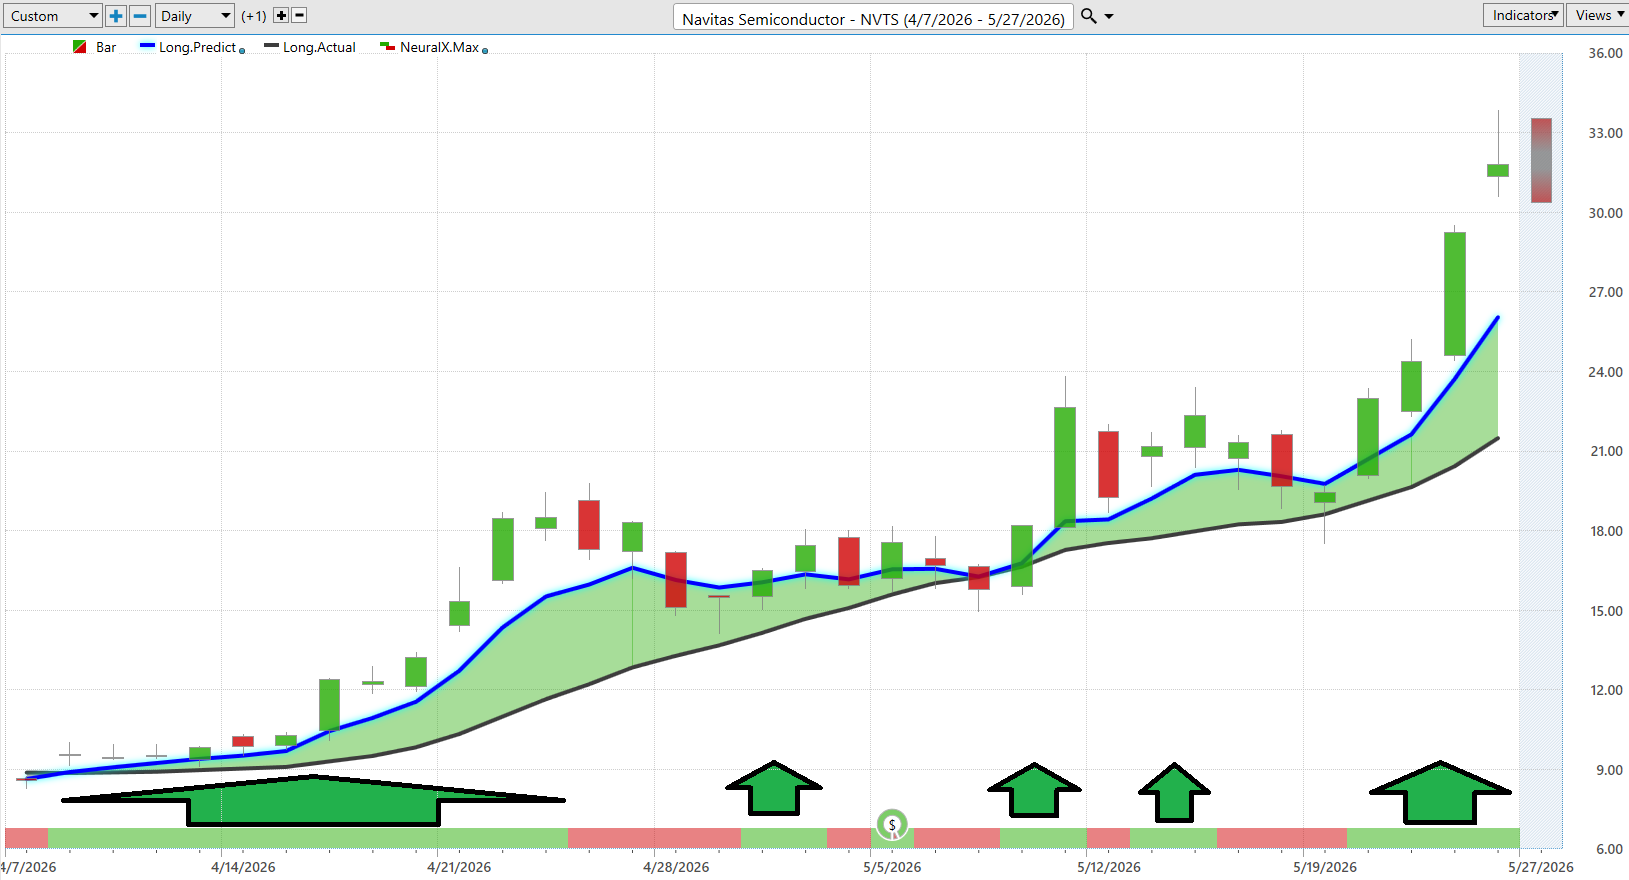
The Neural Index is designed to forecast short-term strength or weakness over the next 48 to 72 hours using artificial intelligence and neural network technology. Neural networks attempt to recognize patterns and relationships inside massive amounts of market data that human beings would struggle to process quickly. Similar technology is used in fraud detection, speech recognition, self-driving cars, and medical diagnostics because the goal is always the same: improve probabilities by recognizing patterns early. In the case of $NVTS, the current Neural Index is green and has remained overwhelmingly supportive throughout most of the recent rally. That matters because the Neural Index is not simply reacting to price after the fact. It is attempting to anticipate whether short-term momentum is likely to strengthen or weaken next. Right now, momentum appears to be building, not fading.
More importantly, the Neural Index is aligned with the broader trend rather than fighting against it. The Predictive Blue Line continues rising aggressively above the black actual moving average, and the Neural Index remains predominantly green underneath the chart. That combination is extremely important because the highest probability setups usually occur when short-term momentum and the larger trend point in the same direction simultaneously. Traders are not looking at random noise here. They are looking at confirmation. Even during brief pauses and pullbacks throughout May, the Neural Index quickly returned to green, signaling that buyers continued regaining control after short-term weakness.
Observe how when the Neural Index turns RED price has a tendency to revert to or below the predictive blue line. This provides traders with multiple opportunities for better entries.
This is how traders should think about the signal. The Neural Index is primarily a timing tool. It helps traders determine whether momentum is accelerating or weakening beneath the surface. It is not designed to replace trend analysis, position sizing, or common sense. In the current setup, the repeated green signals suggest traders can remain more aggressive on the long side as long as the broader trend remains intact. The first meaningful warning sign would likely appear if the Neural Index began turning persistently red while the Predictive Blue Line flattened or rolled over. Until then, the current message is fairly straightforward: this remains a green-light environment where short-term momentum continues supporting the larger bullish trend in $NVTS.
VantagePoint AI Daily Range Forecast
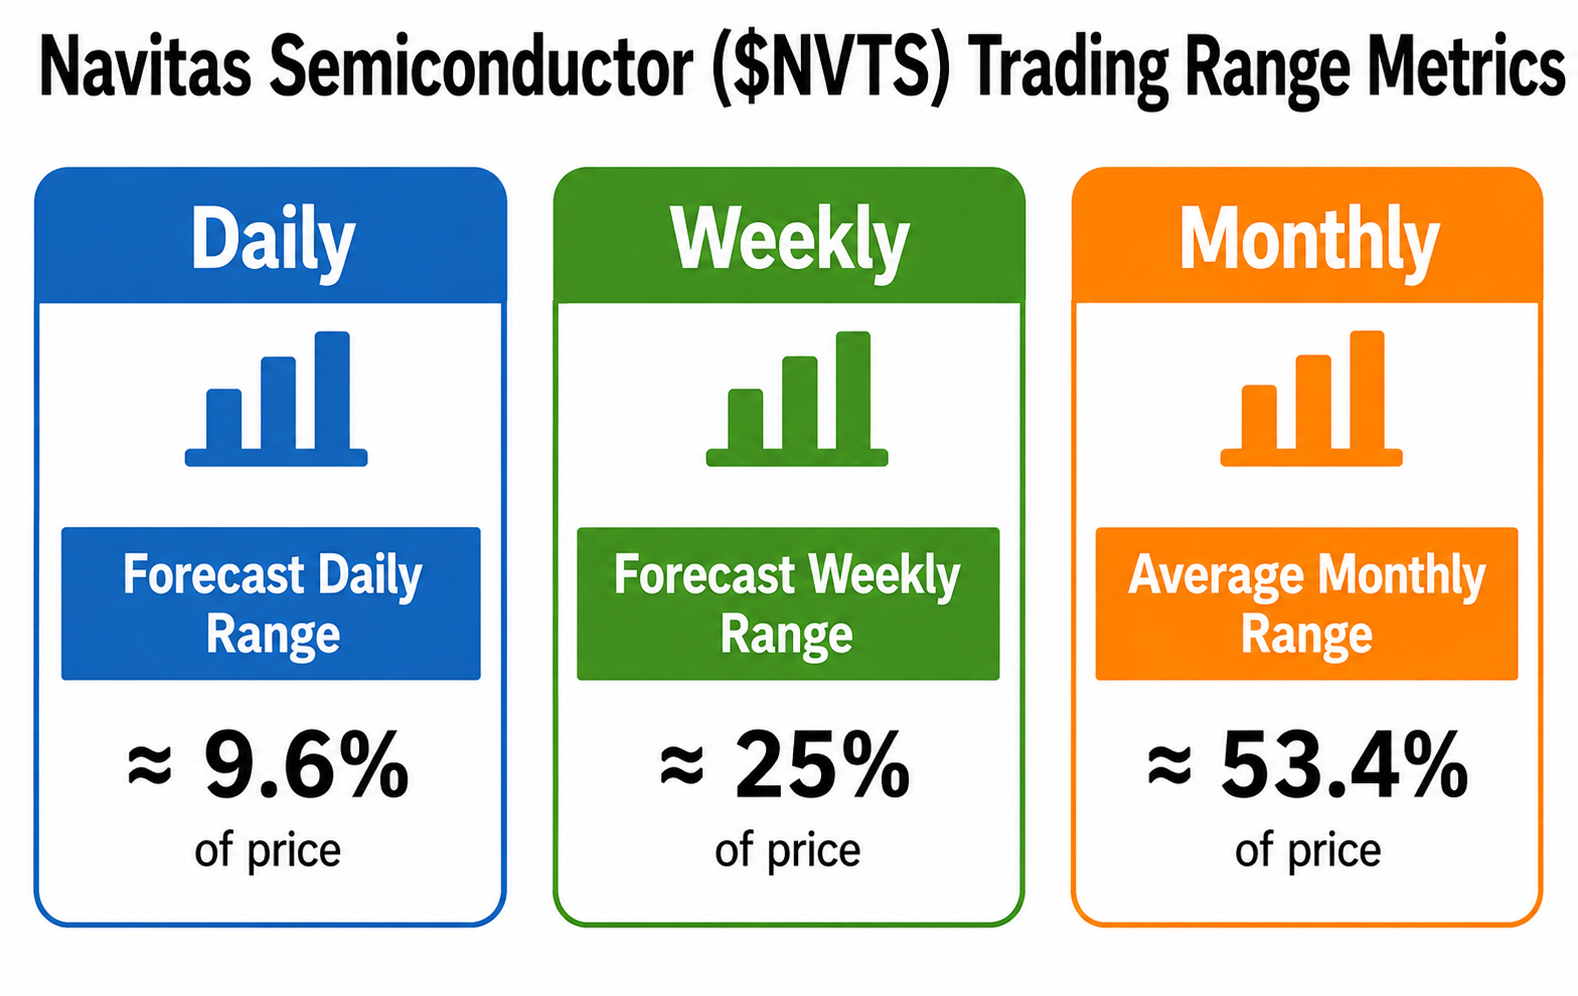
The Trading Range Metrics for $NVTS immediately tell traders they are dealing with an unusually volatile stock. A projected daily trading range near 9.6%, weekly range around 25%, and monthly range above 53% is not normal behavior for an ordinary semiconductor company quietly grinding higher on incremental earnings growth. These numbers suggest a market undergoing aggressive repricing. In practical terms, the stock is capable of moving nearly 10% in a single day, one-quarter of its value in a week, and more than half its value over the course of a month. Volatility at this level changes trader behavior entirely because position sizing, timing, and risk management suddenly become just as important as directional bias.
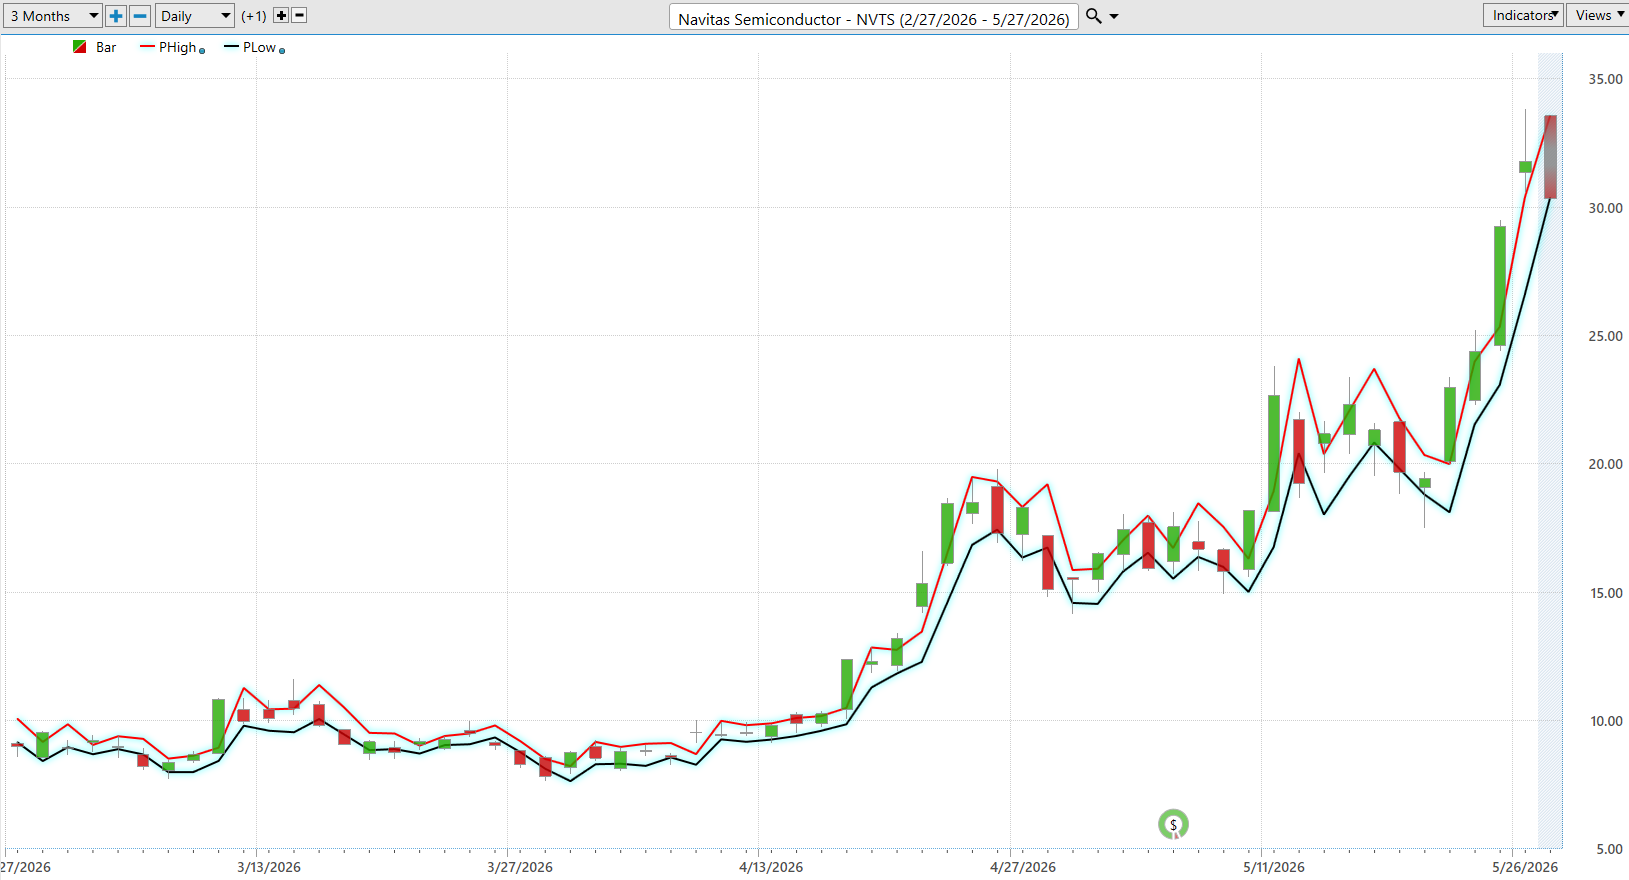
That is precisely why the Daily Range Forecast becomes so important. Historical averages tell traders what the stock did in the past. The Daily Range Forecast attempts to estimate where opportunity and risk are likely to exist next. Looking at the attached chart, the projected daily high and low bands continue expanding higher alongside price itself. That is an important distinction because rising forecast ranges often signal expanding momentum rather than exhaustion. The market is effectively pricing in larger and larger directional movement while buyers continue pushing the stock upward.
The broader message underneath both graphics is straightforward. $NVTS remains in an active price discovery phase where volatility is not fading but accelerating. The widening forecast bands, expanding trading ranges, rising Predictive Blue Line, and persistent momentum all point toward a market environment where traders should expect larger swings, not smaller ones. That does not guarantee the stock only moves higher. It does mean traders must respect the reality that this is now a high-velocity momentum asset capable of moving enormous distances in very short periods of time. In environments like this, the traders who survive are usually not the ones making the boldest predictions. They are the ones who understand where the risk lives before the next move begins.
VantagePoint AI Intermarket Analysis
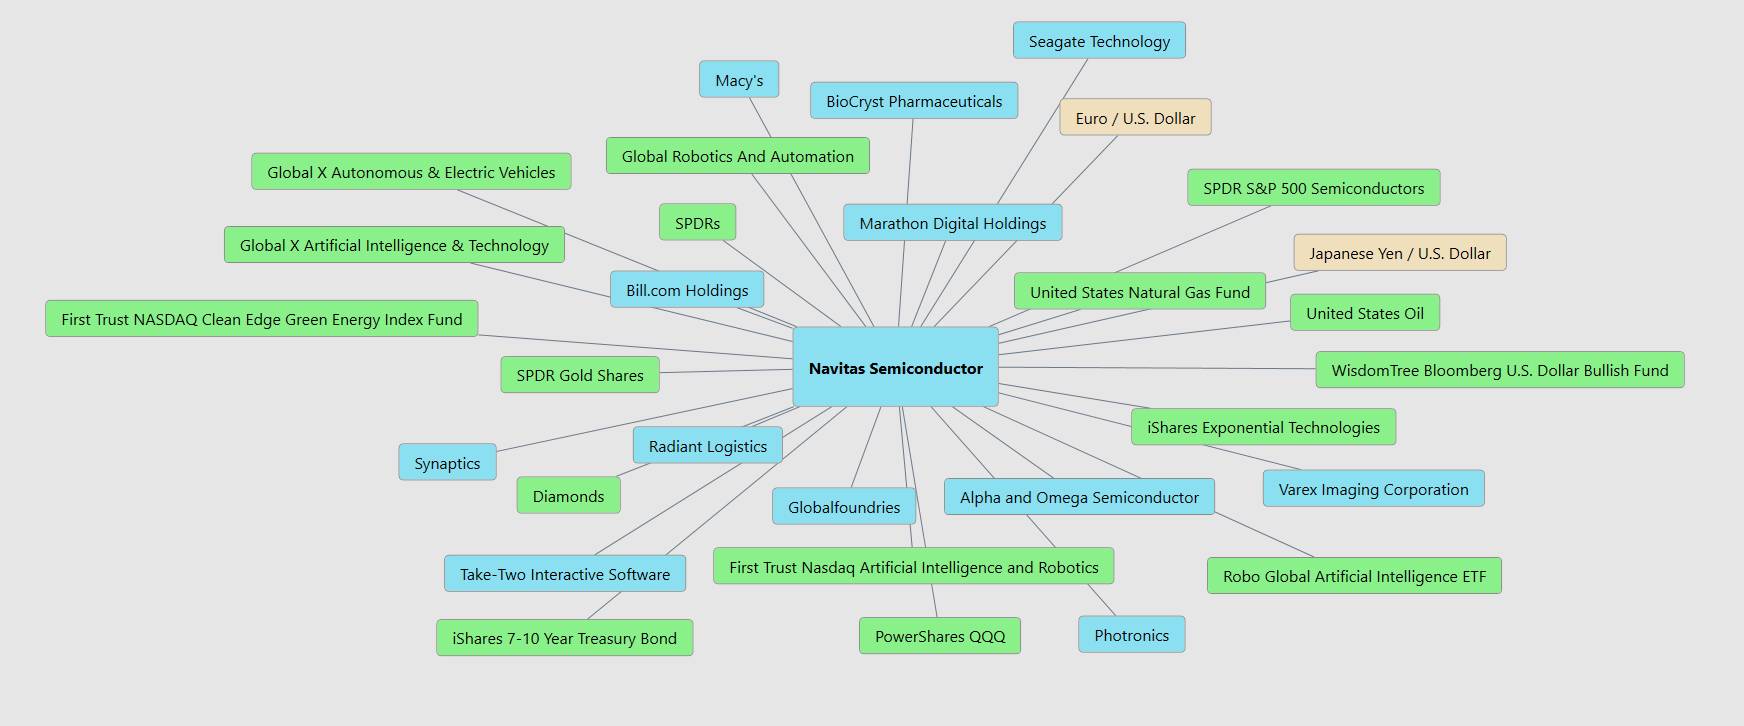
The intermarket picture surrounding $NVTS is about as “risk-on” as it gets. Look at the relationships connected to the stock. Semiconductors. Artificial intelligence ETFs. Robotics. Automation. Electric vehicles. The QQQ. Emerging technology funds. This is not money hiding in defensive sectors like utilities or canned soup companies. This is aggressive capital chasing growth, speed, computing power, automation, and the next generation of infrastructure. When multiple technology-related markets begin moving together at the same time, that usually tells traders institutional money is not making isolated bets. It is making a thematic bet.
The semiconductor connection may be the most important signal on the entire chart. The presence of semiconductor ETFs, AI funds, robotics indexes, and companies tied to advanced computing tells you the market increasingly views $NVTS as part of the broader artificial intelligence and electrification buildout. That matters because powerful trends often become self-reinforcing. As money floods into AI, semiconductors, automation, and next-generation power systems, smaller companies connected to those themes can suddenly experience explosive repricing. The market is effectively saying: “We need more chips, more power efficiency, more infrastructure, and more computing capacity.” $NVTS sits directly inside that ecosystem.
What makes the setup especially interesting is that you also see relationships tied to currencies, energy, Treasuries, and commodities. That tells you this is no longer just a simple semiconductor trade. Falling rate expectations, global capital flows, energy demand, manufacturing expansion, and AI infrastructure spending are all colliding together underneath the surface. In plain English, multiple parts of the financial system are currently confirming the same broad message: money continues rotating aggressively toward technology, AI infrastructure, and semiconductor-related assets. As long as those intermarket relationships remain supportive, the trend in $NVTS likely remains far more durable than most traders realize.
Our Suggestion
Our suggestion on $NVTS is straightforward: this is a powerful momentum stock tied directly to some of the most important investment themes in the market today including artificial intelligence, power infrastructure, semiconductors, and electrification. Management continues guiding for sequential growth, margins are gradually improving, and the market is clearly rewarding the company’s exposure to next-generation power technologies. At the same time, traders should understand that the stock price has moved far faster than the underlying fundamentals. Wall Street analysts remain dramatically behind the move, and the company is still expected to lose money while scaling the business.
Technically, however, the stock is behaving exactly the way institutional leaders behave during strong momentum phases. $NVTS is making new 52-week and 10-year highs simultaneously while outperforming the major indexes across every major timeframe. The Predictive Blue Line remains strongly bullish, the Neural Index continues signaling near-term strength, and the Daily Range Forecast shows expanding volatility alongside expanding momentum. Those conditions often attract additional institutional buying because strong trends tend to reinforce themselves.
That said, traders must respect the volatility. This is not a slow-moving blue-chip stock where daily fluctuations barely matter. The trading range metrics suggest the stock is capable of moving nearly 10% in a single day, 25% in a week, and over 50% in a month. That creates enormous opportunity, but it also creates enormous risk for traders using oversized positions or poor discipline. The biggest mistake traders make with high-momentum stocks is assuming volatility disappears simply because the trend has been strong recently.
Our suggestion is to treat $NVTS as a potential momentum opportunity while remaining disciplined about risk management and position sizing. As long as the Predictive Blue Line continues rising and the Neural Index remains supportive, the path of least resistance appears higher. But traders should focus less on predicting exact prices and more on staying aligned with the trend while controlling downside exposure. The opportunity here is real. The volatility is real too.
Use the VantagePoint AI Daily Range Forecast to isolate short term trading opportunities. Practice great money management on all of your trades.
It’s not magic.
It’s machine learning.
Disclaimer: THERE IS A HIGH DEGREE OF RISK INVOLVED IN TRADING. IT IS NOT PRUDENT OR ADVISABLE TO MAKE TRADING DECISIONS THAT ARE BEYOND YOUR FINANCIAL MEANS OR INVOLVE TRADING CAPITAL THAT YOU ARE NOT WILLING AND CAPABLE OF LOSING.
VANTAGEPOINT’S MARKETING CAMPAIGNS, OF ANY KIND, DO NOT CONSTITUTE TRADING ADVICE OR AN ENDORSEMENT OR RECOMMENDATION BY VANTAGEPOINT AI OR ANY ASSOCIATED AFFILIATES OF ANY TRADING METHODS, PROGRAMS, SYSTEMS OR ROUTINES. VANTAGEPOINT’S PERSONNEL ARE NOT LICENSED BROKERS OR ADVISORS AND DO NOT OFFER TRADING ADVICE.