


This week’s AI stock spotlight is Palo Alto Networks ($PANW)
Palo Alto Networks was founded in 2005 by cybersecurity pioneer Nir Zuk with one deceptively simple idea: stop cyberattacks before they happen instead of cleaning up the mess afterward. The company quickly disrupted the old firewall business by building software that could recognize modern threats instead of merely blocking traffic. Over the years it expanded through both innovation and acquisitions, transforming itself into a broad cybersecurity platform covering cloud computing, artificial intelligence, endpoint protection, and threat intelligence. Today it generates more than $9 billion in annual revenue, employs roughly 16,000 people, serves more than 70,000 organizations around the world, and remains one of Wall Street’s favorite ways to invest in the ever-growing business of digital self-defense.
If you ever wonder whether cybersecurity is just another passing technology fad, consider one inconvenient fact. Criminals have embraced innovation with even greater enthusiasm than most corporations. Every advance in artificial intelligence gives businesses new tools to improve productivity, but it also gives hackers faster and cheaper ways to launch attacks. Palo Alto Networks has quietly positioned itself as the insurance policy executives grumble about paying until the day they discover someone has stolen millions of customer records.
The first mistake many traders make is believing Palo Alto Networks sells software. It certainly does sell software, but what customers are really buying is peace of mind. Its clients include Fortune 500 companies, banks, healthcare systems, energy producers, governments, military agencies, universities, and just about anyone whose board of directors would rather avoid appearing on the evening news because of a ransomware attack. Fear may not appear on an income statement, but it has become one of the company’s most reliable revenue streams.
The business originally built its reputation selling next-generation firewalls, but that story is now only the opening chapter. Today the fastest-growing parts of the company revolve around recurring subscriptions for cloud security, endpoint protection, artificial intelligence, threat detection, identity security, and managed security services. Subscription revenue has steadily become the economic engine because customers who integrate multiple security products into one platform rarely wake up one morning eager to rip everything out and start over. Switching cybersecurity vendors has about the same appeal as attempting heart surgery with a YouTube tutorial.
Headquartered in Santa Clara, California, Palo Alto Networks is led by Chief Executive Officer Nikesh Arora, whose previous leadership roles at Google and SoftBank helped shape his aggressive expansion strategy. Under his direction the company has broadened well beyond firewalls and now competes with CrowdStrike, Fortinet, Cisco, Check Point Software Technologies, and Zscaler across multiple security markets. Its greatest competitive advantage is not necessarily having the single best product in every category. Instead, it offers customers one integrated ecosystem that becomes increasingly valuable as more products are added.
Wall Street has always loved companies that build ecosystems because ecosystems have a habit of trapping customers in the nicest possible way. Every additional security product a customer adopts makes leaving slightly more complicated and slightly more expensive. That creates recurring revenue, predictable cash flow, and remarkably loyal enterprise customers. Investors often describe this as a competitive moat, but it functions much like a hotel with only one exit and an excellent room service menu.
Financially, Palo Alto Networks has delivered the kind of consistency traders dream about. Revenue has climbed steadily from roughly $4.3 billion in fiscal 2021 to more than $9.2 billion in fiscal 2025, with trailing twelve-month revenue now exceeding $10 billion. The company has also transitioned from reporting accounting losses several years ago to generating meaningful cumulative net profits, although those earnings occasionally fluctuate because of tax items, acquisition accounting, and stock-based compensation. The direction of travel has been unmistakably upward even when individual quarterly numbers occasionally appear noisy.
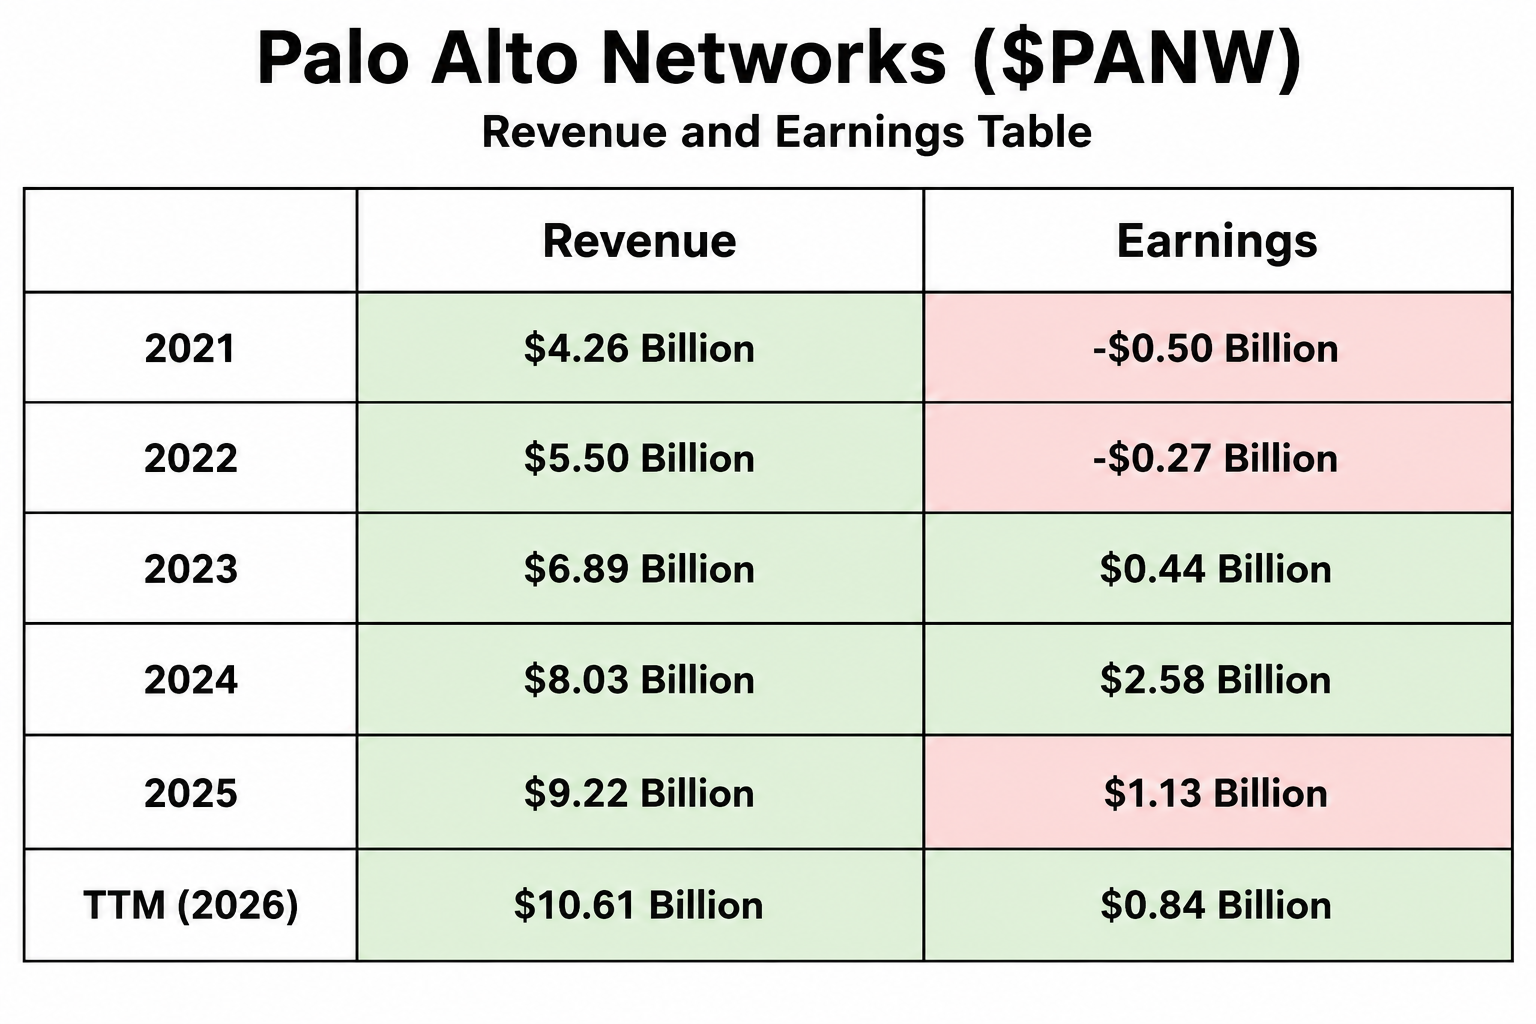
The six-year financial picture tells a compelling story. Fiscal 2021 produced approximately $4.26 billion in revenue and a cumulative net loss of roughly $499 million. Fiscal 2022 generated about $5.50 billion in revenue while the cumulative net loss narrowed to approximately $267 million. Fiscal 2023 marked an important turning point with revenue climbing to roughly $6.89 billion and cumulative earnings swinging to approximately $440 million.
Momentum accelerated further during fiscal 2024 as revenue reached roughly $8.03 billion while cumulative net earnings expanded to approximately $2.58 billion. Fiscal 2025 delivered revenue of approximately $9.22 billion and cumulative earnings of roughly $1.13 billion. Over the trailing twelve months revenue has grown to approximately $10.61 billion while cumulative net earnings remain solidly profitable at roughly $843 million. The accounting numbers fluctuate more than the underlying business, but the long-term trend remains one of expanding revenue, healthy cash generation, and growing profitability.
One aspect of Palo Alto Networks that traders frequently misunderstand is its balance sheet. They become distracted by accounting earnings while overlooking the company’s recurring subscription revenue, free cash flow, and remaining performance obligations. Those measurements often provide a much clearer picture of future business activity than a single quarterly earnings headline. This is also not a capital-intensive business that requires billions of dollars to build factories or purchase heavy equipment, allowing much of its cash flow to be reinvested into growth initiatives.
Right now traders seem to be asking three questions more than any others. The first is whether artificial intelligence will continue driving cybersecurity demand higher over the next several years. That appears likely because AI is helping defenders identify threats more quickly while simultaneously giving hackers more sophisticated tools to launch attacks. Every technological breakthrough creates opportunities for both sides, which usually means cybersecurity spending continues growing regardless of the economic backdrop.
The second question centers on whether Palo Alto Networks can continue persuading customers to consolidate multiple security vendors onto one platform. That may prove to be the company’s single biggest long-term growth engine because every successful consolidation deal increases customer dependence while lowering the likelihood of switching providers. The third question is whether the stock has simply become too expensive. Great companies frequently appear expensive for years, but eventually earnings growth must justify the premium investors are willing to pay.
The biggest developments over the past month have centered on continued enterprise demand for AI-enabled cybersecurity solutions, expanding platform adoption, and confidence that cybersecurity budgets remain surprisingly resilient despite broader economic uncertainty. Investors continue treating cybersecurity as mission-critical rather than discretionary spending, placing companies like Palo Alto Networks in a favored category. The genuinely new development is not that cybercrime continues to exist. The real change is that artificial intelligence is making attacks faster, cheaper, and more difficult to detect, increasing demand for automated defenses.
Much of today’s optimism has already been reflected in the stock price. Where Wall Street may still be underestimating the opportunity is the long-term economic value of platform consolidation, which creates exceptionally sticky customer relationships. Where expectations could prove overly optimistic is assuming cybersecurity budgets will remain completely immune from slower economic growth. Even essential spending occasionally faces temporary delays when corporate technology budgets tighten.
The stock has rallied because investors increasingly view Palo Alto Networks as something much larger than a firewall company. It has successfully transformed itself into a broad cybersecurity platform capable of protecting cloud infrastructure, networks, endpoints, applications, and digital identities within one integrated ecosystem. Over the past ninety days investors have rewarded accelerating subscription growth, expanding annual recurring revenue, and confidence that enterprise technology spending remains healthy. Those business fundamentals have mattered far more than the latest fashionable artificial intelligence headline.
Year-to-date, the same themes have continued supporting the stock. Institutional investors have favored highly profitable software companies with recurring revenue, strong cash flow, and durable competitive advantages. Cybersecurity has remained one of the strongest segments within enterprise software, helping Palo Alto Networks outperform many technology peers while also comparing favorably against broader cybersecurity benchmarks. The headlines may celebrate artificial intelligence, but recurring subscriptions and predictable cash flow continue paying the bills.
Consensus analysts generally agree that Palo Alto Networks remains one of the highest-quality cybersecurity franchises available to investors. They are probably correct on that point because the company continues producing strong operational execution while expanding its platform strategy. Where analysts have historically struggled is assuming valuation no longer matters whenever a company performs well. Even outstanding businesses occasionally disappoint investors simply because expectations have risen faster than reality.
The opportunity ahead remains relatively easy to understand. Artificial intelligence expands the number of potential cyber threats, cloud computing creates additional digital attack surfaces, and global digital transformation places even more valuable information online. Every technological advance creates another reason for businesses to strengthen their defenses. If Palo Alto Networks continues winning platform consolidation deals, subscription growth could accelerate beyond current expectations.
The risks deserve equal attention because great companies rarely stumble where investors expect them to. The largest threat is not competition or technology but unrealistic expectations embedded in the share price. A company can execute nearly flawlessly while still disappointing investors if guidance falls even modestly below optimistic forecasts. Traders should respect that distinction because high-quality companies often experience their sharpest declines immediately after delivering results that were merely excellent instead of extraordinary.
The next several months contain three important catalysts that traders should monitor closely. Fiscal fourth-quarter earnings are expected during August, when investors will closely examine revenue growth, annual recurring revenue, remaining performance obligations, and management guidance. Beyond the earnings report, forward-looking commentary from executives will likely influence the stock more than historical financial results. Finally, any major announcements involving enterprise AI security or significant customer wins could quickly reshape investor expectations.
Palo Alto Networks is best suited for momentum traders, swing traders, and long-term investors who appreciate companies capable of producing consistent recurring revenue and durable competitive advantages. For the current trend to continue, subscription growth must remain healthy, enterprise technology spending must stay resilient, and management must continue demonstrating that its platform strategy is delivering measurable results. The earliest warning sign will probably not appear in headline earnings but in slowing recurring revenue growth, weaker customer expansion, or softer forward guidance. Civilization has always been an endless contest between people building better locks and people inventing better lock picks, and Palo Alto Networks has built an exceptionally profitable business collecting tolls at the entrance to that never-ending battle
The following are the indicators and forecasts that we will use in this stock study to better comprehend the price action of $PANW.
Wall Street Analysts Ratings and Forecasts
52 Week High and Low Boundaries
Best-Case / Worst-Case Scenario Analysis
VantagePoint AI Predictive Blue Line
Neural Network Forecast (Machine Learning)
VantagePoint AI Daily Range Forecast
Intermarket Analysis
Our Suggestion
At VantagePoint, we use patented artificial intelligence to improve probabilities, not replace judgment. A strong chart means very little if the business behind it is weak. That is why we analyze revenue, earnings, cash flow, and competitive strength alongside price action. When sound fundamentals and powerful momentum come together, the odds shift decisively in the disciplined trader’s favor.
Wall Street Analysts Price Forecasts
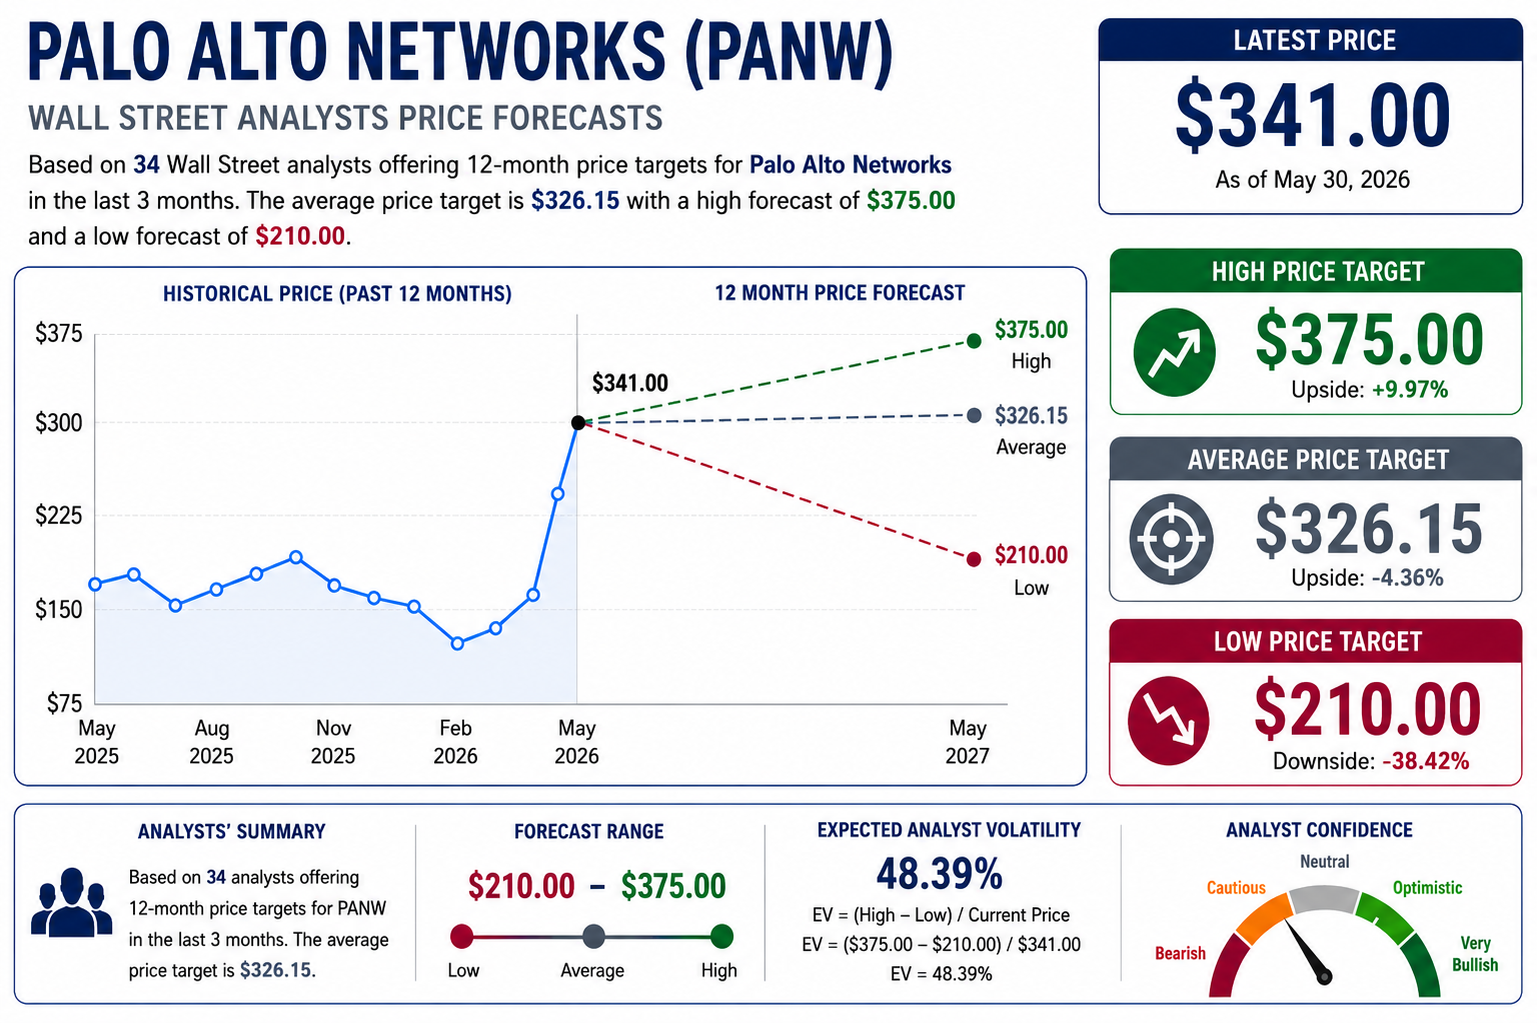
For most traders and investors, volatility is one of those words everyone throws around but very few actually measure. One practical way to make it real is to look at the analysts who spend every day following a single company and compare their most optimistic and most pessimistic forecasts. In the case of $PANW, Wall Street’s highest target is $375, while its lowest target is $210. That $165 spread, compared to the current stock price of $341, produces an expected analyst volatility of 48.39%. That is not a sign of unanimous conviction. It tells us that even professionals who follow Palo Alto Networks full-time see dramatically different paths forward, suggesting there is still considerable uncertainty surrounding where the stock ultimately belongs.
That 48.39% spread is really a measurement of agreement versus disagreement. A narrow spread would suggest analysts generally agree on the company’s future, making price surprises less likely. A spread approaching fifty percent tells a different story. It says Wall Street agrees that Palo Alto Networks is an outstanding cybersecurity company, but there is far less agreement about what that quality is actually worth. Some analysts believe today’s valuation already discounts years of future growth, while others see additional upside as artificial intelligence, cloud security, and platform consolidation continue driving earnings higher. For traders, that usually means a stock capable of making larger-than-normal moves whenever earnings, guidance, or major customer announcements challenge the current narrative.
The opportunity lies in recognizing that disagreement often creates movement, and movement creates opportunity. Momentum traders may continue finding attractive setups as long as the company keeps exceeding expectations and management raises guidance, forcing skeptical analysts to lift their price targets. At the same time, the unusually wide forecast range reminds investors that expectations are far from settled. A single disappointing quarter could just as easily force optimistic analysts to lower their targets, creating sharp downside volatility. The stock therefore favors disciplined momentum traders who respect trends but remain quick to manage risk, because when Wall Street cannot agree on fair value, the market has a habit of settling the debate with large price swings rather than quiet consensus.
52 Week High and Low Boundaries
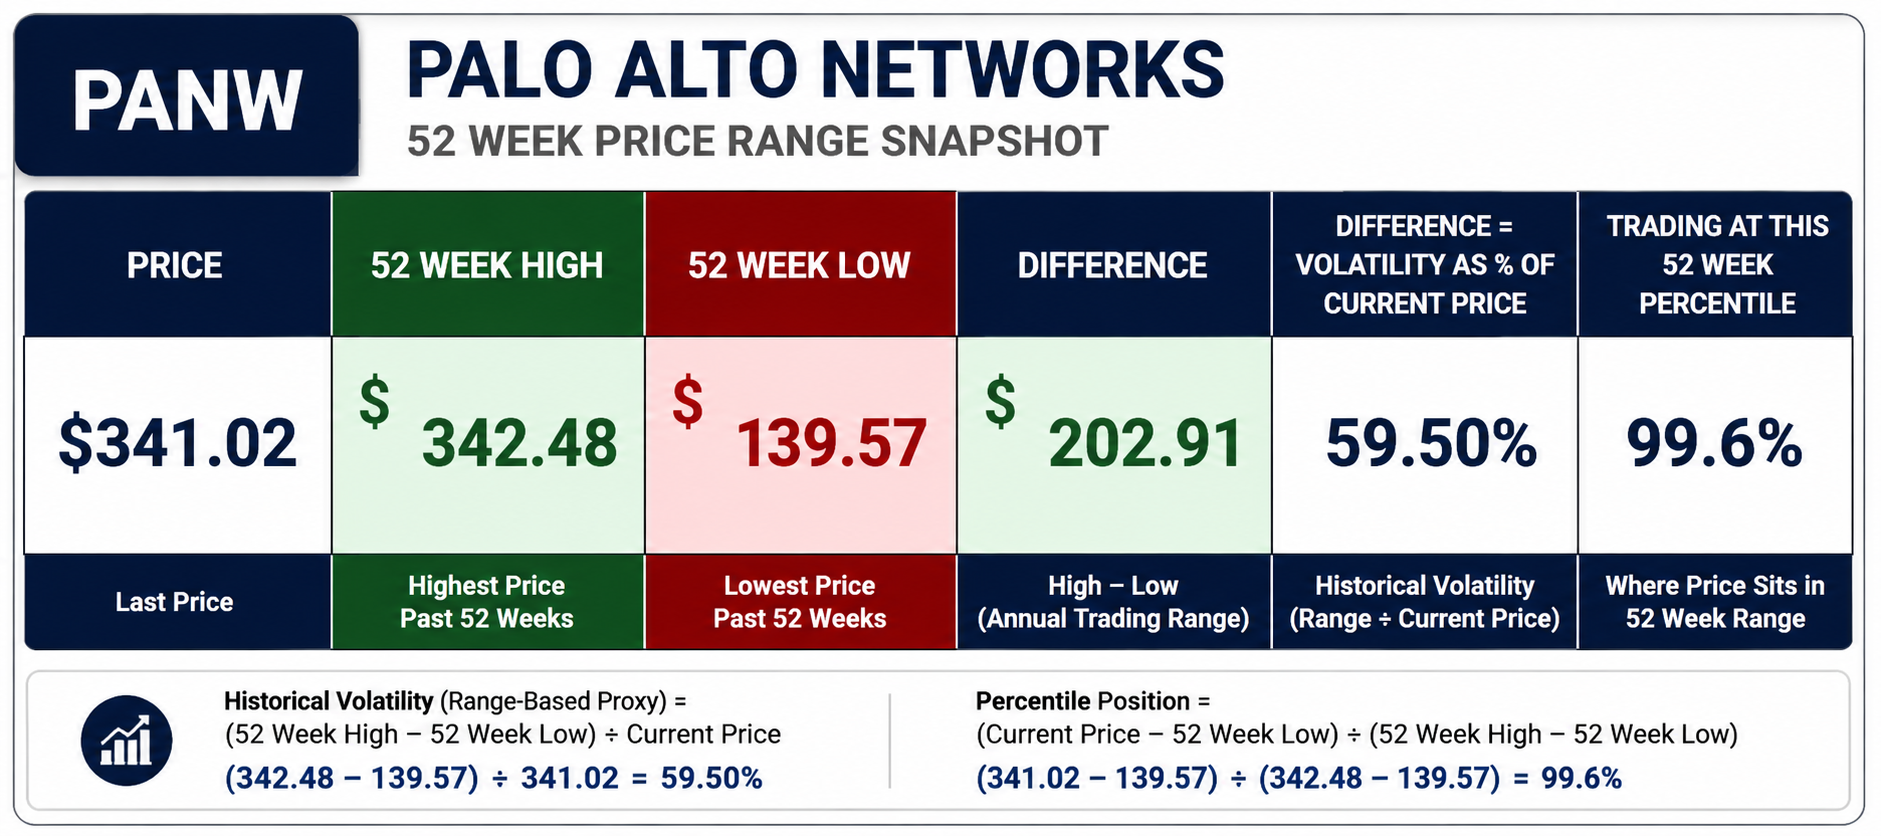
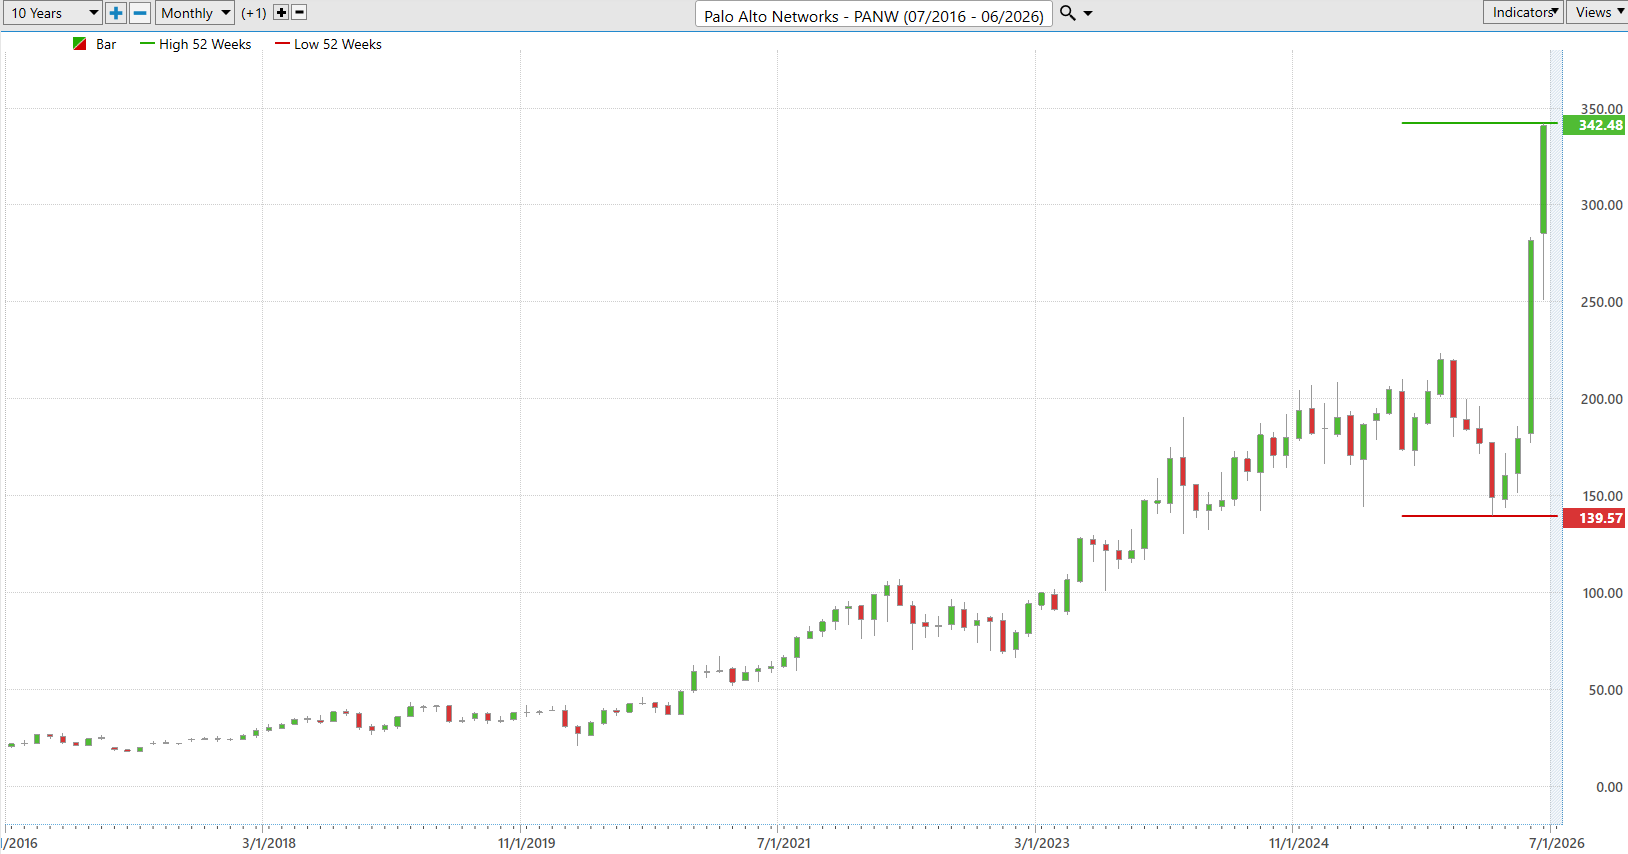
Another practical way to understand volatility is to stop looking at opinions and start looking at history. Every stock leaves behind a trail of clues over the course of a year, and one of the simplest ways to measure that journey is by comparing its highest and lowest prices over the past 52 weeks. For PANW, the 52-week high is $342.09 and the 52-week low is $139.57, creating an annual trading range of $202.52. Dividing that range by the current price of $341.00 produces a historical volatility measure of 59.39%. The stock is currently trading at approximately the 99.5th percentile of its annual range, meaning it is sitting almost exactly at its highest price of the past year. That is the behavior of a market leader, not a laggard. Smart traders study this measurement because it provides a simple approximation of what the stock has actually been capable of doing over the last twelve months.
The 59.39% historical volatility tells us PANW is capable of making large price swings over time. By comparison, the current spread between Wall Street’s highest and lowest analyst price targets produces an Expected Analyst Volatility of 48.39%. That comparison is revealing. History suggests PANW has actually been more volatile than Wall Street currently expects. In other words, the stock’s actual price movement over the past year exceeded the range of outcomes analysts are forecasting today. That could mean analysts are becoming more confident about the company’s outlook, or it could mean they are underestimating just how far this stock is capable of moving when new information reaches the market. Either way, traders should recognize that the stock has a history of producing larger moves than today’s consensus implies.
For traders, this creates an intriguing setup. $PANW is trading just beneath its 52-week high, confirming that institutions continue to accumulate shares and that the long-term trend remains firmly intact. A decisive breakout above $342.09, supported by strong volume and improving fundamentals, would signal that buyers remain in control and could trigger another round of momentum buying. Conversely, repeated failures at new highs followed by a break below recent support would be an early warning that institutional demand is beginning to fade. The reward still favors disciplined momentum traders while the trend remains intact, but the difference between 59.39% historical volatility and 48.39% expected analyst volatility is worth remembering. The market has already demonstrated it can move farther than Wall Street currently expects, and when that happens, both opportunity and risk tend to arrive much faster than most investors anticipate.
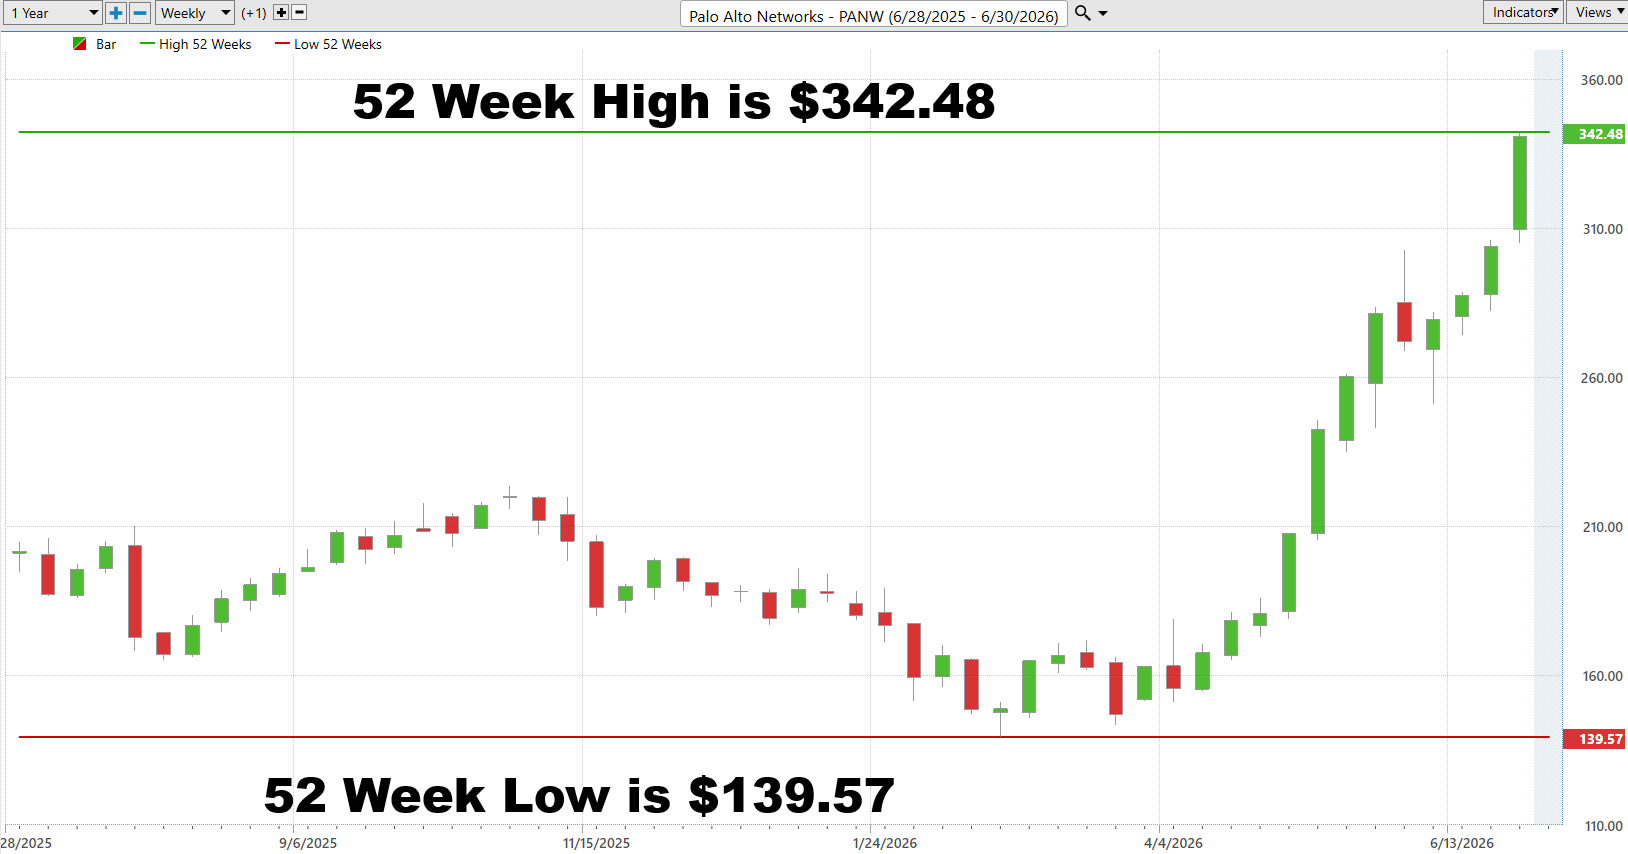
One of our favorite trading setups is surprisingly simple. We look for stocks that are doing something very few companies ever accomplish, making new 52-week highs and new 10-year highs at the same time. That combination tells you the market is no longer wrestling with old resistance because every investor who bought over the past decade is sitting on a profit. $PANW is a textbook example. Traders who recognized this breakout early weren’t just buying another technology stock. They were stepping onto a freight train that kept picking up speed as institutional money poured into one new high after another. The lesson is hard to ignore. Great stocks rarely ring a bell before they move. They simply keep making new highs while everyone else waits for a pullback that never seems to arrive.
Best-Case/Worst-Case Scenario Analysis
One of the biggest mistakes traders make is focusing only on where a stock is today instead of understanding what it has historically been capable of doing. The market leaves behind a record of its behavior, and that record is often more valuable than anyone’s prediction. Over the past 52 weeks, $PANW experienced a largest uninterrupted advance of approximately 114% and a largest uninterrupted decline of approximately 36.9%. Those numbers are not forecasts. They are a practical measure of the opportunity and risk the stock has already demonstrated. Knowing what a stock has been capable of doing gives traders a far better framework for sizing positions and managing expectations.
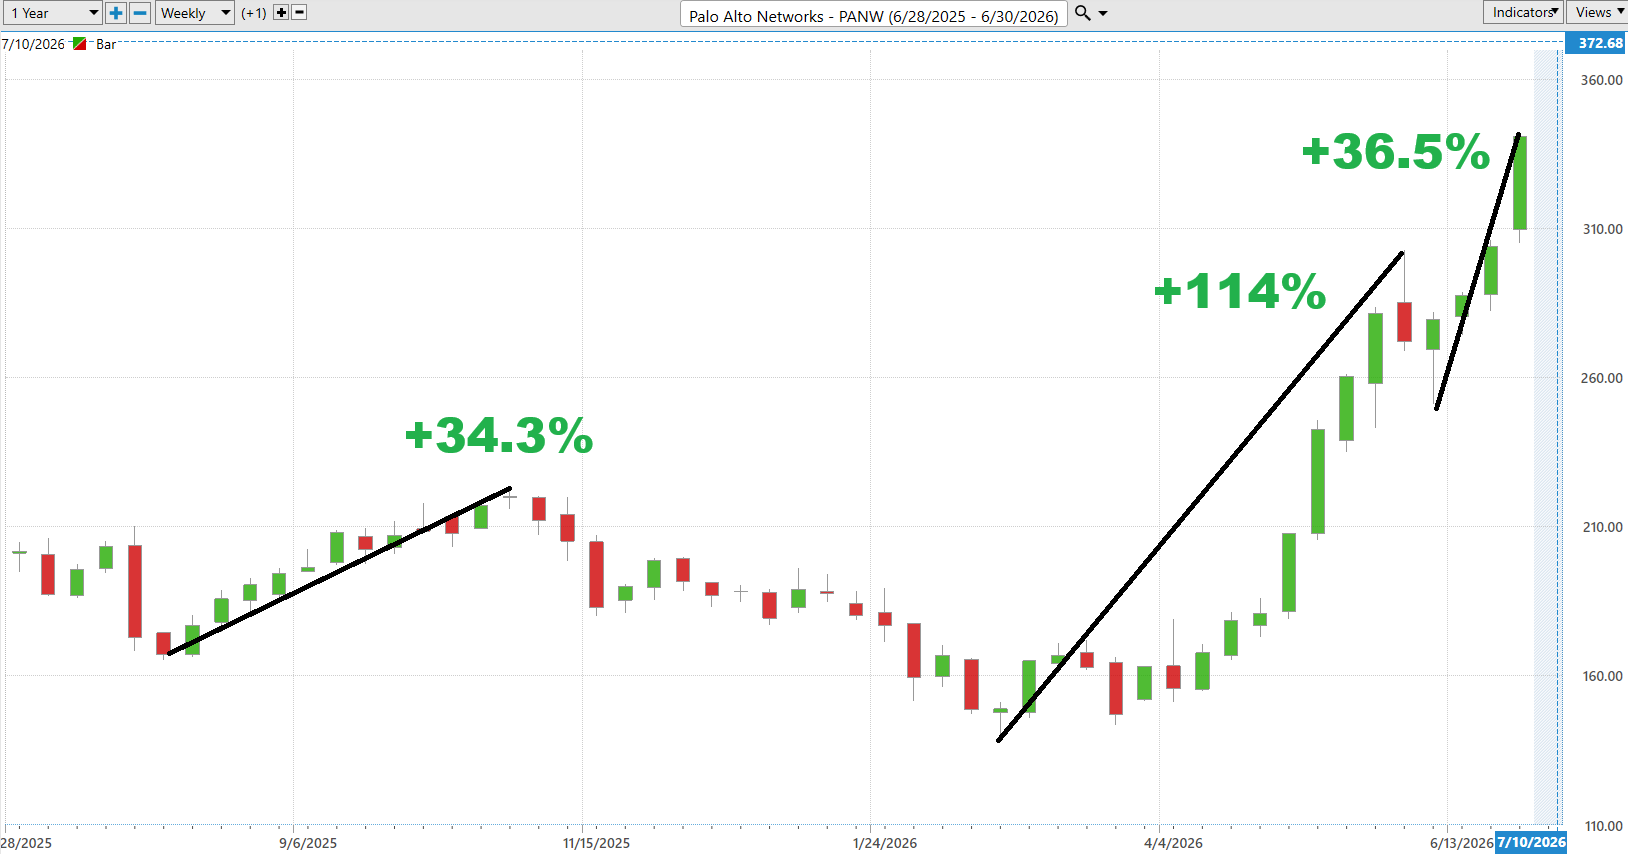
The best-case scenario is impressive. At one point during the past year, buyers drove PANW more than 114% higher without suffering a meaningful interruption in the trend. Moves of that magnitude rarely happen by accident. They usually occur when institutional money steadily accumulates shares, earnings continue surprising to the upside, and investor confidence builds with each new breakout. If the company continues delivering strong fundamentals, expanding revenue, and favorable guidance while the broader technology sector remains healthy, history suggests another powerful advance is entirely possible. It may not be another 114% rally, but the chart reminds us that exceptional companies can produce exceptional trends.
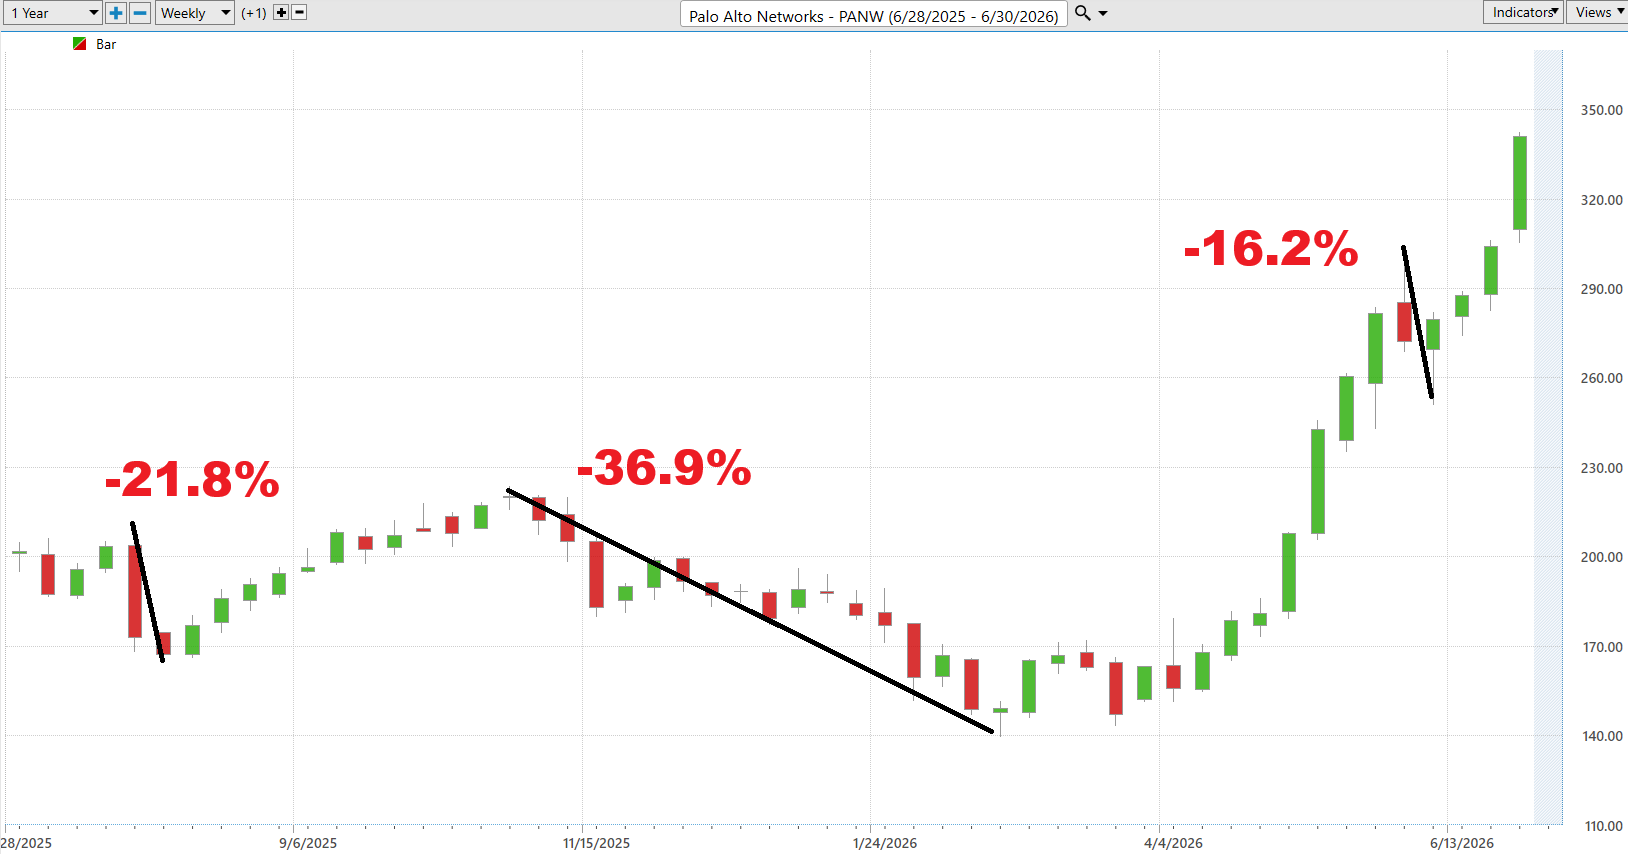
The worst-case scenario deserves equal respect. During the same period, $PANW experienced an uninterrupted decline of approximately 36.9%, reminding traders that even premier companies are not immune to sharp corrections. Pullbacks of this size often occur when valuations become stretched, sentiment changes quickly, or investors begin questioning future growth. That is why disciplined traders define their exit strategy before entering a position instead of making emotional decisions after prices begin falling. The lesson is straightforward. $PANW has demonstrated the ability to reward patient momentum traders with the potential of extraordinary gains, but it has also shown it can punish complacency just as quickly. Successful trading is not about predicting which path comes next. It is about understanding both possibilities, respecting risk, and committing capital only when the probabilities appear to be in your favor.
Next we compare the performance of $PANW to the broader stock market averages.
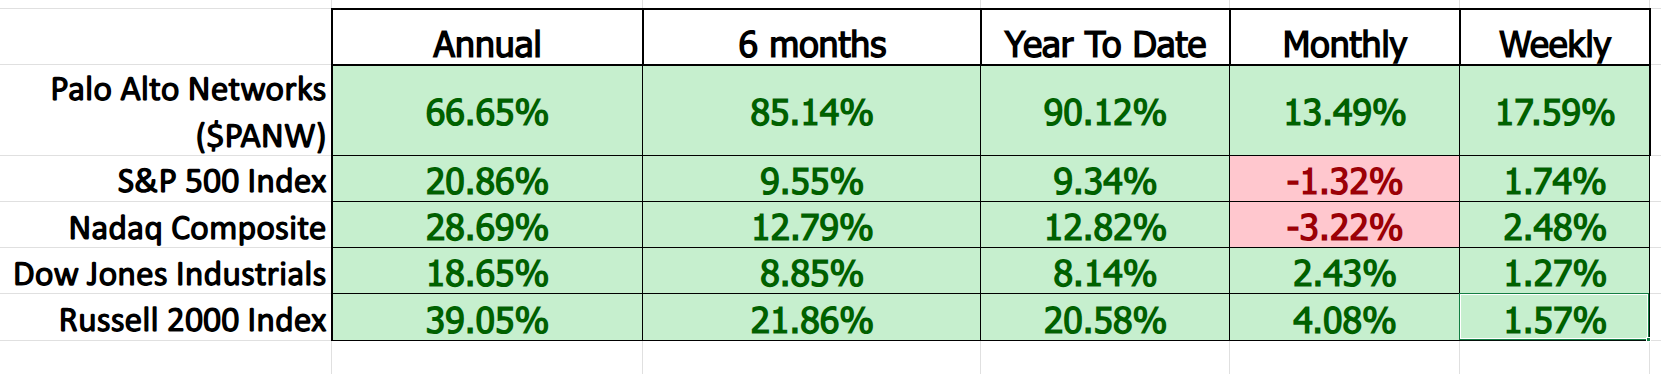
Performance leaves clues. Right now, $PANW is leaving a trail that is difficult to ignore. Over the past year it has gained 66.65%, more than tripling the return of the S&P 500 and more than doubling the performance of the Nasdaq Composite. The dominance becomes even more striking over the past six months and year to date, where PANW has surged 85.14% and 90.12%, while the major market averages have struggled to produce even low double-digit gains. Great stocks do not outperform by accident. They outperform because institutions continue accumulating shares, earnings continue validating the story, and buyers consistently overwhelm sellers.
The shorter-term numbers tell the same story. During the past month, $PANW advanced 13.49% while both the S&P 500 and Nasdaq declined, proving the stock continued attracting capital even as the broader market lost momentum. Over the past week it climbed another 17.59%, dramatically outperforming every major index and confirming that buyers remain firmly in control. This is exactly the type of leadership professional traders search for because strength tends to attract more strength. Markets reward leadership, and $PANW has been leading across virtually every meaningful time frame. Until that pattern of sustained relative outperformance begins to change, the weight of the evidence suggests institutions are still treating this stock as one of the premier momentum names in the technology sector.
Vantagepoint AI Predictive Blue Line
One of the greatest challenges traders face is separating a genuine trend from ordinary market noise. That is exactly what the Predictive Blue Line is designed to accomplish. Rather than reacting to where price has already been, it attempts to identify where the underlying trend is likely headed next. In $PANW, the message could hardly be clearer. The Predictive Blue Line has remained firmly above the actual moving average for most of the advance, and both lines are now accelerating higher. That is a classic picture of institutional demand steadily overpowering supply.
What makes this setup particularly compelling is not simply that the stock is rising, but that the distance between the Predictive Blue Line and the actual moving average is widening once again after a brief period of consolidation. Healthy trends often pause before resuming their advance, allowing the market to digest earlier gains without destroying the underlying momentum. That appears to be exactly what happened here. Buyers stepped back in aggressively, the predictive trend turned sharply upward, and price quickly followed. It is another reminder that the strongest stocks rarely move in a straight line. They alternate between periods of expansion and consolidation before continuing higher.
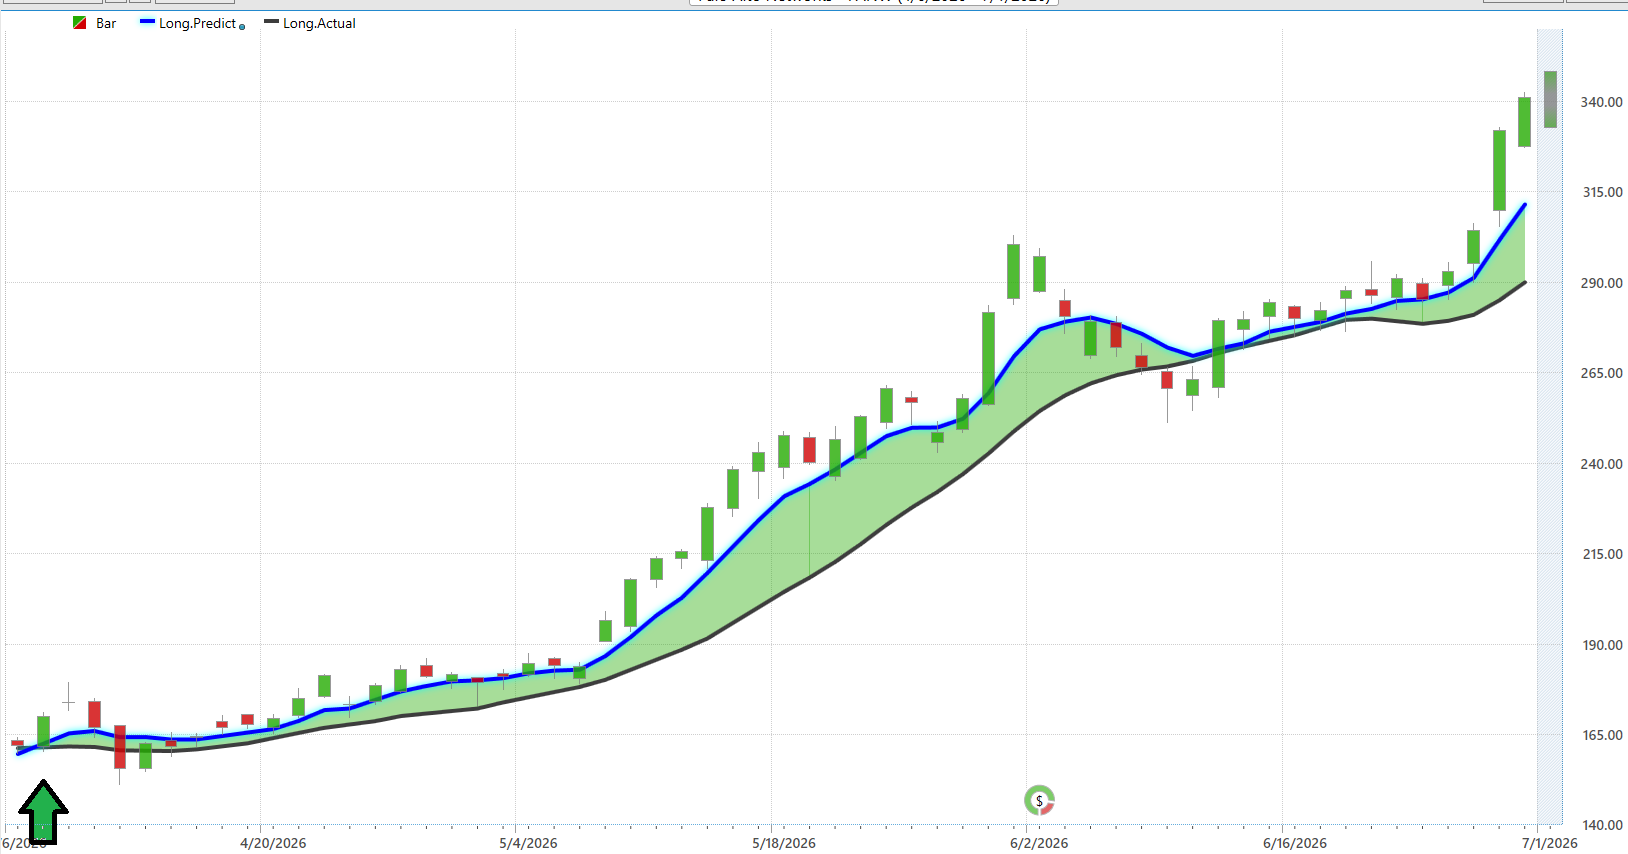
For traders, the takeaway is straightforward. As long as the Predictive Blue Line remains above the actual moving average and both continue sloping upward, the path of least resistance remains higher. That does not guarantee the stock will rise every day, but it does suggest that pullbacks are more likely to be pauses within an established uptrend than the beginning of a major reversal. The earliest warning sign would not be a single down day. It would be a flattening Predictive Blue Line followed by a crossover below the actual moving average, signaling that institutional momentum is beginning to weaken. Until that occurs, the evidence continues to favor traders willing to align themselves with the prevailing trend rather than fight it.
VantagePoint AI Neural Index (Machine Learning)
One of the biggest challenges in trading is determining whether today’s price movement is simply market noise or the beginning of a meaningful trend. The Neural Index was designed to answer that question. Using VantagePoint’s patented artificial intelligence, the Neural Index analyzes dozens of intermarket relationships that have historically influenced a stock’s price, then converts that analysis into a simple directional forecast for the next 48 to 72 hours. Instead of forcing traders to interpret dozens of economic and market variables, it distills that information into an easy-to-read indicator. A green Neural Index suggests market conditions favor higher prices over the near term, while a red Neural Index signals increasing downside pressure. It is not intended to predict the magnitude of a move. Rather, it forecasts the most likely direction of the short-term trend.
For $PANW, the message is remarkably constructive. The Neural Index has spent the overwhelming majority of the recent advance flashing green, indicating that the underlying intermarket relationships continue to support higher prices. Although there have been a handful of brief red signals during periods of consolidation, they proved to be temporary pauses rather than lasting trend reversals. Each time the Neural Index quickly returned to green, buyers regained control and the stock resumed its advance. That consistency tells us the market has repeatedly confirmed the strength of the longer-term uptrend rather than challenging it.
The greatest value of the Neural Index is not that it replaces sound judgment, but that it helps traders avoid fighting the prevailing trend. When a green Neural Index aligns with an upward-sloping Predictive Blue Line, traders have what we refer to as double confirmation. One indicator is forecasting higher prices over the next several days, while the other confirms that the broader trend is also moving higher. That combination has been clearly visible throughout $PANW’s recent rally. Until the Neural Index begins producing sustained red signals while the Predictive Blue Line simultaneously loses upward momentum, the probabilities continue to favor buyers. Successful trading is rarely about predicting every twist and turn. More often, it is about recognizing when multiple independent indicators are telling the same story and having the discipline to follow the evidence rather than the emotion.

VantagePoint AI Daily Range Forecast
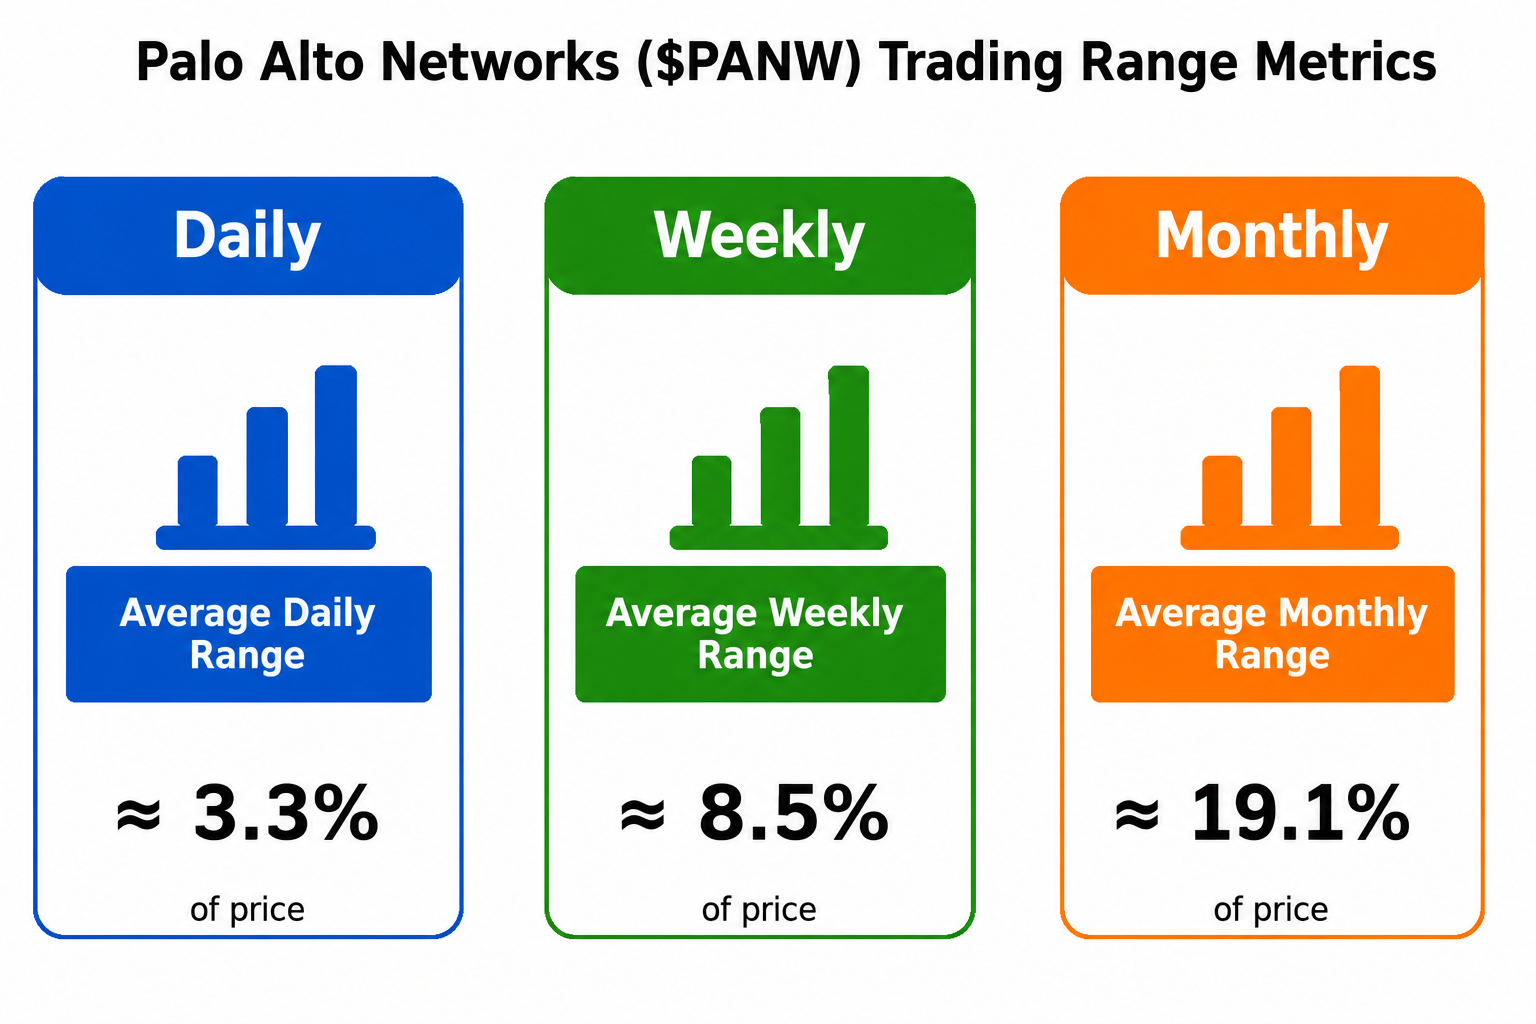
Every trader begins the day asking the same question: How far can this stock reasonably move before the closing bell? The market rarely provides an answer, which explains why so many traders spend the afternoon wondering where all their profits disappeared. The Daily Range Forecast was built to replace guesswork with probability. Using VantagePoint’s patented artificial intelligence, it projects the most likely high and low boundaries for the upcoming trading session before the market opens. It does not claim to predict every tick. It provides a practical roadmap so traders can begin the day with realistic expectations instead of wishful thinking.
Professional traders understand that a trade is only half the job. Knowing where to get out is often more important than knowing where to get in. The Daily Range Forecast helps frame that decision by identifying where price is statistically likely to encounter resistance near the projected high or support near the projected low. If $PANW races toward the forecast high shortly after the opening bell, disciplined traders recognize that much of the day’s expected move may already be behind them. If the stock spends most of the session near the middle of the projected range, there may still be room for the trend to develop. It is less like owning a crystal ball and more like carrying a road map instead of driving through the mountains with your eyes closed.
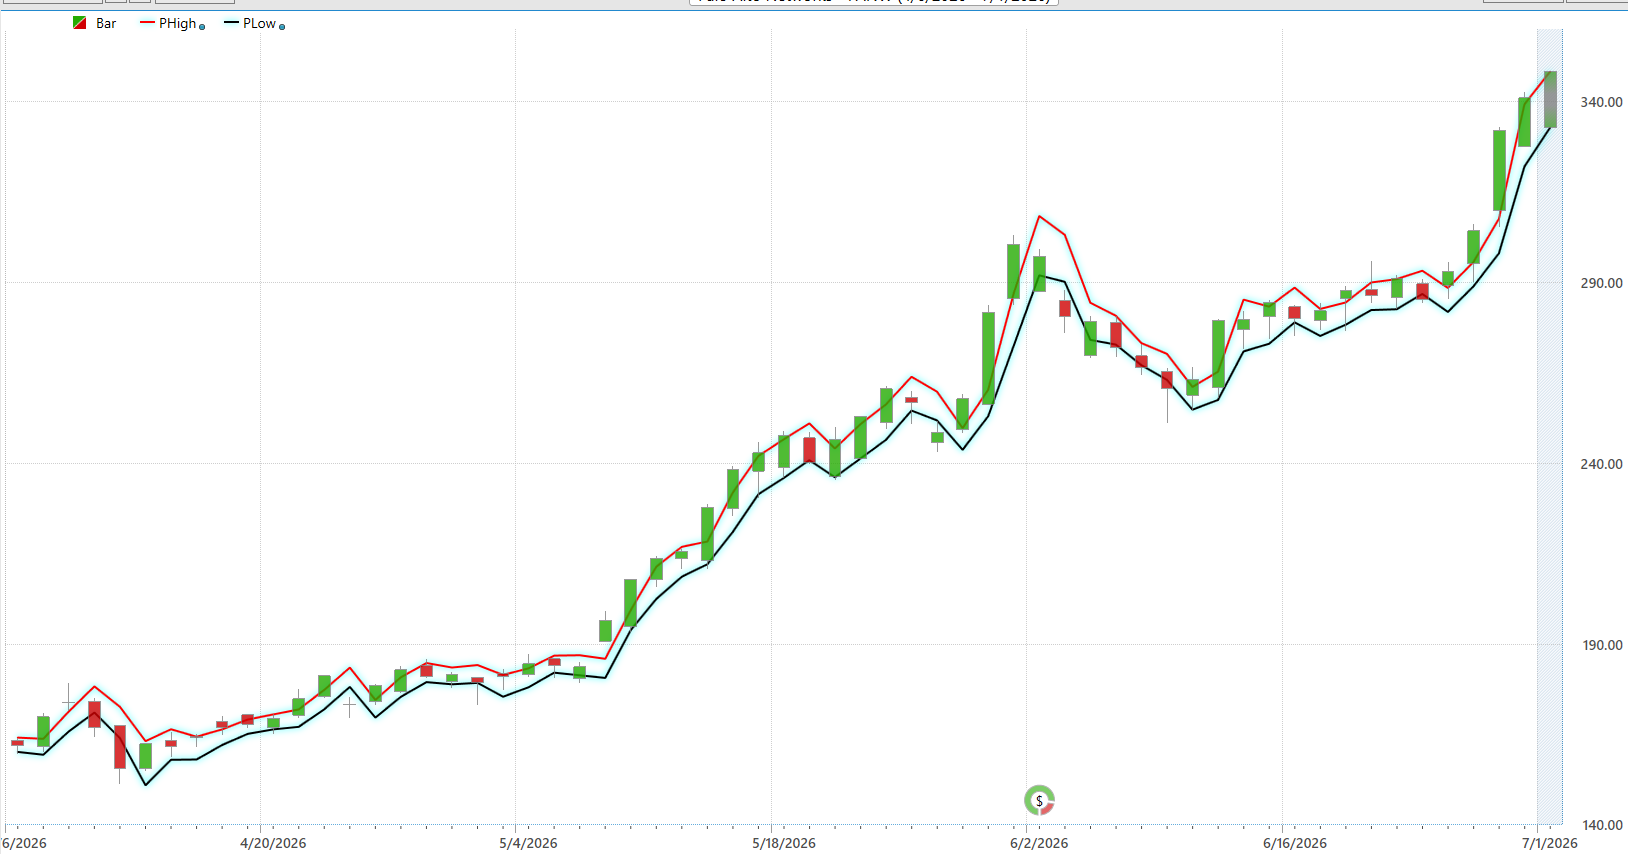
For $PANW, the picture remains decidedly bullish. Both the projected high and projected low continue climbing in lockstep with price, confirming that the artificial intelligence expects higher ground rather than a change in direction. That is exactly what you want to see in a healthy momentum stock. The market is not merely drifting higher. It is expanding its expected trading range as buyers continue pressing their advantage. Could the stock overshoot the forecast? Absolutely. Markets occasionally behave like caffeinated teenagers with a new driver’s license. But as long as the projected range keeps rising alongside the prevailing trend, the probabilities continue favoring momentum traders who let the trend do the heavy lifting while using the forecast to manage entries, exits, and risk with discipline rather than emotion.
VantagePoint AI Intermarket Analysis
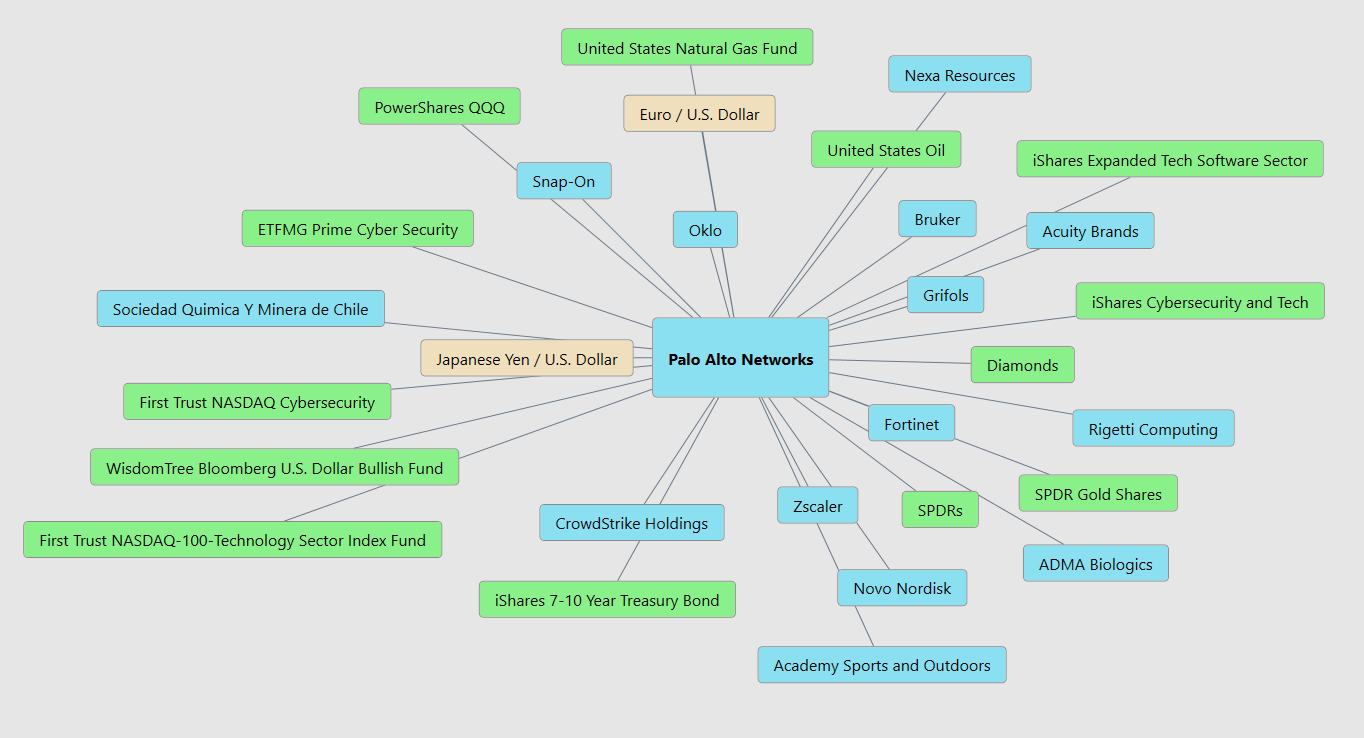
Intermarket analysis is the study of how stocks, bonds, currencies, commodities, and other markets influence one another and ultimately drive the price of a particular asset. Understanding these relationships helps traders identify emerging trends earlier, improve probabilities, and make better-informed trading decisions. Most investors think they are buying a cybersecurity company. In reality, they are buying into an entire financial ecosystem. The intermarket map shows that $PANW is influenced by far more than its own earnings. Technology ETFs, competing cybersecurity stocks, interest rates, currencies, commodities, and institutional money flows all help shape the stock’s direction. Instead of viewing $PANW in isolation, the graphic reveals the hidden network of relationships that professional traders monitor every day.
The most important influences come from the technology sector itself. Large technology and cybersecurity ETFs, along with competitors such as CrowdStrike, Fortinet, and Zscaler, often move together as institutional investors rotate capital among the industry’s strongest companies. Interest rates also play a major role because lower borrowing costs generally increase the value investors place on fast-growing technology businesses. Meanwhile, movements in the U.S. dollar and major global currencies can influence international revenue, while commodities such as oil and gold provide clues about inflation, economic growth, and overall investor sentiment.
The biggest takeaway is that no stock trades in a vacuum. $PANW’s price is constantly responding to dozens of interconnected forces, many of which have little to do with the company’s day-to-day operations. VantagePoint’s artificial intelligence analyzes these intermarket relationships simultaneously, identifying subtle patterns that would be nearly impossible for a human trader to monitor manually. When multiple intermarket drivers begin moving in the same direction, they often create the conditions for powerful trends long before the reasons become obvious to the broader market.
Our Suggestion
Management has spent the past two earnings calls delivering a consistent message: Palo Alto Networks is no longer simply a firewall company. It is becoming a comprehensive cybersecurity platform built around cloud security, artificial intelligence, and subscription-based services. More importantly, the company has largely backed up that narrative with execution. Revenue continues to grow at a healthy pace, recurring subscriptions remain the engine of the business, and free cash flow remains robust. The market has rewarded that consistency because management has demonstrated an ability to integrate acquisitions, expand customer relationships, and position the company at the center of one of the fastest-growing areas in enterprise technology.
Wall Street’s attention has now shifted from whether Palo Alto Networks is a great business to whether it can continue exceeding already elevated expectations. The next earnings report will be scrutinized for subscription growth, remaining performance obligations, operating margins, customer expansion, and forward guidance. Based on the company’s historical reporting schedule and current analyst estimates, the next earnings report is expected around Monday, August 17, 2026, after the market closes. The earnings conference call would typically follow that afternoon at approximately 4:30 p.m. Eastern Time.
For traders, these are the metrics that will matter most:
-
Revenue growth
-
Operating margins
-
Free cash flow
-
Management’s guidance for fiscal Q1 2027 and beyond
Given PANW’s premium valuation and recent momentum, guidance will likely have a greater impact on the stock than whether it beats earnings estimates by a few cents. Wall Street will be looking for evidence that enterprise AI security demand, platform consolidation, and recurring subscription growth remain strong. Investors will also be watching adoption of the company’s AI-powered security offerings to determine whether artificial intelligence becomes another meaningful growth catalyst rather than simply a marketing slogan. The company needs continued evidence that enterprise customers are consolidating their cybersecurity spending onto the Palo Alto platform. Any sign that revenue growth is slowing or guidance is becoming more cautious would likely receive an outsized reaction from investors.
The technical picture remains equally compelling. $PANW continues to outperform the broader market across nearly every meaningful time frame while trading at the upper end of its 52-week range and approaching new long-term highs. The Predictive Blue Line remains firmly bullish, the Neural Index has consistently confirmed the prevailing trend, and the Daily Range Forecast continues projecting higher price boundaries, suggesting momentum remains firmly in the buyers’ favor. Intermarket analysis reinforces that outlook as institutional money continues flowing into technology and cybersecurity while the company’s strongest peers also demonstrate healthy relative strength. None of these indicators guarantee higher prices tomorrow, but together they present a picture of a stock that continues benefiting from favorable probabilities rather than isolated optimism.
Our suggestion is straightforward. $PANW remains well suited for momentum traders, swing traders, and long-term investors seeking exposure to one of the highest-quality franchises in cybersecurity. The greatest risk is not the business itself but the expectations surrounding it, because outstanding companies often experience their sharpest declines when they merely disappoint rather than deteriorate. Traders should continue monitoring earnings guidance, subscription growth, and institutional buying while using the VantagePoint AI Daily Range Forecast to identify higher-probability entry points, realistic profit objectives, and disciplined risk parameters before every trade. Successful traders consistently align their capital with businesses that are executing, trends that remain intact, and probabilities that continue improving.
Practice great money management on all of your trades. Position sizing is critical when trading $PANW.
It’s not magic.
It’s machine learning.
Disclaimer: THERE IS A HIGH DEGREE OF RISK INVOLVED IN TRADING. IT IS NOT PRUDENT OR ADVISABLE TO MAKE TRADING DECISIONS THAT ARE BEYOND YOUR FINANCIAL MEANS OR INVOLVE TRADING CAPITAL THAT YOU ARE NOT WILLING AND CAPABLE OF LOSING.
VANTAGEPOINT’S MARKETING CAMPAIGNS, OF ANY KIND, DO NOT CONSTITUTE TRADING ADVICE OR AN ENDORSEMENT OR RECOMMENDATION BY VANTAGEPOINT AI OR ANY ASSOCIATED AFFILIATES OF ANY TRADING METHODS, PROGRAMS, SYSTEMS OR ROUTINES. VANTAGEPOINT’S PERSONNEL ARE NOT LICENSED BROKERS OR ADVISORS AND DO NOT OFFER TRADING ADVICE.


