


This week’s stock analysis Range Resources ($RRC)
The Range Resources Company is a natural gas exploration and production company. They are headquartered in Fort Worth, Texas.
The Company is engaged in the exploration, development and acquisition of natural gas and oil properties in the United States. Its principal area of operation is the Marcellus Shale in Pennsylvania. Its natural gas and oil operations are concentrated in the Appalachian region of the United States, in the Marcellus Shale in Pennsylvania. The Company’s properties consist of interests in developed and undeveloped natural gas and oil leases. It owns over 1,350 net producing wells.
The word on the Street is that in 2022, thanks to rising natural gas prices, Range Resources is optimistically projected to generate more than $1 billion in free cash flow. The board plans to use $500 million of this cash for stock repurchases.
Instead of boosting capital spending, Range Resources is using its extra cash to pay down debt and buy stock.
$RRC is one of the largest independent producers of natural gas in the world, boasting the leadership position in the extremely wealthy Marcellus Basin. Over the last 18 months with the dramatic price increase in energy prices $RRC has been a beneficiary of this supply/demand imbalance.
Range Resources reported a 162% year-over-year increase in revenue to $1.57 billion. Net income soared to $891.4 million, from $38.4 million in the same quarter the previous year. Furthermore, Range Resources reduced its net debt by $379 million in 2021.
Anyone would be hard pressed to find a better performing trade over the last two years than $RRC.
In this weekly stock study, we will look at and analyze the following indicators and metrics as are our guidelines which dictate our behavior in deciding whether to buy, sell, or stand aside on a particular stock.
- Wall Street Analysts’ Estimates
- 52-week High and Low Boundaries
- The Best Case and Worst-Case Scenarios Over the Last Year
- Vantagepoint A.I. Forecast (Predictive Blue Line)
- Neural Network Forecast
- Daily Range Forecast
- Intermarket Analysis
- Our Trading Suggestion
Analysts’ Ratings
Based on 10 Top Wall Street analysts offering 12-month price targets for Range Resources in the last 3 months. The average price target is $39.97 with a high forecast of $45.00 and a low forecast of $31.00. The average price target represents a 13.11% change from the last price of $33.95.
Wall Street Analysts are definitely bullish. What we especially like about the variety of opinions is that the lowest 12-month forecast is $31, which represents a – $2.95 lower than where $RRC most recently closed. We weigh that risk against the average upside, which is $39.97, and we see a positive risk reward scenario unfolding.
We expect Wall Street analysts to revise these estimates higher as crude and natural gas prices rise and the awareness emerges that we have a massive imbalance between supply and demand in the natural gas market.
52-Week High and Low Boundaries
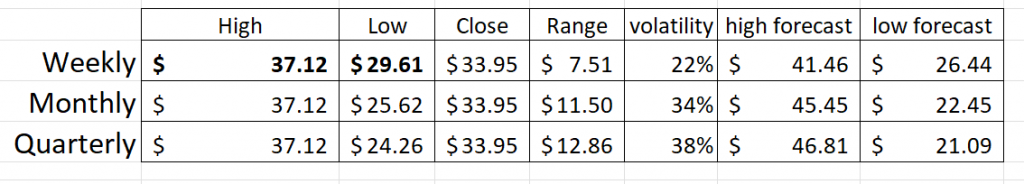
Over the last 52 weeks $RRC has traded as high as $37.12 and as low as $12.37. The annual trading range has been $24.75 which creates an average weekly trading range of .48. We look to amplify this value greatly when trading with A.I.
Now we determine the basic volatility of the asset by simply dividing the annual range of $RRC over the past year by its current price. (24.75 divided by 33.95 = 72.9% volatility) Next, as a benchmark estimate we can add and subtract the annual range to the current close to provide some boundaries for the following year. This tells us that based upon current volatility it would be completely normal to see $RRC trade as high as $58.7 and as low as $9.20 over the following year.
These exact same benchmarks can be calculated for the Weekly. Monthly and Quarterly time frames by simply looking at their trading ranges and dividing by the most recently closing price.
These values can then be compared to the Wall Street Analysts estimates which we previously reviewed.
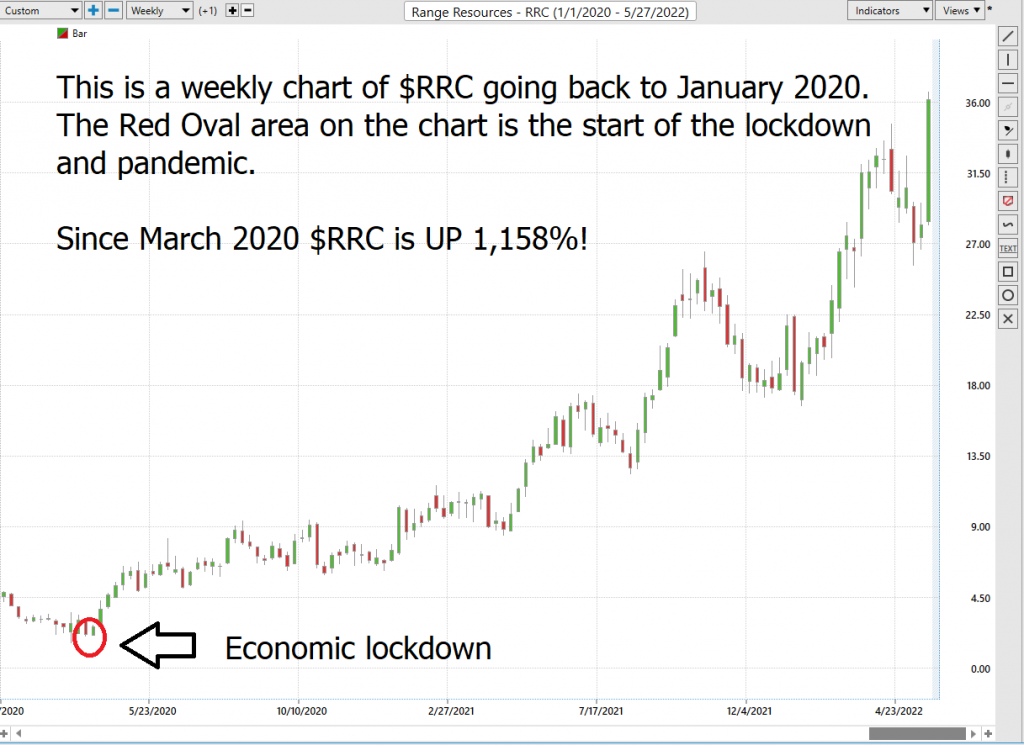
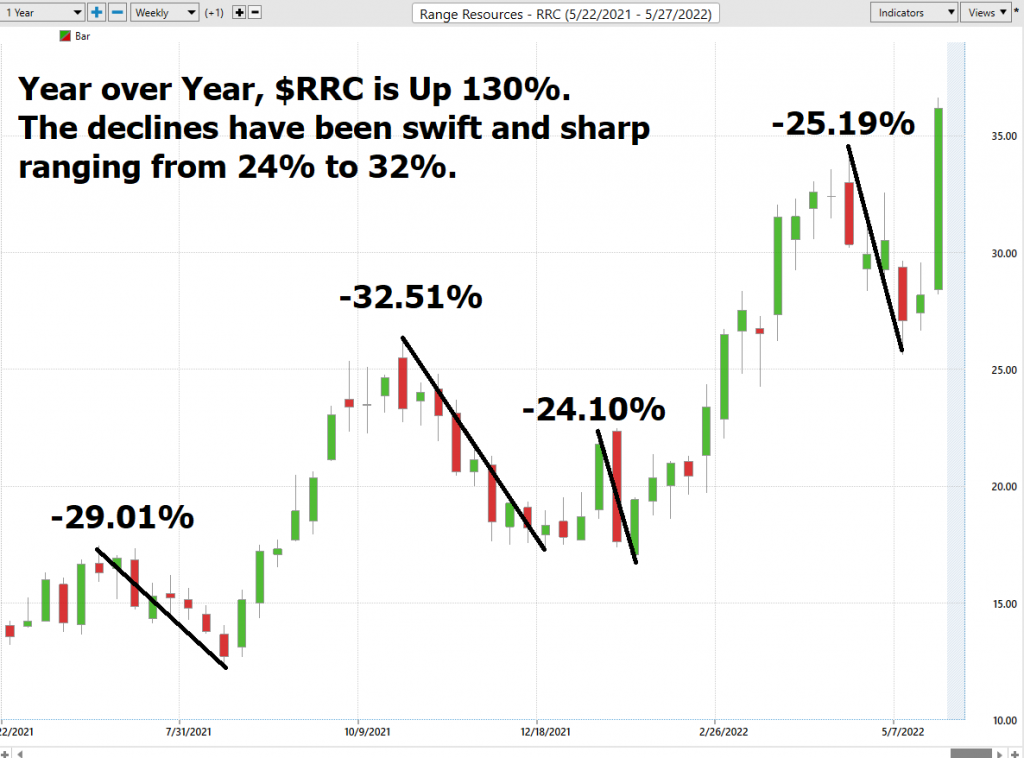
One of the ongoing and very important themes that we ascribe to is to trade and invest in markets that are making new 52-week highs. You’ll find these market leaders are where you want to focus your time and energy on. By simply eyeballing the 52-week chart below you can see that when a stock successfully breaches and closes above its 52-week boundary it enters a new era of volatility and usually advances to a new level very quickly. This is exactly what has occurred with $RRC.
$RRC is the primary beneficiary of higher prices in Natural Gas. Here is the 10-year chart on Natural Gas.
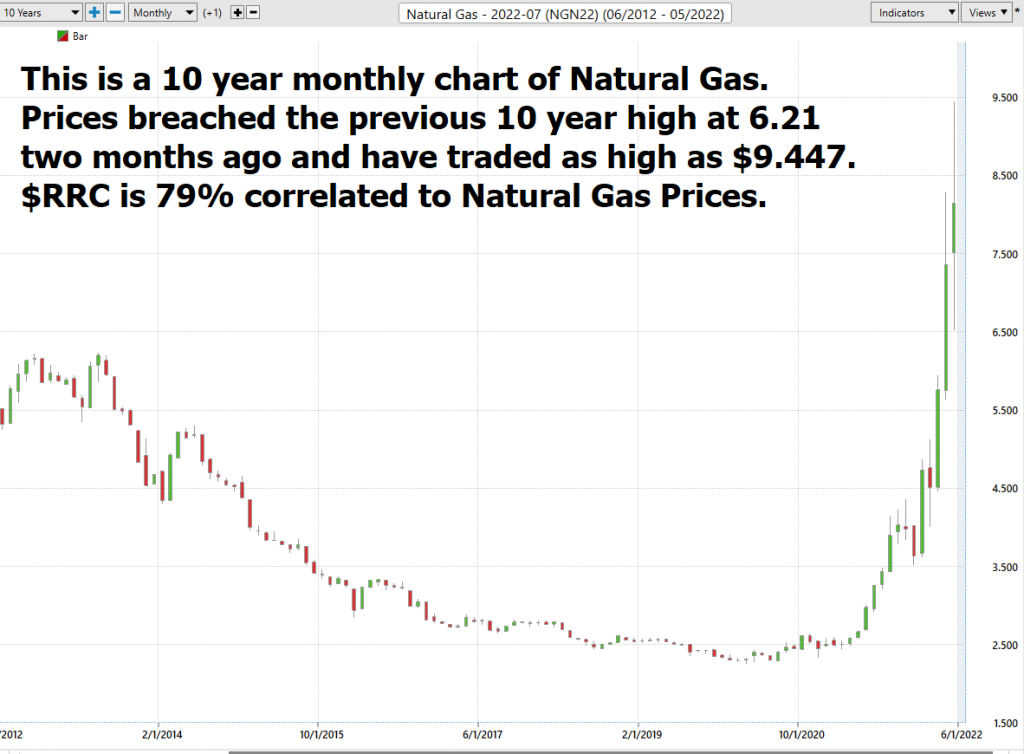
Natural gas prices are soaring to dizzying heights.
The most powerful trading signal in the commodity trading world is when an asset makes new long-term highs. It clearly resonates that a supply and demand imbalance exists. When I study the charts, I see that Crude Oil is on the verge of making new 10-year highs in the coming months. When you compound this factor with the reality that Natural Gas has already exceeded its most recent 10 year high by over 30% it verifies the reality that demand for these basic commodities is much larger than the current supply. U.S. natural gas prices have now rallied more than 130% so far this year. This has been driven primarily by massively increased demand from Europe, as the region evaluates banning gas imports from Russia in the wake of the Russia-Ukraine war. Almost 40% of the European Union’s gas comes from Russia.
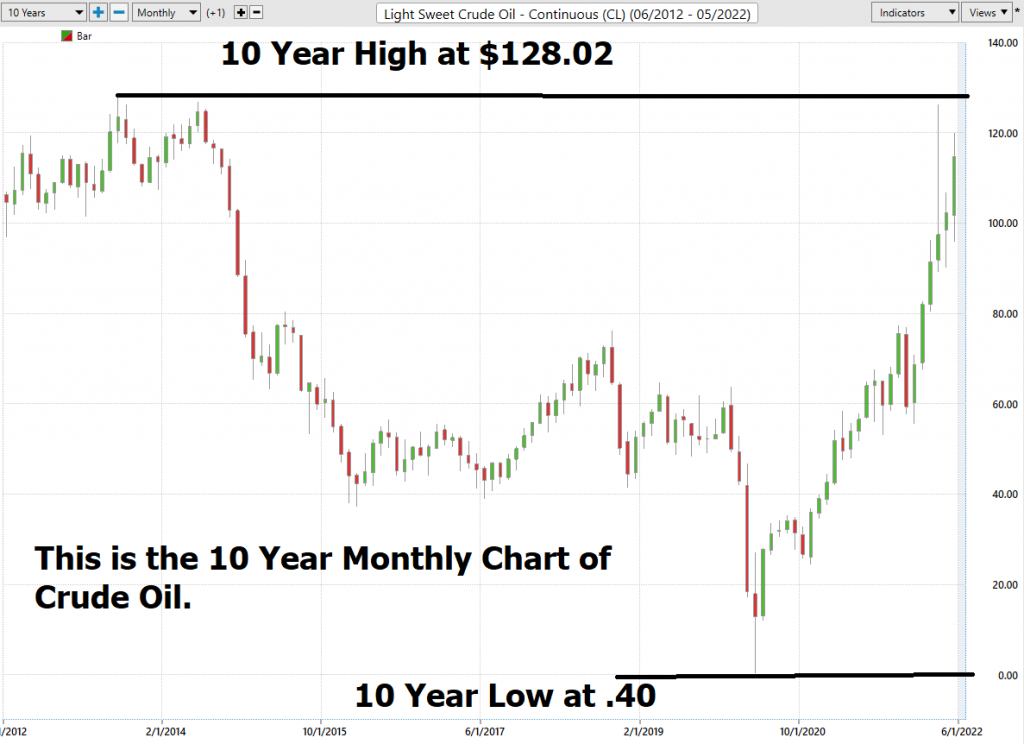
What is capable of driving $RRC prices substantially higher is Crude Oil prices.
As we have written about in previous stock studies one of the most powerful indicators is common sense. When you see a chart making new annual highs as well as new 10-year highs, you may not understand it, but you should be aware of it because something unique and powerful is occurring. For this reason alone, $RRC should be on your trading radar.
Best Case – Worst Case Scenario
When we study the long term 52-week chart we can look at the best case and worst-case scenarios just to get an eyeball perspective of the risk and volatility of this asset. This is worth doing anytime you invest or trade to monetarily understand what the potential risks and rewards have been over the past year.
The following 10-year performance grid tells you everything you need to know to understand why $RRC has been so popular.
The one question great traders and investors ask when times of trouble arise, is “who is winning?” That question allows you to see where the money is being made and determine whether it is a better safe haven for your portfolio.
The volatility in $RRC is huge. But you can’t ignore it has outperformed everything by a massive margin over the past 2 years.
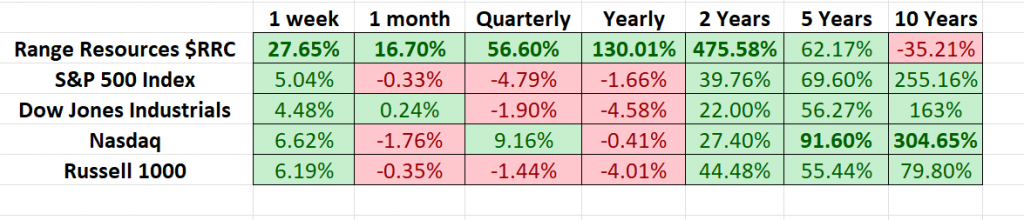
So, in $RRC we have an asset which over the past week, month, quarter, year, and two years has massively outperformed the broader market. In the past year, the worst-case downside was -32% and the best-case upside was +130%.
$RRC currently made a NEW 52-week high and quickly retreated.
Earnings dates have also been a key driver in $RRC price action. The next $RRC earnings call is slated for July 25, 2022.
Lastly the rise in Crude and Natural Gas prices have been a powerful tailwind for $RRC.
This is a powerful narrative that could quickly see $RRC continue to post huge gains in the future.
The Vantagepoint A.I. Analysis
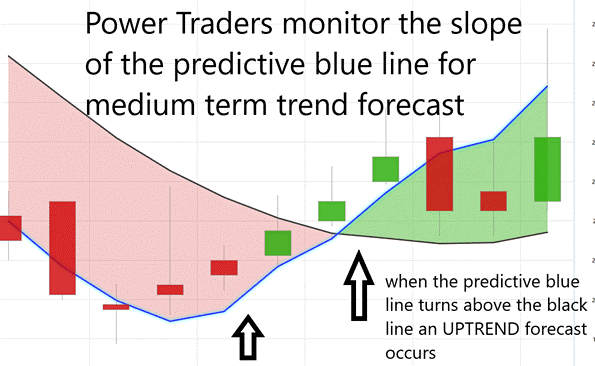
Using the Vantagepoint A.I. Software traders were alerted that the ideal value zone on this uptrend was trying to purchase $RRC at or below the predictive blue line on the chart.
Power traders use the predictive blue line in helping to determine both the value zone as well as the trend direction. I’ve taken the liberty of charting the predictive blue line directly underneath the price bars so that you can see its effectiveness in forecasting the trend.
Whenever you have large actively traded stocks that are trending with large histories, this is the arena where the artificial intelligence excels. It statistically and quantitatively evaluates all previous trends and patterns to determine the best move forward.
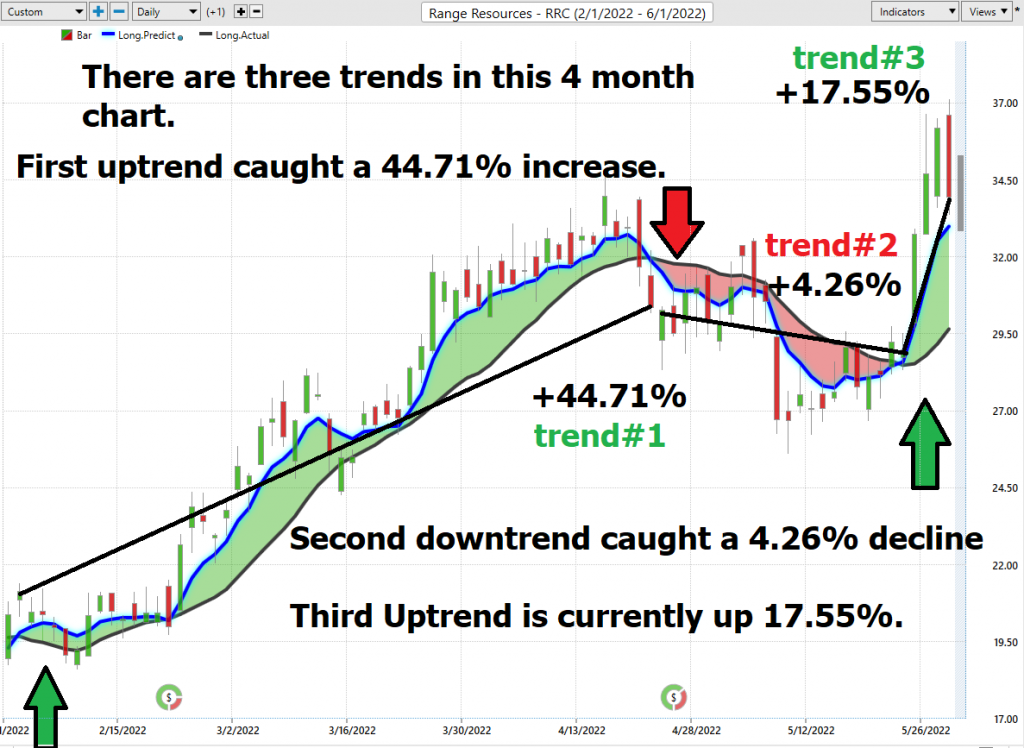
In the following chart of $RRC, you will see three distinct trends which you can compare to the buy and hold strategy.
Notice how the predictive blue line determines both the trend and the ideal value zone.
Neural Network Forecast
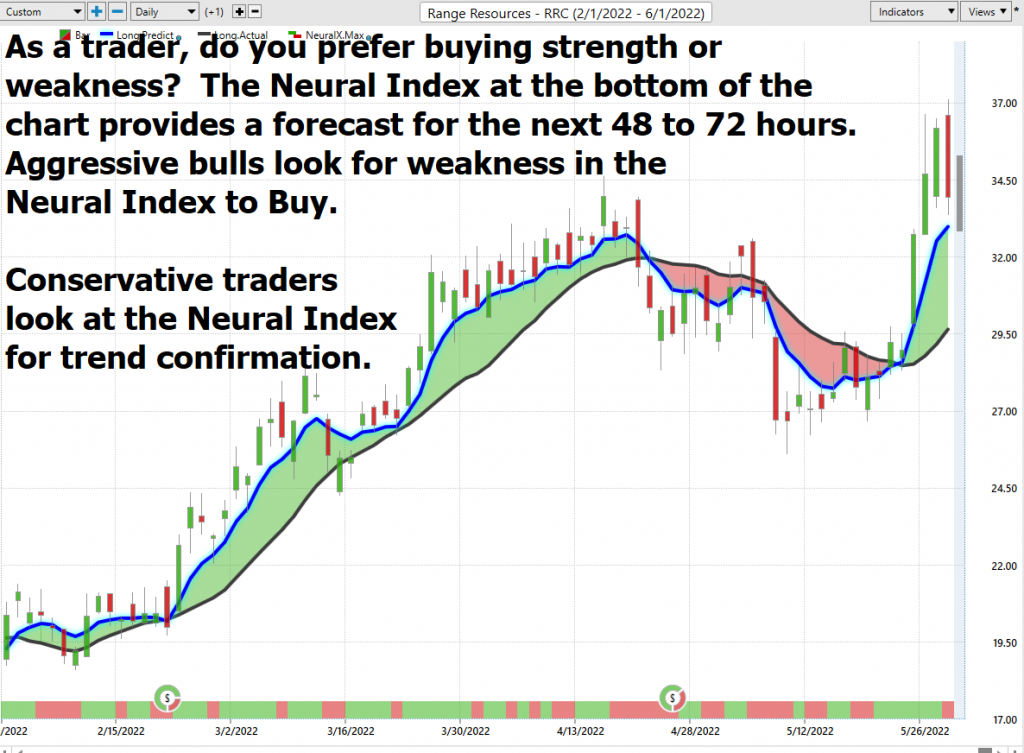
At the bottom of the chart is the Neural Network Indicator which predicts future strength and/or weakness in the market. When the Neural Net Indicator is green it communicates strength. When the Neural Net is Red it is forecasting short term weakness in the market.
We advocate that Power Traders cross reference the chart with the predictive blue line and neural network indicator to create optimal entry and exit points.
Do you prefer buying weakness, or is your trading style one that looks to confirm strength? In either case the Neural Index provides a very accurate forecast with a duration of 48 to 72 hours.
When the Neural Index is green Power Traders confirm it with the predictive blue line.
When the Neural Index is red, Power Traders use the weakness to position themselves on the long side using the weakness in the trend.
A Neural Net is a computational learning system that uses a network of functions to understand and translate massive amounts of data into a desired output, consistently monitoring itself and improving its performance.
Power Traders are always looking to apply both the neural network and A.I. to the markets to find statistically sound trading opportunities. We refer to this as a “double confirmation” setup and look for the predictive blue line to slope higher and to be confirmed by the NeuralNet at the bottom of the chart.
Traders look for confirmation on the NeuralNet to position themselves LONG or SHORT in the market. In other words, when the A.I. forecast is green, and The Neural Net is green, that presents a statistically sound buying opportunity.
The inverse is also true, when the A.I. forecast is red and the Neural Net is red, that is a SELLING opportunity. The arrows on the chart above highlight the areas where the “double confirmation setup occurred.”
Power Traders have had multiple opportunities to exploit nice gains in $RRC by monitoring the artificial intelligence forecasts.
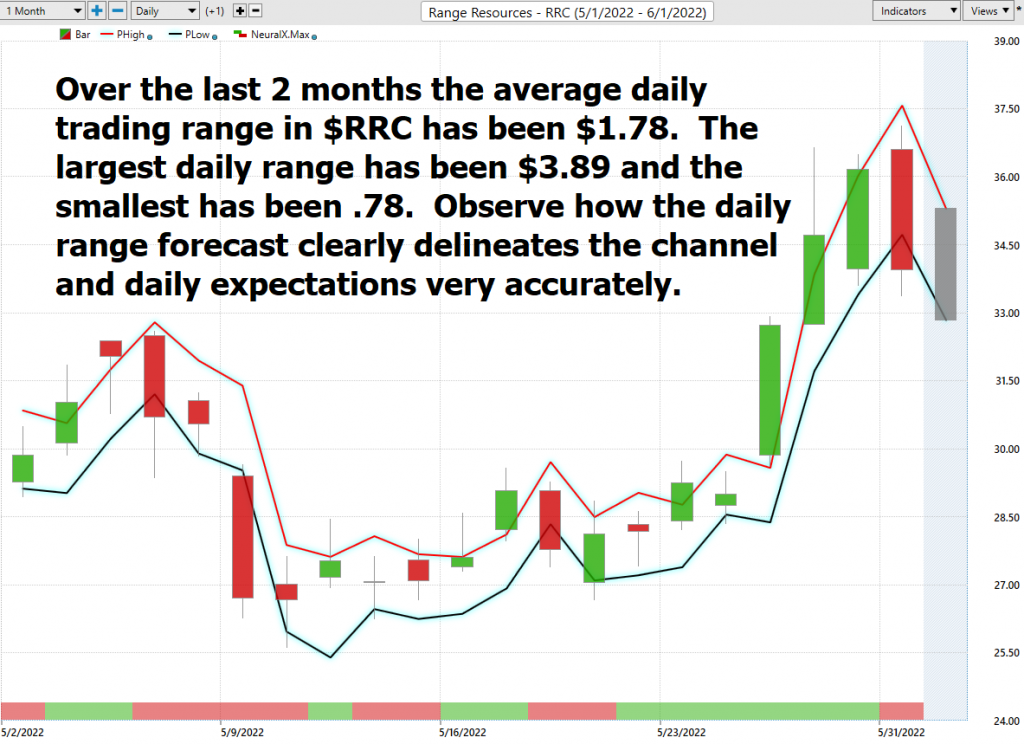
Daily Range Forecast – Fine Tuning Entries and Exits
One of the powerful features in the Vantagepoint A.I. Software which Power Traders use daily is the Price Range prediction forecast.
This forecast is what permits Power Traders to truly fine tune their entries and exits into the market.
At 6:30pm ET, after the market close the software updates and all of the price predictions change based upon what the machine learning, A.I., neural networks, and intermarket analysis anticipate moving forward.
Zoom in on the last two months of price action and you can see for yourself how the A.I. and machine learning combine to create a very accurate daily price range forecast that keep traders focused on optimal trade placement.
This is how a.i., machine learning and neural networks keep traders on the right side of the right trend at the right time.
Power Traders use a price level below the predictive low price to place their protective sell stops in the market in case a sudden reversal was to occur. Observe how the predictive price low also provided numerous short term entry opportunities for traders to buy $RRC as it was trending higher.
Intermarket Analysis
We live in a global marketplace. Everything is interconnected. The billion-dollar question for traders is always what are the key drivers of price for the underlying asset that I am trading?
Whenever traders trade $RRC they need to know what are the stocks key drivers?
As we have reported in this analysis, $RRC is heavily correlated to Natural Gas and Crude Oil prices. But it is also 74% correlated to the trend of the broader stock market.
Slight changes in Interest rates, Crude Oil Prices, and the Volatility of the dollar amongst thousands of other variables affect the decisions companies must make to survive in these challenging times. Trying to determine what these factors are is one of the huge problems facing investors and traders.
There is excellent value to be had in studying and understanding the key drivers of $RRC price action. universe and the most statistically correlated assets. These factors are all displayed from a standpoint of statistical correlations which show the strongest interconnectedness of prices.
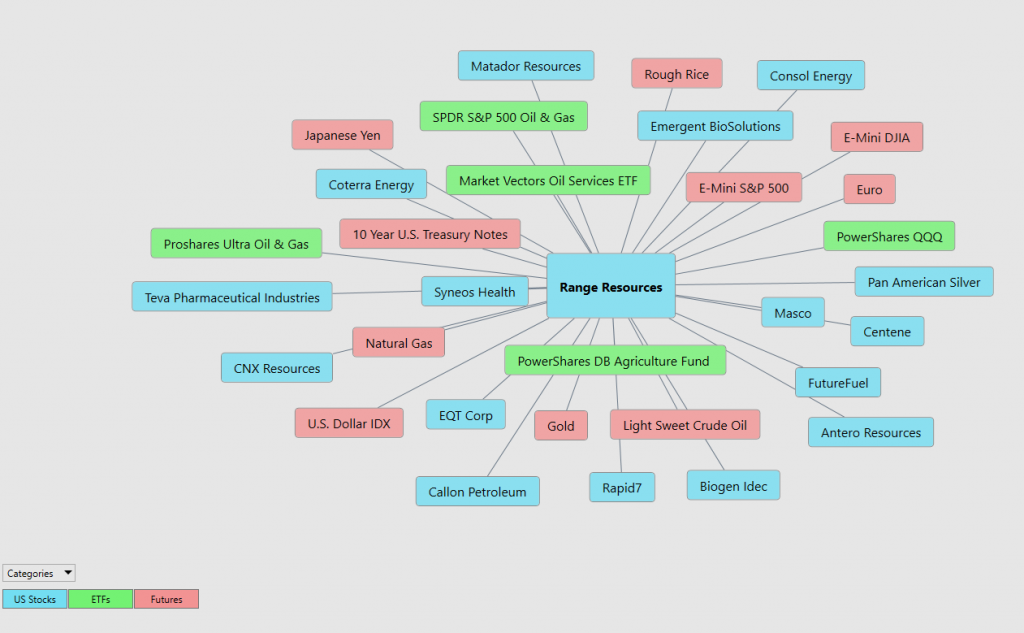
Instead of watching the financial media the Vantagepoint Software provides the 31 key drivers of price. This patented technology allows traders to discover other opportunities that in the financial marketplace that you would otherwise be oblivious to.
The intermarkets also locate markets that are inversely correlated which means that as $RRC moves higher the inversely correlated markets will move lower. These hidden gems are priceless in that traders locate solid downtrends that are just as easily exploited. In looking over the intermarkets you will find several Crude Oil Petroleum resource stocks which have recently been decimated
You can quickly see that one of the reasons why $RRC has been so strong lately is that it is very highly correlated in price to the Energy Sector, Natural Gas, Gold, and the U.S. Dollar. This graphic is worth studying any time you are considering making a trade or investment. Within these price correlations is the “real narrative” of what is driving price.
Our Suggestion
We like $RRC.
Why? A picture paints a thousand words.

We like the idea of finding scaling opportunities in small positions in $RRC on small pullbacks. This trend and momentum is firmly UP and looks like it can go significantly higher.
The narrative in $RRC is explosive. The Earnings call on July 25th will likely add more positive news to the already strong narrative.
There are only a handful of sectors and stocks that are maintaining value in the currently stagflationary environment. The ag sector and fertilizer sectors will most likely be amongst the most active sectors during the second quarter of 2022.
Our recommendation is to follow the A.I. trend analysis as outlined in this stock study and practice good money management on all trades.
We will re-evaluate based upon:
- New Wall Street Analysts’ Estimates
- New 52-week high and low boundaries
- Vantagepoint A.I. Forecast (Predictive Blue Line)
- Neural Network Forecast
- Daily Range Forecast
Let’s Be Careful Out There!
Remember, It’s Not Magic.
It’s Machine Learning.
Disclaimer: THERE IS A HIGH DEGREE OF RISK INVOLVED IN TRADING. IT IS NOT PRUDENT OR ADVISABLE TO MAKE TRADING DECISIONS THAT ARE BEYOND YOUR FINANCIAL MEANS OR INVOLVE TRADING CAPITAL THAT YOU ARE NOT WILLING AND CAPABLE OF LOSING.
VANTAGEPOINT’S MARKETING CAMPAIGNS, OF ANY KIND, DO NOT CONSTITUTE TRADING ADVICE OR AN ENDORSEMENT OR RECOMMENDATION BY VANTAGEPOINT AI OR ANY ASSOCIATED AFFILIATES OF ANY TRADING METHODS, PROGRAMS, SYSTEMS OR ROUTINES. VANTAGEPOINT’S PERSONNEL ARE NOT LICENSED BROKERS OR ADVISORS AND DO NOT OFFER TRADING ADVICE.


