


| This week’s stock analysis is Smith and Wesson Brands ($SWBI) |
.
Let’s talk about a company that’s been a household name for well over a century – Smith & Wesson Brands, Inc., trading under the ticker symbol $SWBI. This here is a quintessential American firearms manufacturer, but it’s more than just guns. Let’s dive into the brass tacks:
Now, when you hear Smith & Wesson, you think guns, right? Absolutely. They make their bread and butter by crafting and selling firearms. We’re talking handguns, rifles, and shotguns, catering to both regular folks like you and me, as well as our law enforcement and military heroes. They’ve also got a whole array of firearm accessories, ammo, and all sorts of related gear.
Smith & Wesson was born in 1852, and it was Horace Smith and Daniel B. Wesson who brought this legend to life. These guys are responsible for some of the most iconic firearms in American history.
Originally, they called Springfield, Massachusetts home, but recently, they’ve packed their bags and moved their headquarters to Maryville, Tennessee. The move of their headquarters was spurred on by moving towards a more firearm friendly state.
Smith & Wesson has about 2,300 employees on its payroll. They’ve got a global reach, but the U.S. is where they do most of their business. They’ve got a network of dealers, distributors, and they even sell directly to consumers and law enforcement agencies. Now, they’re not just relying on their name; they’re diversifying into areas like firearm safety and training.
In the ring with them are some fierce competitors, names like Sturm, Ruger & Co., Inc. and O.F. Mossberg & Sons, Inc.
The big opportunity here is the demand for firearms and related gear. That demand dances to the tune of gun ownership trends, regulatory changes, and concerns about personal safety.
But hold your horses, because in this business, there’s always some clouds on the horizon. The firearms industry’s always under a microscope, with those annoying regulatory changes looming over it. And public sentiment? Well, that can impact sales and reputation quicker than you can say “bang.”
When it comes to what they make, handguns have been the golden goose for Smith & Wesson. They’ve got a variety of models for self-defense, sports, and professional use.
Now, where does Wall Street stand on these folks? Traditionally, they’ve seen Smith & Wesson as a leader in the firearms industry. They’ve got history, a name that rings out, and a reputation for quality. But remember, this industry’s no cakewalk; it’s a tough game.
So, to wrap it up, Smith & Wesson Brands, Inc. is a testament to American craftsmanship and innovation in the firearms world. They operate in a controversial, highly regulated sector, but they’ve kept their flag flying high with quality, safety, and customer satisfaction. They’ve adapted to the shifting sands of the firearms industry while honoring their deep-rooted history. So, for anyone looking to understand this company, remember their commitment to firearm safety and training and their ability to roll with the punches in this ever-changing landscape.
In this weekly stock study, we will look at and analyze the following indicators and metrics as are our guidelines which dictate our behavior in deciding whether to buy, sell, or stand aside on a particular stock.
- Wall Street Analysts’ Estimates
- 52-week high and low boundaries
- Best Case – Worst Case Analysis and Takeaways
- Vantagepoint A.I. Forecast (Predictive Blue Line)
- Neural Network Forecast
- Bollinger Band Analysis
- Intermarket Analysis
- Our trading suggestion
We don’t base our trading decisions on things like earnings or fundamental cash flow valuations. However, we do look at them to better understand the financial landscape that a company is operating under.
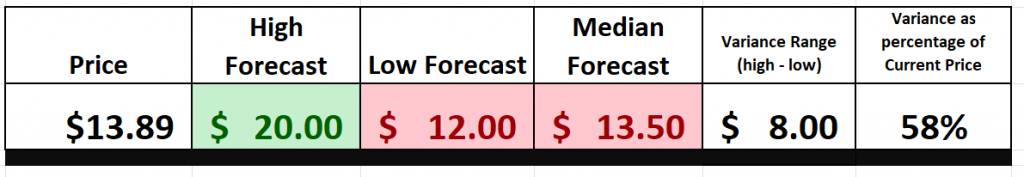
Wall Street Analysts’ Estimates
The 3 analysts offering 12-month price forecasts for Smith & Wesson Brands Inc have a median target of 13.50, with a high estimate of 20.00 and a low estimate of 12.00. The median estimate represents a -2.81% decrease from the last price of 13.89.
52-Week High and Low Boundaries
Looking at the Long-Term chart of $SWBI provides us with the 52-week high and low boundaries. Over the past year $SWBI has traded as high as $14.19 and as low as $8.20. The annual trading range has been $5.99. When we divide the annual range into the current price, we can determine the annualized statistical volatility. Currently, the annualized statistical volatility on $SWBI is 48%. This tells us that it would be completely normal to see $SWBI trade 43.6% higher and or lower over the next 12 months.
When we talk about the stock market, one of the most critical metrics we often discuss is the 52-week range. It’s not just a number; it’s a barometer of value, a measure of how the market has perceived a stock’s worth over the past year. Currently $SWBI is trading at the 92nd percentile of its annual trading range.
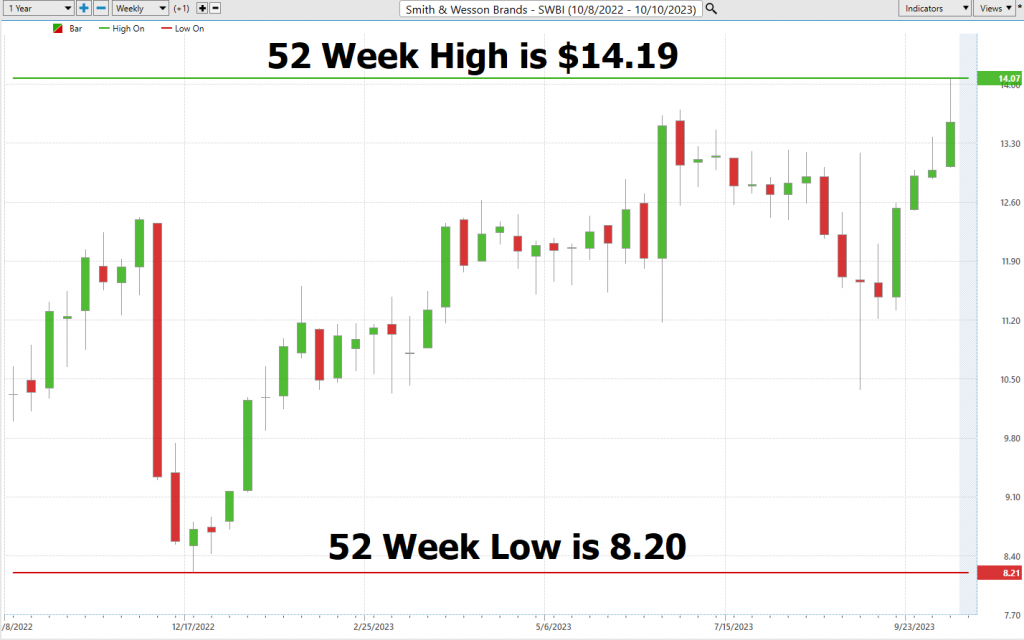
What does that tell you? It’s knocking on the door of its 52-week high boundary yet again. It’s like a racehorse pushing its limits on the final stretch.
And let’s not forget, these 52-week high and low boundaries aren’t just numbers on a chart. They’re the pulse of the market, the heartbeat of investor sentiment. When a stock is dancing near its 52-week high, it’s like a siren song of bullish momentum. Conversely, when it’s lurking near its 52-week low, it’s a cautionary tale of bearish sentiment.
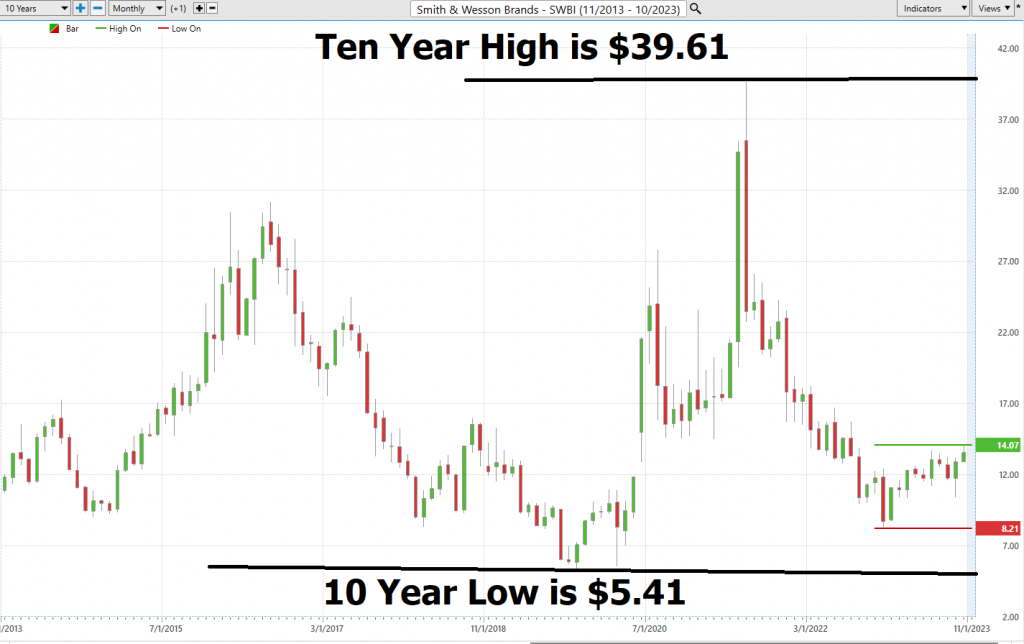
If you pull up the longer-term chart of $SWBI, you’ll witness a roller-coaster of a journey, a testament to its volatility and the dynamic nature of the market. Always remember, folks, understanding these boundaries isn’t just about numbers; it’s about reading the story of a stock’s journey in the grand tapestry of the market.
It is important for traders to understand the annualized statistical volatility of a stock, as this concept serves as an essential tool that helps measure and anticipate future market movements. The higher the annualized statistical volatility for a stock, the more volatile it will be, indicating more potential movement up or down. A trader should not solely rely on this number when assessing a stock’s performance as there are many factors to consider; however, understanding annualized statistical volatility can provide valuable insight into a stock’s performance trajectory, past and present.
Best Case – Worst Case Scenario
When we step into the world of trading, it’s much like stepping onto a battlefield. And just as a general wouldn’t go into battle without a strategy, neither should a trader or investor. One of the most invaluable strategies in our arsenal is best-case and worst-case analysis. Think of it as looking through two different binoculars, each showing you a different terrain of the same landscape.
Now, why is this so crucial? Well, by examining both the sunny skies and the stormy weather scenarios, you arm yourself with a 360-degree view of a stock’s potential. It’s not just about the blue skies and the potential gains; it’s equally about those storm clouds and the risks lurking on the horizon. This dual-lens approach is the bedrock of understanding the volatility of an asset. It’s like having a compass in the unpredictable seas of the stock market.
By gauging both the potential windfalls and pitfalls, you’re not just flying blind; you’re navigating with purpose. It allows you to measure your exposure, to know when to hold tight and when to adjust your sails. It’s about evaluating the true worth of a stock, not just its glittering promise.
In the grand scheme of things, this isn’t just a method; it’s a philosophy. It’s about weighing the scales of risk against reward, ensuring your trading portfolio is not just built for today but is strategically aligned for long-term financial success. The endgame? To see how the stock’s peaks measure against its valleys, to ensure you’re not just riding the waves but mastering them. Always remember, folks, in the world of trading, knowledge isn’t just power; it’s your compass to prosperity.
First, we do the Best-Case analysis:
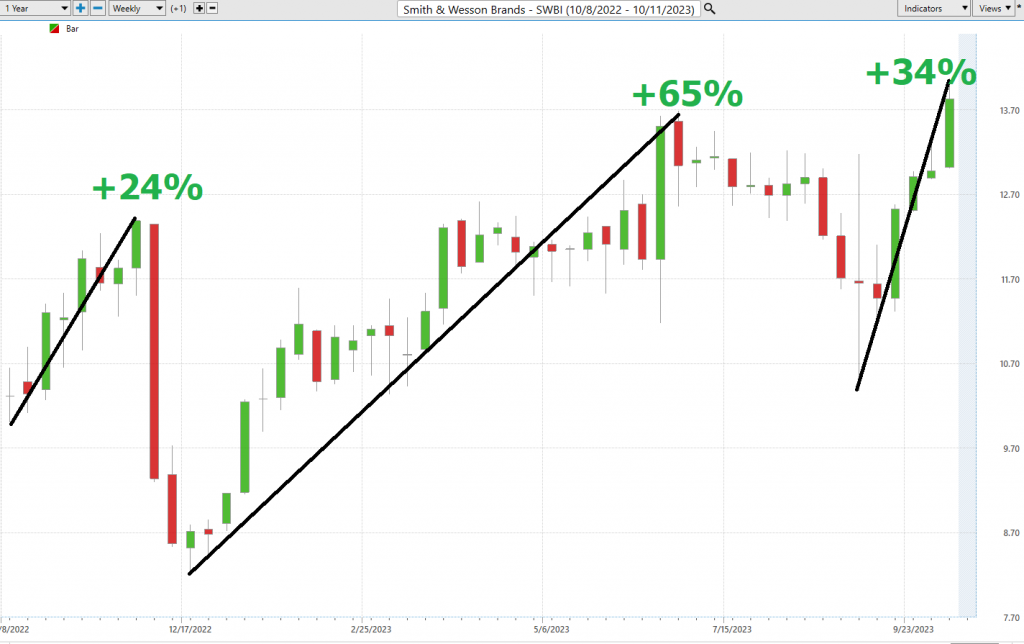
Followed by the WORST-CASE Analysis:
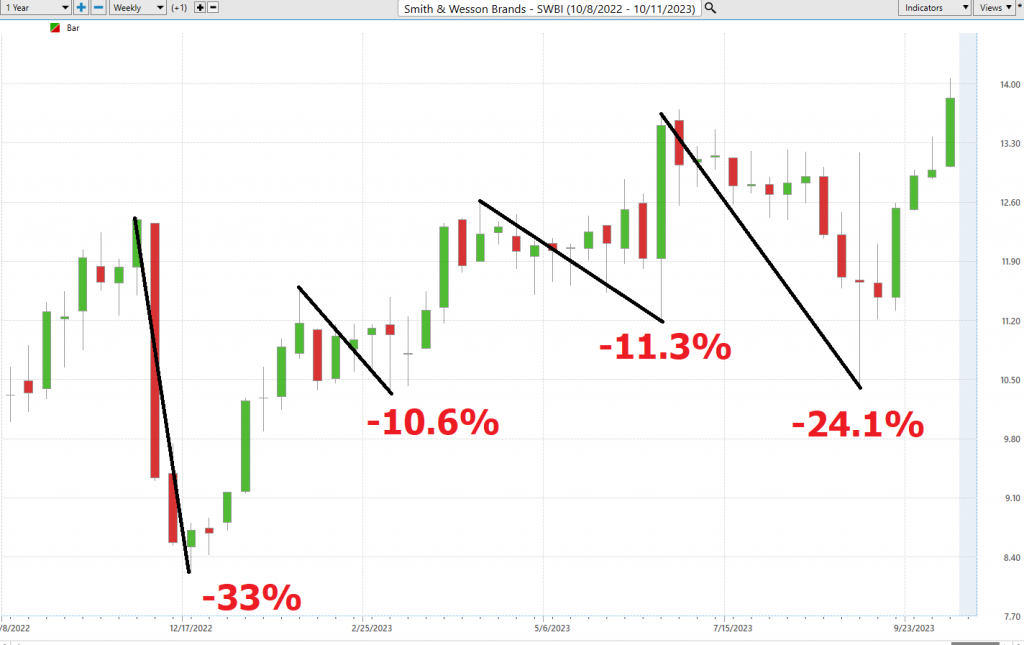
This initial analysis lets us see how quickly $SWBI falls in comparison to its rallies.
Next, we want to compare the performance of $SWBI to the major broad market indexes.
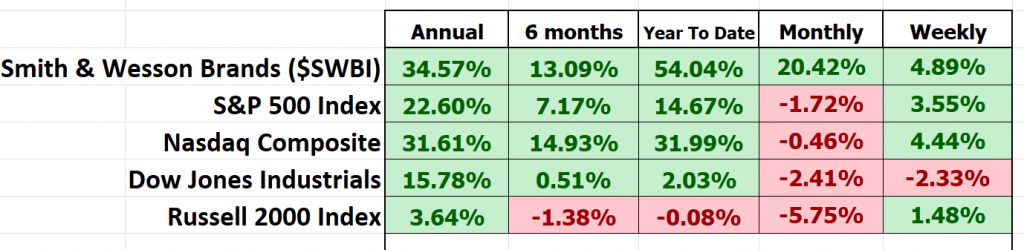
Smith & Wesson Brands Inc., ticker symbol $SWBI, has been a standout performer, consistently outshining the broader market indices across various time frames. Its stellar performance warrants a closer look, particularly in terms of volatility and its comparison with market heavyweights. In the world of traders, this is often encapsulated by a metric known as “BETA.”
Beta (β) serves as the Richter scale of the stock universe, providing insight into how much a stock shakes and rattles in response to the broader market’s movements, typically benchmarked against a major index like the S&P 500. In simpler terms, beta quantifies a stock’s sensitivity to the market’s ebbs and flows.
Let’s delve into the nuances of beta, a critical gauge for deciphering a stock’s relationship with the broader market. Here’s the breakdown:
– **Beta = 1:** When a stock boasts a beta of 1, it signifies that its price movements closely mirror those of the overall market. If the market experiences a 5% surge, a stock with a beta of 1 should follow suit with a 5% increase.
– **Beta > 1:** Visualize this as the stock market’s exhilarating rollercoaster. A beta exceeding 1, say 1.5, suggests that the stock is 50% more volatile than the market itself. When the market enjoys a 5% ascent, this high-beta stock might embark on a heart-pounding 7.5% climb (or descent, for that matter).
– **Beta < 1:** Now, here’s where stability comes into play. A beta below 1, such as 0.5, implies that the stock is only half as volatile as the market. In a 5% market upswing, this stock might experience a more measured 2.5% rise.
Now, let’s apply this wisdom to $SWBI, Smith & Wesson Brands Inc. Over a 5-year horizon, $SWBI exhibits a beta of 0.5. It’s crucial to note that beta is rooted in historical data and doesn’t necessarily foretell future performance. High beta doesn’t guarantee high returns; instead, it underscores the stock’s inclination for price fluctuations, signaling a heightened level of risk.
Investors turn to beta as a risk assessment tool, helping them construct portfolios aligned with their risk tolerance and investment objectives. So, when we scrutinize $SWBI, we encounter an asset that undeniably exhibits significantly more volatility than the broader stock market indices. It’s akin to a high-octane ride, offering both the promise of tremendous opportunity and the specter of heightened risk.
The unique thing about $SWBI is that it has had a beta of .5 and it has massively outperformed the broader stock indexes.
Vantagepoint A.I. Predictive Blue Line Forecast
The guidelines we abide by are as follows:
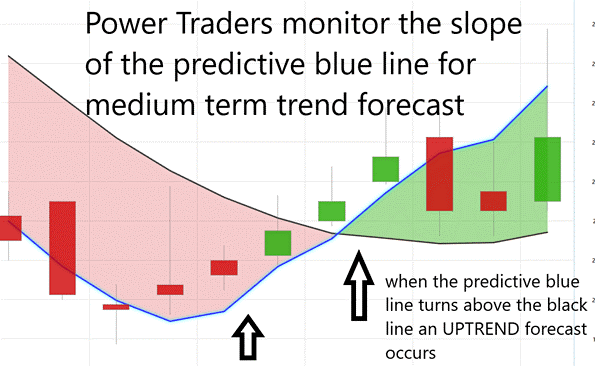
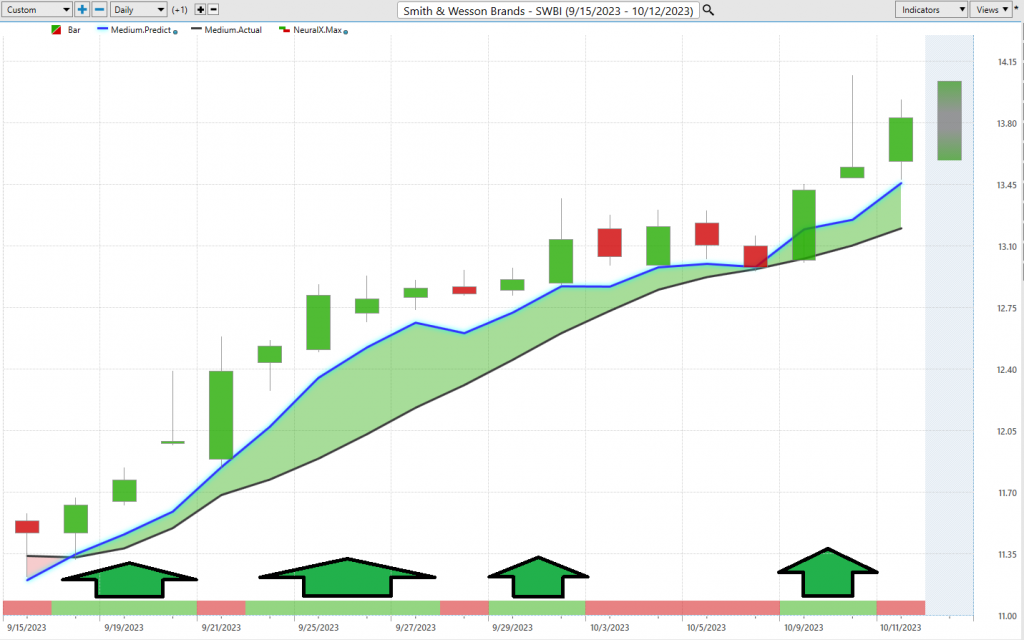
- The slope of the predictive blue line determines the trend forecast and general direction of $SWBI
- Ideally, the VALUE ZONE is determined to try and find buy opportunities at or below the predictive blue line, or to sell opportunities above the predictive blue line during a downtrend.
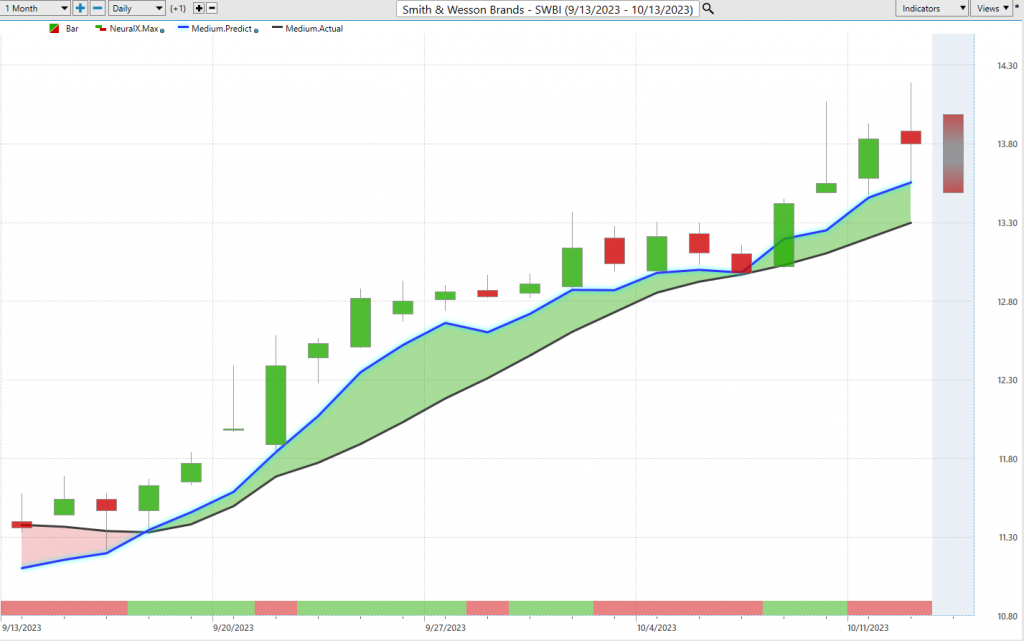
The blue line ALWAYS determines the forecast and the best move forward. When we talk about the innovative world of trading, VantagePoint Software truly stands out with its remarkable artificial intelligence capabilities. It’s like having a crystal ball, giving traders a sneak peek into trend forecasts, all thanks to the monitoring of that pivotal predictive blue line.
Now, you might be wondering about the black line. It might seem simple, but it’s essentially our rearview mirror, a 10-day moving average of prices, showing us the market’s recent history.
But let’s shift our focus to the star of the show: the predictive blue line. This isn’t just any ordinary line. It’s the sweet spot, the value zone where astute traders in an uptrend look to snap up assets at or just below this defining blue marker. And the secret sauce behind this blue line? It’s all thanks to VantagePoint’s groundbreaking technology, a symphony of artificial intelligence, neural networks, and intermarket analysis, all working seamlessly to pave the way forward.
As you dive into the chart, I want you to focus on the delicate tango between the black line and the predictive blue line. This blue line isn’t based on mere guesswork. It’s the result of VantagePoint’s state-of-the-art neural network and intermarket analysis, meticulously analyzing the most influential price drivers of an asset. It’s about harnessing the power of AI and data correlations to understand an asset’s intrinsic value.
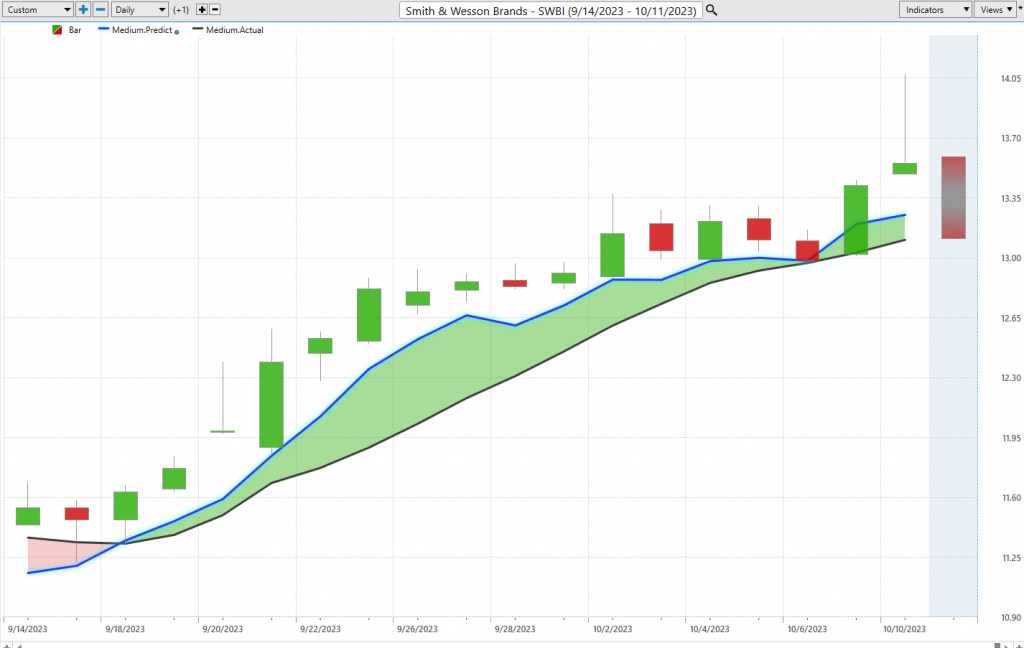
And here’s a golden nugget for all you traders out there: when that predictive blue line ascends above the black line, it’s like the market’s way of waving a green flag, signaling an UP-entry opportunity. So, always be on the lookout, stay informed, and most importantly, stay ahead of the curve!
Neural Network Indicator (Machine Learning)
At the bottom of the chart is the Neural Network Indicator which predicts future short-term strength and/or weakness in the market. When the Neural Net Indicator is green it communicates strength. When the Neural Net is Red it is forecasting short term weakness in the market. When it is yellow it is anticipating sideways prices.
A Neural Net is a computational learning system that uses a network of functions to understand and translate massive amounts of data into a desired output, consistently monitoring itself and improving its performance.
This Neural Network, powered by innovative AI, acts as a brilliant artificial mind in your trading toolkit. It sifts through vast data, offering precise predictions. Continuously evolving, it dives deep into market intricacies, from technical nuances to global events. Its speed is unmatched, drawing connections between diverse market factors, like correlating oil price shifts with unexpected stock index movements.
For trading success, confirmation is crucial. Astute Power Traders cross-reference the predictive blue line with the Neural Network Indicator. When both point in the same direction, it’s a clear market signal. But if both hint at caution, it’s wise to reconsider.
In essence, Neural Networks are the future of trading, revealing insights beyond traditional methods. For Power Traders, the combination of the Neural Network and A.I. forecast is invaluable. When both align, it’s a green light. But if they diverge, caution is advised. In trading, always double-check; it’s the cornerstone of success.
We advocate that Power Traders cross reference the chart with the predictive blue line and neural network indicator to create optimal entry and exit points.
For the serious trader, neural networks are a next-generation trading tool that can detect subtle non-linear interdependencies and patterns that traditional methods of technical analysis are unable to uncover.
Traders look for confirmation on Neural Net to position themselves LONG or SHORT in the market. In other words, when the A.I. forecast is green, and the Neural Net is green, that presents a buying opportunity.
Power Traders are always looking to apply both the Neural Network and A.I. to the markets to find statistically sound trading opportunities.
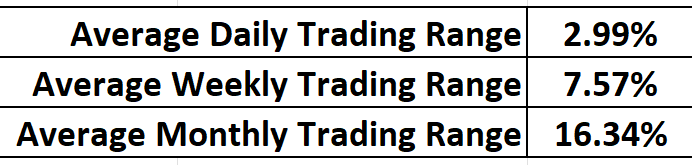
Daily Range Forecast & Analysis
For the elite Power Traders who’ve anchored their faith in VantagePoint Software, there’s one feature they consult with unwavering regularity: the Vantagepoint Daily Price Range forecast. It’s as though this instrument has morphed into their financial North Star, illuminating the often-murky waters of market maneuvers.
Let’s delve into the average trading range metrics for $SWBI over the past year, spanning daily, weekly, and monthly intervals.
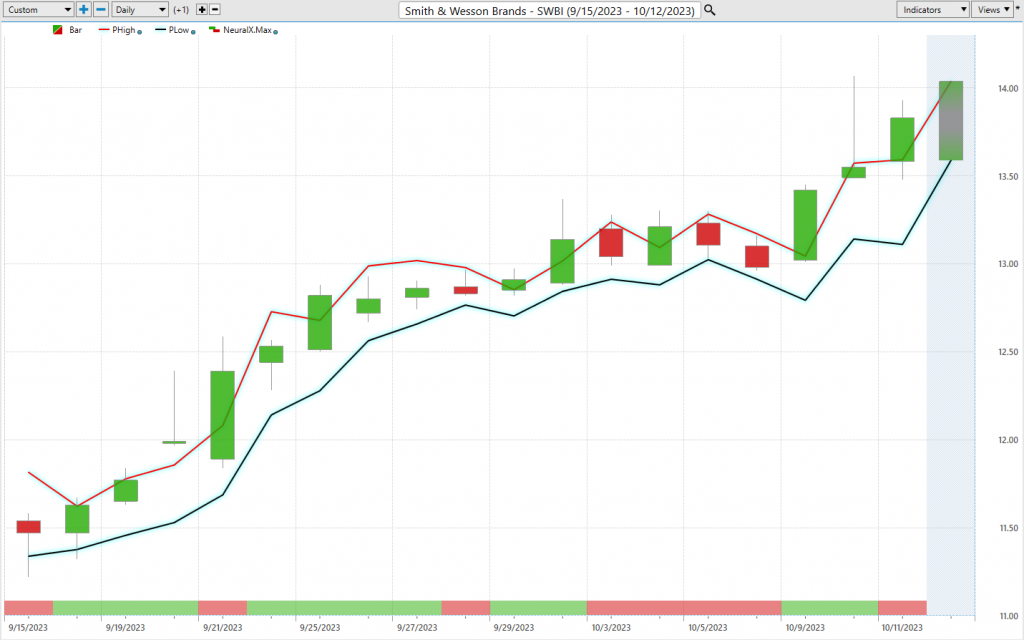
Now, every trader grapples with this daily conundrum – and believe me, it’s a profound one – discerning those precise junctures to stake their claim in the market. Yet, with the prowess of VantagePoint’s A.I. and the Daily Price Range Forecast, it feels akin to having a market sage discreetly dispensing invaluable counsel.
Now, introduce the VantagePoint A.I.’s daily range forecast into the mix. Picture having a subtle hint, a gentle prod, forecasting the market’s next move. By seizing opportunities at the forecast’s lower spectrum and strategizing exits at its zenith, traders can potentially steer the odds in their favor, all the while maintaining a firm grip on risk.
But here’s a crucial point to ponder: the stock market’s daily valuation isn’t solely influenced by corporate maneuvers or financial disclosures. Factors as diverse as a fleeting tweet to global upheavals can tilt the balance. Thus, predicting market movements? It’s a sophisticated art. Yet, VantagePoint A.I. appears to have carved a niche, harmoniously melding A.I., neural ingenuity, and machine learning in the quest for that impeccable prediction.
The essence of triumphant trading hinges on discerning that impeccable timing for market entry and exit. VantagePoint doesn’t merely assist in identifying that pivotal moment; it achieves it with astounding acuity. The Daily Range forecast undergoes daily updates, offering a lens into potential price trajectories. It’s akin to having a seasoned market guru imparting time-tested insights.
Now, cast your eyes on that chart. It’s more than mere aesthetic curves; it’s a roadmap for strategic stop placements and risk management. Observe the infrequency with which prices dip below that pronounced dark line? It’s a clear indicator, suggesting the optimal zone for buy stop placements, ensuring risks remain well-calibrated.
$SWBI offers plenty of opportunity, but this asset is risky for traders that are unaware of how to harness volatility.
Intermarket Analysis
Power lies in the way we respond to the truth we understand.
Imagine the world of trading and investments is like a giant puzzle. You want to figure out why the prices of things like stocks, oil, and currencies go up and down. But it’s not just about headlines or stories you hear on the news; those are like exciting stories in a book.
What we need to do is play detective and find out what’s really causing these price changes. That’s where something called “intermarket analysis” comes in. It’s like looking at clues in different places to solve the mystery.
See, our world is like one big web, where everything is connected. Intermarket analysis helps smart traders and investors by looking at how different things, like stocks, oil, and the value of money, are related to each other. By doing this, they can predict what might happen in the future with prices and make better decisions.
Imagine you have a bunch of strings, and when you pull one, the others move too. That’s kind of how it works. If you know how these strings are connected, you can make predictions and adjust your plans to make more money.
So, in simple terms, intermarket analysis helps us understand why prices change and how different things in the world are connected to each other, like a big, complex puzzle. It’s like being a financial detective to make smarter choices in the world of trading and investing.
The real power lies in our response to the truth we understand. When it comes to trading, it’s not enough to be captivated by headlines or mesmerized by stories in the financial news. We need to dig deeper, my friends. We need to understand what’s truly driving the prices of assets in this global marketplace.
That’s where intermarket analysis comes into play. It’s like the financial Sherlock Holmes of our time. It looks at how different things in the world of money, like stocks, oil, and currencies, are connected. You see, everything in finance is intertwined, and knowing those connections can make all the difference.
Think of it this way: if you know that when one domino falls, it affects the others, you can predict the domino effect. That’s what intermarket analysis does. It helps us see the bigger picture, how changes in one market can ripple through others, and how global events impact our investments.
So, my fellow traders and investors, don’t rely on fear-inducing talking heads in the media. Base your decisions on facts, on understanding these connections. Intermarket analysis isn’t just a tool; it’s your secret weapon to stay ahead in this ever-changing financial world. Remember, you have a choice – follow the noise, or follow the facts.
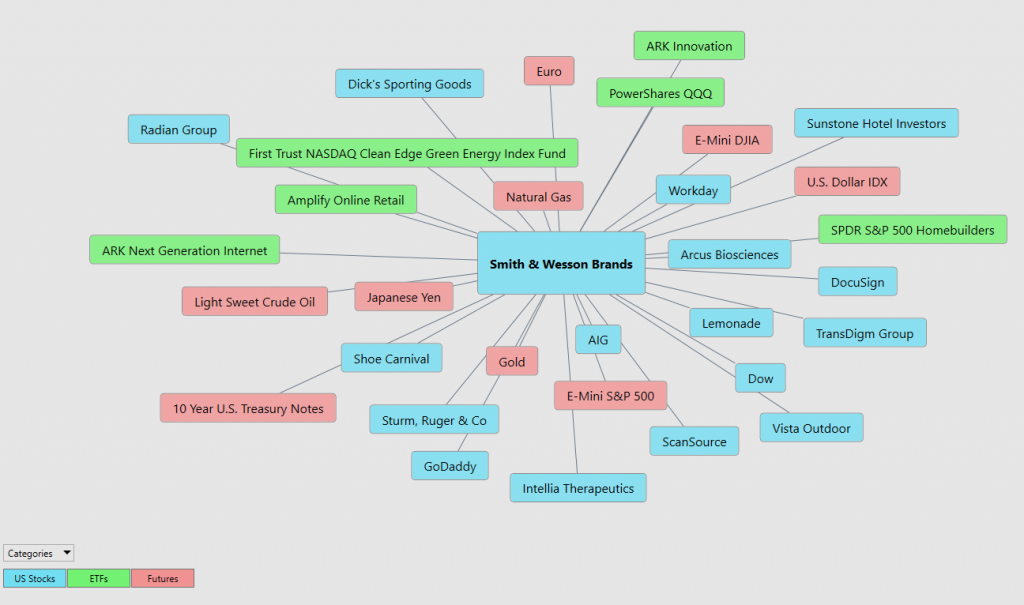
Within the following Intermarket Analysis graphic, you will see the 31 markets that are the key drivers to $SWBI’s price.
There is great value to be had in studying and understanding the key drivers of $SWBI’s price action. This graphic provides a microcosmic view of what factors have been driving $SWBI’s higher. You will find a handful of biotech and pharmaceutical ETF’s whose price action is very statistically correlated to $SWBI.
Our Suggestion
Traders, take note: $SWBI deserves a prime spot on your trading opportunity radar for the upcoming year. Here’s a quick rundown of why:
1. **Share Buyback**: $SWBI’s management is set to repurchase $50 million of its shares.
2. **Undervalued**: The stock is trading significantly below the Wall Street consensus of its fair value pegged at $20.00.
3. **Earnings Growth**: Expectations are set for a 13.43% annual growth in earnings.
4. **Dividend**: A robust dividend yield of 3.48% is on offer.
5. **Profit Margins**: While current profit margins stand at 7.2%, it’s a dip from last year’s 17.9%.
6. **Potential Buying Surge**: Anticipate a surge in buying interest as the stock pulls back from its current 52-week highs.
7. **Industry Leadership**: With a robust balance sheet, $SWBI stands tall as an industry frontrunner.
In summary, $SWBI presents a compelling case for trading opportunities in the coming year. Keep it firmly on your watchlist.
Our recommendation is to follow the A.I. trend analysis as outlined in this stock study and practice good money management on all trades.
We will re-evaluate daily based upon:
- New Wall Street Analysts’ Estimates
- New 52-week high and low boundaries
- Vantagepoint A.I. Forecast (Predictive Blue Line)
- Neural Network Forecast
- Daily Range Forecast
The trend in $SWBI is UP. We will look to the bottom of the daily range forecast to position ourselves LONG with tight stops for short-term trades.
Let’s Be Careful Out There!
It’s Not Magic.
It’s Machine Learning.
Disclaimer: THERE IS A HIGH DEGREE OF RISK INVOLVED IN TRADING. IT IS NOT PRUDENT OR ADVISABLE TO MAKE TRADING DECISIONS THAT ARE BEYOND YOUR FINANCIAL MEANS OR INVOLVE TRADING CAPITAL THAT YOU ARE NOT WILLING AND CAPABLE OF LOSING.
VANTAGEPOINT’S MARKETING CAMPAIGNS, OF ANY KIND, DO NOT CONSTITUTE TRADING ADVICE OR AN ENDORSEMENT OR RECOMMENDATION BY VANTAGEPOINT AI OR ANY ASSOCIATED AFFILIATES OF ANY TRADING METHODS, PROGRAMS, SYSTEMS OR ROUTINES. VANTAGEPOINT’S PERSONNEL ARE NOT LICENSED BROKERS OR ADVISORS AND DO NOT OFFER TRADING ADVICE.


