


| This week’s a.i. Stock Spotlight is VISA ($V) |
Today we are going to talk and analyze a true titan in the world of finance and technology, Visa Inc. ($V). This is a story of resilience, innovation, and sheer financial prowess. In the face of global challenges, Visa has not just survived; it has thrived, showcasing the robustness of its business model and the unyielding demand for its services. Visa Inc. ($V), the global payment network has truly set the gold standard for electronic digital transactions.
Visa, founded back in 1958 as BankAmericard, had a vision – a vision to simplify and secure payments for consumers and businesses alike. Fast forward to today, and Visa Inc. stands as a towering presence, headquartered in Foster City, California, USA, with a global reach that’s nothing short of remarkable.
Now, what makes Visa such a powerhouse in the financial world? It’s all about revenue, and Visa knows how to bring it in. They’re not printing money, but they might as well be. For Fiscal year 2022 they generated $29.3 billion in revenue. Visa’s primary source of revenue comes from fees. Transaction processing fees, data processing fees, international transaction fees – you name it. Every time a Visa card is swiped or tapped; they’re getting a piece of the action.
But it’s not just about the money; it’s about the impact. Visa doesn’t issue credit cards or lend money. They’re the behind-the-scenes maestros, orchestrating seamless transactions for millions of people every day. They’re the bridge between consumers, businesses, banks, and financial institutions. They enable us to move money securely and efficiently across borders and currencies. That’s power, and a unique business model.
Now, let’s talk about competition. Visa doesn’t shy away from it. They’re in the ring with some formidable opponents – Mastercard, American Express, PayPal – these are the heavyweights they face. But Visa isn’t just holding its ground; it’s leading the charge. Its dominance in the global payment industry is undisputed. Visa’s brand is a symbol of trust and reliability, and that’s a currency worth more than dollars and cents.
But it’s not all smooth sailing. Visa, like any titan, faces its share of challenges. Regulatory changes, cybersecurity threats, and the ever-evolving landscape of fintech disruptors keep them on their toes. And let’s not forget the economic tides that can impact consumer spending and transaction volumes.
So, what’s next for Visa? The biggest opportunity lies in the continued growth of electronic payments. As the world embraces digital currencies and contactless payments, Visa is right there, leading the charge. Expanding into emerging markets where traditional banking is limited is another avenue for growth.
With innovation, trust, and a global reach that spans continents, Visa Inc. is the undisputed champion of electronic payments.
Let’s roll back the clock to 2020, a year that tested every fiber of the global economy. While many faltered, Visa, the payment network giant, navigated these turbulent waters with the skill of a seasoned captain. Despite a 4.92% dip in revenue, dropping to $21.846 billion due to the pandemic’s impact on travel and consumer spending, Visa demonstrated its foundational strength.
This is a story of unparalleled success, strategic foresight, and a global reach that leaves competitors trailing in its wake. Visa is accepted at over 100 million merchant locations worldwide. This isn’t just impressive; it’s a testament to Visa’s omnipresence in the global market. Whether you’re sipping coffee in Paris, shopping in Tokyo, or booking a safari in Kenya, Visa is there. It’s the financial passport that the world trusts.
But what truly sets Visa apart is its profitability. Visa operates with higher profit margins than its competitors, a feat achieved through its robust and efficient network. This network, built over years of strategic investment, now operates at a scale where each additional transaction adds to the profit margin with minimal incremental cost. It’s a model of efficiency that others can only aspire to.
Now, let’s talk about growth, particularly in cross-border transactions. As global travel rebounds and e-commerce continues to break barriers, Visa’s international revenue from these transactions is growing at an astonishing rate. This isn’t just recovery; it’s a sign of a company that’s perfectly positioned to capitalize on global economic trends.
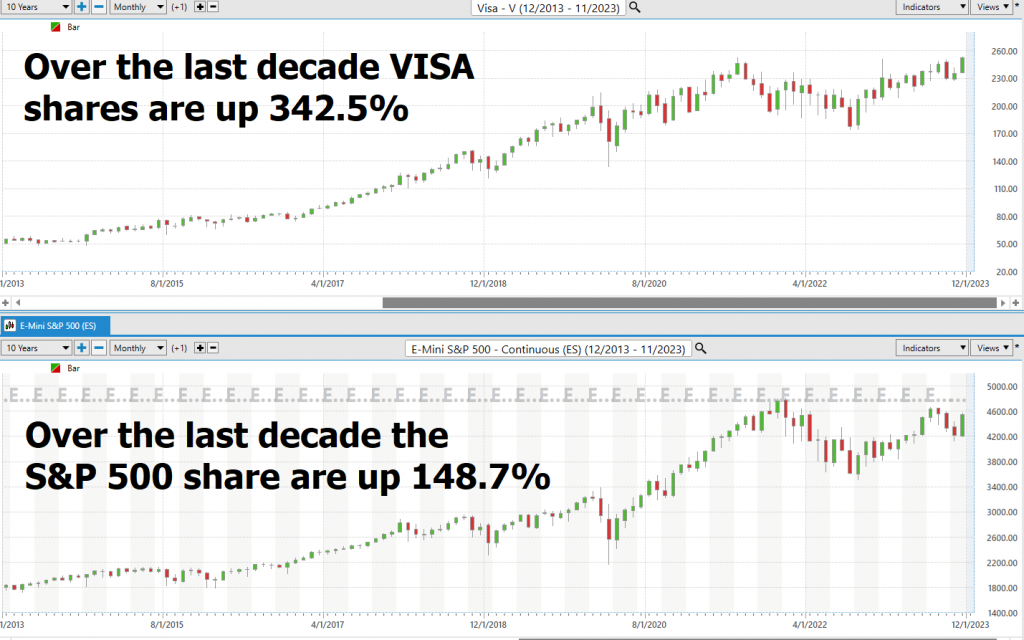
And the market has taken notice. Visa shares have not just performed well; they’ve crushed the market. Over the past decade, Visa’s shares have soared by 342.54%, a performance that dwarfs the S&P 500’s 148.7% gain. This isn’t just growth; it’s a relentless march towards market dominance.
But the most exciting part? Even with conservative estimates, Visa is on track to hit a $1 trillion market cap by 2030. Let’s run the numbers: Visa’s current market cap sits at around $506 billion. To reach that trillion-dollar mark, Visa would need to continue its revenue growth at an annualized rate of 10% over the next seven years. Given that Visa’s sales increased at a compound annual rate of 11% from 2012 to 2022, this target isn’t just achievable; it’s well within reach.
In the third quarter of the current fiscal year, Visa made $8.1 billion in revenue, up 12% year-over-year. The profits? A cool $4.2 billion. These numbers aren’t simply good; they’re a clear indicator of a company that’s firing on all cylinders.
So, what does this all mean? Visa isn’t just leading the payment processing world; it’s redefining it. With its global reach, unmatched efficiency, and strategic positioning, Visa is not just a company to watch; it’s a company to be part of. Visa’s performance is a clear indicator of its indispensable role in the global economy, a role that only seems to be growing with each passing year.
What also makes VISA an exciting trading opportunity is that as I write these words VISA is exhibiting all of the characteristics of growth. As you will see, VISA ($V) is currently simultaneously testing its 10-year highs and 52-week highs. This fact and reality all by itself is reason enough to put this company on your trading radar. Whenever we witness any asset that is making 10-year highs and 52 weeks high simultaneously it is a very clear picture that the company is growing and overcoming all obstacles related to growth.
So, when you think of Visa, think of resilience, think of innovation, and above all, think of a financial powerhouse that has proven repeatedly that it is not just surviving, but thriving in the ever-evolving world of global finance.
- Wall Street Analysts’ Estimates
- 52-week high and low boundaries
- Best Case – Worst Case Analysis
- Vantagepoint A.I. Forecast (Predictive Blue Line)
- Neural Network Forecast
- Daily Range Forecast
- Intermarket Analysis
- Our trading suggestion
We don’t base our trading decisions on things like earnings or fundamental cash flow valuations. However, we do look at them to better understand the financial landscape that a company is operating under.
Wall Street Analysts’ Estimates
Let’s turn our attention to the financial wizards, the market seers, the 33 top-tier analysts who have cast their gaze upon Visa Inc., a titan in the payment industry. These aren’t just any predictions; they’re a roadmap to the potential future of a company that’s been a beacon of success in the financial world.
Now, hold onto your hats, because these analysts have set a median target for Visa at a robust $276.95. That’s not just a number; it’s a statement, a testament to the confidence and belief in the growth potential of this financial juggernaut. But wait, there’s more. The high estimate rockets up to a staggering $295.00. Can you imagine? That’s the kind of bullish outlook that makes you sit up and take notice.
But let’s not forget the full picture here. There’s a low estimate too, coming in at $243.00. It’s a reminder that the market is a dynamic beast, full of twists and turns.
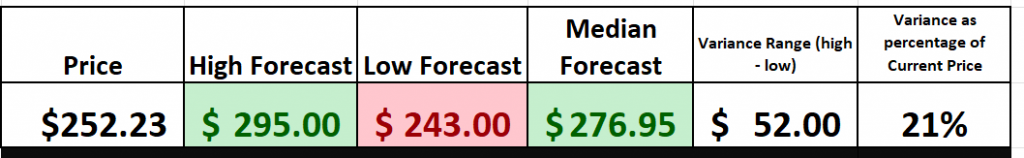
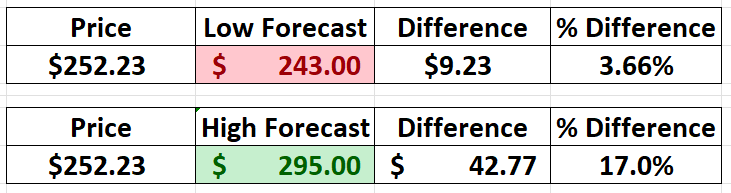
Now, here’s the kicker: the high estimate, this $295.00 figure we’re talking about, represents a +17% increase from Visa’s last price of $252.23. That’s right, a double-digit percentage increase. In the world of stocks and investments, that’s the kind of growth that makes investors’ hearts beat faster. And the low forecast of $243 would be a decline of 3.66%. This combination presents a very positive risk/reward profile.
So, what we’re seeing here is a clear signal from the market experts, a beacon of optimism for Visa Inc. It’s a company that’s not just riding the waves of the financial market; it’s making the waves. With such forecasts, Visa continues to stand as a pillar of strength and a symbol of growth in the ever-evolving financial sector.
We look at Wall Street Price forecasts primarily to see how much variance there is between the bullish and bearish forecasts. That variance is a valuable estimate that we can use to anticipate future volatility.
52-Week High and Low Boundaries
In the intricate dance of the financial markets, the 52-week high of a stock emerges as a pivotal player, a beacon in the fog of market fluctuations. For a stock like Visa ($V), understanding its performance relative to this high is not just insightful, it’s essential. It’s a narrative that unfolds on the charts, revealing the stock’s resilience and potential.
Now, consider this: the best stocks, those that truly stand out in the market, have a penchant for consistently setting new 52-week highs. It’s a counterintuitive truth, but in this paradox lies the heart of a successful investment strategy. To grasp the full story, one must delve into the long-term monthly and weekly charts. Here, in these broader strokes, the trend reveals itself, offering a window into the stock’s true trajectory.
For traders who have mastered the art of the market, these longer-term monthly charts are not just tools; they are the compass by which they navigate the tumultuous seas of trading. It’s here that the trend analysis takes shape, offering a glimpse into the future based on the echoes of the past.
The 52-week high, often seen as a formidable resistance, can transform into a launchpad for a stock’s price. Once breached, it’s common to witness the stock price catapulting higher in a short span, a phenomenon that captures the essence of market dynamics.
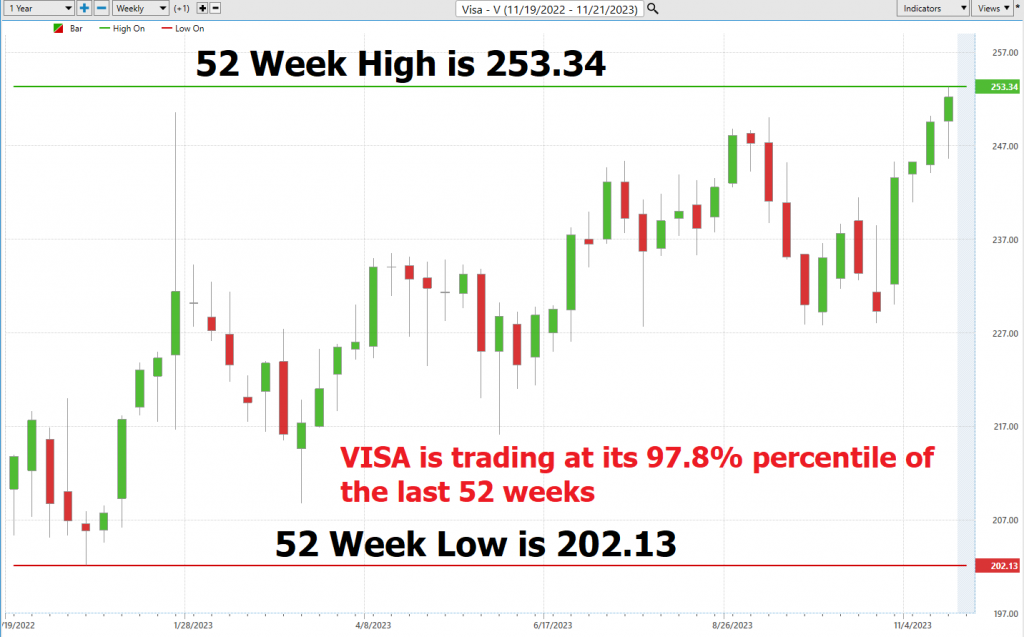
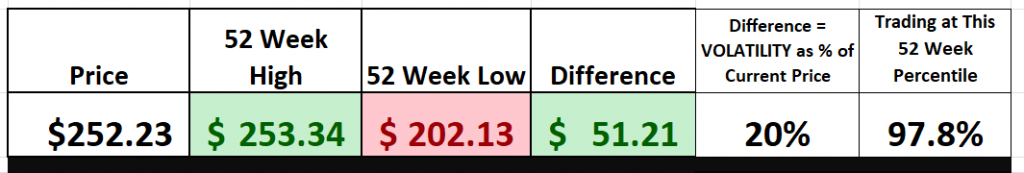
In the case of Visa, the past 52 weeks have seen its stock price oscillating between a high of $253.34 and a low of $202.13, a range that speaks volumes about its volatility and potential. By dissecting this range – a $51.21 swing – and juxtaposing it against the current price of $252.23, we unveil a volatility measure of around 20%. This metric isn’t just a number; it’s a narrative, telling us that a 20% swing in either direction from its current price is well within the realm of normalcy for Visa over the coming year.
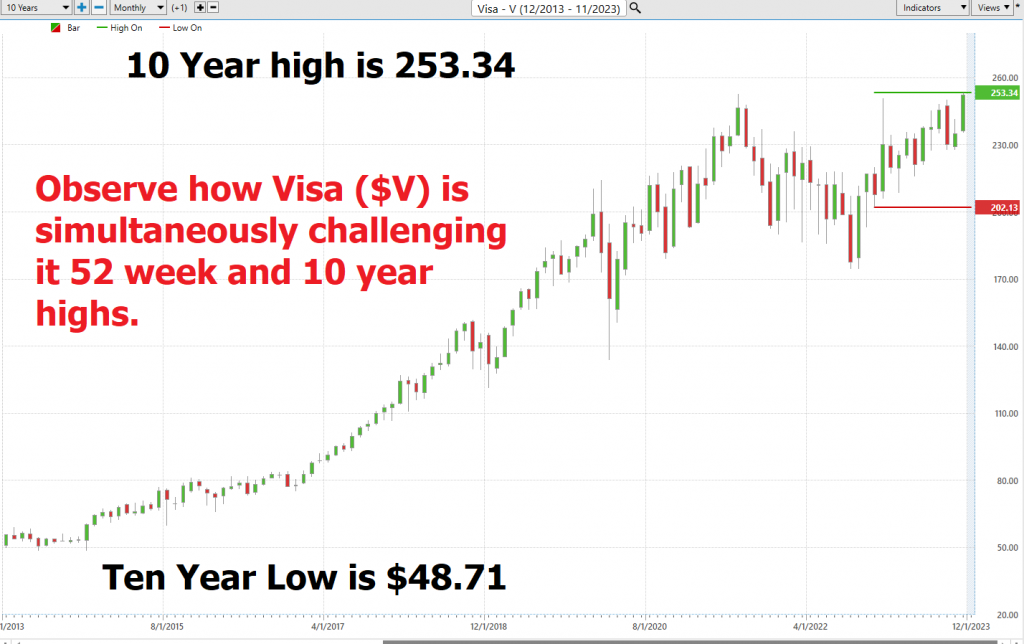
But to truly appreciate the journey of Visa’s stock, one must step back and absorb the grandeur of its 10-year chart. This is where the story of Visa transforms from a tale of yearly fluctuations to a saga of growth, a testament to its standing as a powerhouse in the growth stock arena. It’s a chart that doesn’t just show numbers; it tells the story of a stock that has navigated the complexities of the market with grace and strength.
Best Case – Worst Case Scenario
Let’s talk about trading volatility. Do you want to understand what’s really happening in the market? Look no further than a price chart. It’s like a rollercoaster map of Wall Street, showing you every twist and turn in vivid detail.
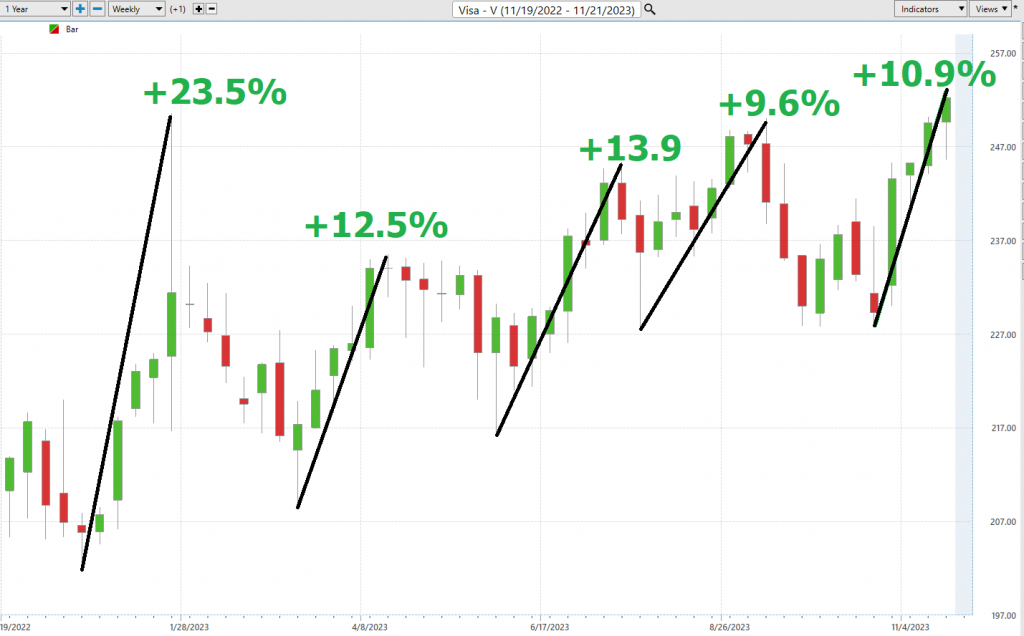
Let’s break it down. When the market’s rallying, that chart’s going to soar like an eagle, showing you a beautiful climb in prices. It’s optimism in action, with investors piling in, betting big on future gains. But hold on, it’s not all sunshine and rainbows. Even during rallies, you’ll see those dips, those corrections, and that’s where the savvy investors keep their cool.
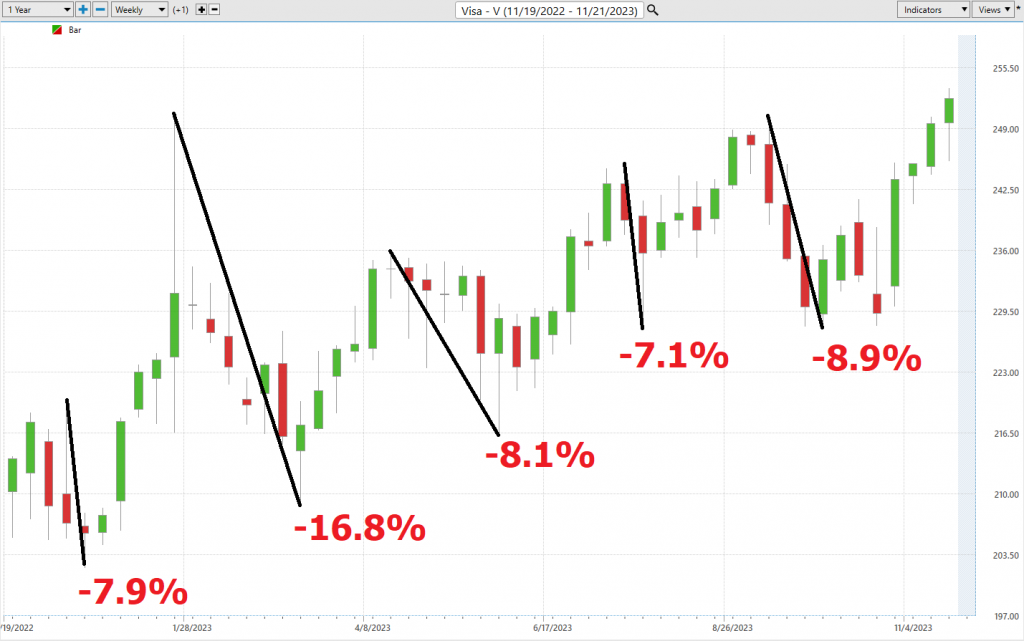
Now, flip the script. When the markets are in a tailspin, that chart’s going to plummet like a rock. It’s fear, its uncertainty, and its investors hitting the eject button, bracing for impact. But even in the darkest times, you’ll see those brief rallies, little glimmers of hope.
Here’s the key: compare the size of those rallies to the declines. It’s like measuring the waves in a storm. This is where you get your real-world expectations, where you see just how fast the market mood can flip.
Here’s the best-case scenario:
And here’s the worst-case scenario:
This simple and practical analysis allows you to see the most optimistic and pessimistic price action quantified.
When you’re sizing up a stock like Visa, you can’t just look at the short game. You’ve got to play the long game too. How’s it doing compared to the broader market indexes, not just last week or last month, but over the long haul? Is it a market leader, setting the pace, or just another follower?
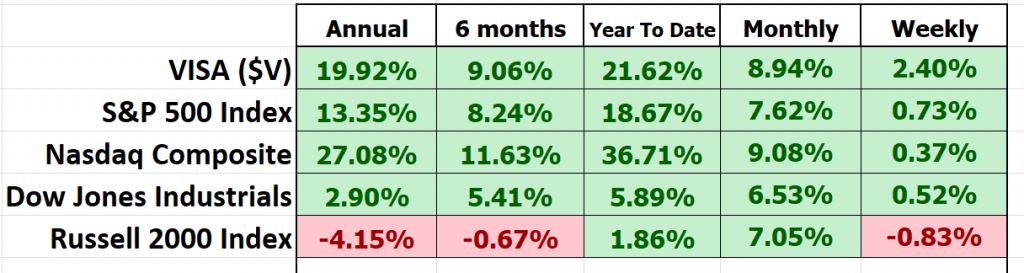
This is crucial. Understanding a stock’s performance across multiple time frames gives you the full picture. It’s like having a map and a compass in the market wilderness. It helps you spot the real opportunities and steer clear of the traps. VISA ($V) clearly outperformed the S&P 500 Index but is underperforming the tech heavy Nasdaq Composite.
So, keep your eyes on those charts, compare the short-term sprints to the long-term marathons, and you’ll have a much clearer view of where a stock like Visa stands in the grand scheme of things. That’s how you make smart, informed trading decisions.
Now, let’s dive into the intricacies of beta, a critical measure for understanding a stock’s relationship with the broader market.
Here’s the inside scoop:
– **Beta = 1:** Now, this right here is like a harmonious duet. When a stock boasts a beta of 1, it’s like its holding hands with the overall market. So, if the market decides to do a little 5% jig, you better believe our stock with a beta of 1 will be waltzing right alongside, with a 5% rise of its own.
– **Beta > 1:** Imagine this as a stock market rollercoaster on steroids. When beta goes above 1, say hello to the adrenaline rush! A beta exceeding 1, like 1.5, is like saying the stock is 50% more of a thrill-seeker than the market itself. When the market takes that 5% joyride upward, our high-beta stock might just kick it up a notch with a heart-pounding 7.5% climb (or take a similarly exhilarating nosedive).
– **Beta < 1:** Now, for those of you who like it steady and dependable, here’s where you want to be. A beta less than 1, let’s say 0.5, is like the calm in the storm. It tells us that the stock is only half as wild as the market. So, when the market decides to go up 5%, our low-beta friend might opt for a more leisurely 2.5% stroll.
Now, let’s apply this wisdom to VISA. $V proudly displays a beta of 1.05, and we’re sifting through data from a 5-year span. But let’s not forget that beta is rooted in the past, and the past doesn’t always dictate the future. High beta doesn’t guarantee high returns, my friends; it’s more like a warning sign, signaling that this stock has a knack for taking us on a ride that is slightly more volatile than the broader market.
Investors turn to beta to gauge how daring a stock is compared to the broad market. Think of it as your trusty risk-o-meter, helping you build a portfolio that matches your appetite for excitement and your investment goals.
Vantagepoint A.I. Predictive Blue Line Forecast
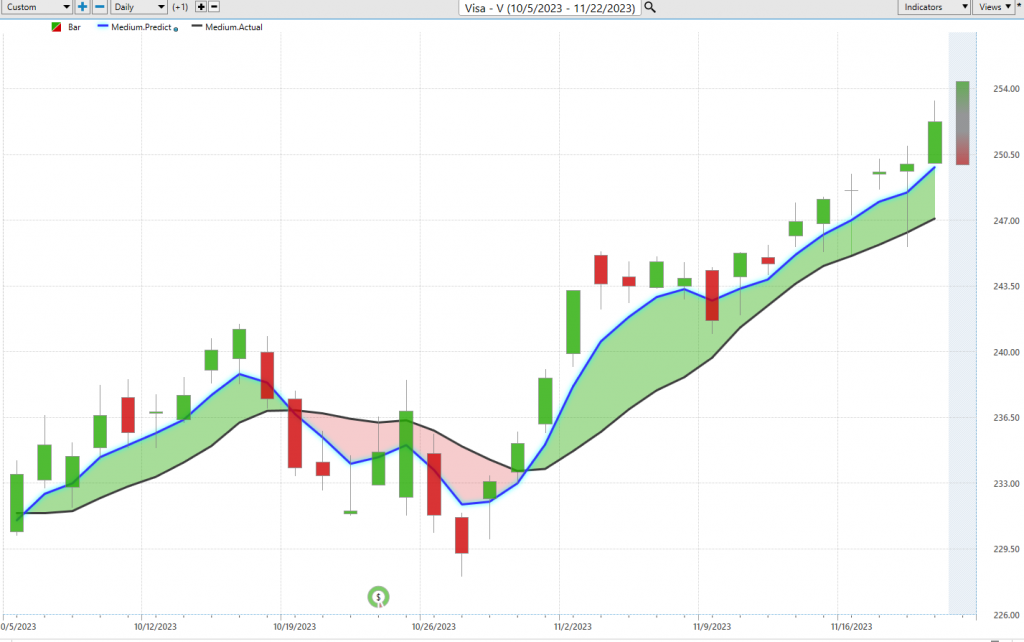
On the following chart you will see the power of the VantagePoint Predictive blue line which determines the medium-term trend price forecast.
The guidelines we abide by are as follows:
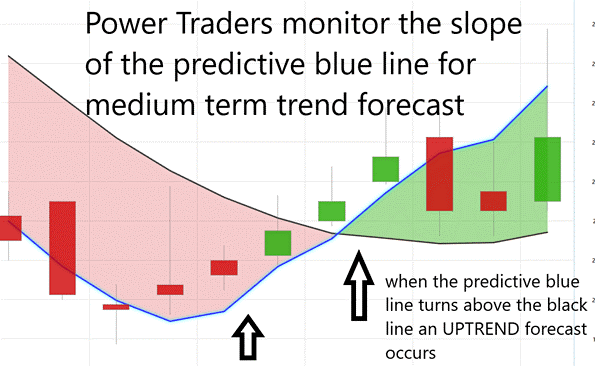
- The slope of the predictive blue line determines the trend forecast and general direction of $V.
- Ideally, the VALUE ZONE is determined to try and find buy opportunities at or below the predictive blue line, or to sell opportunities above the predictive blue line during a downtrend.
Well, let’s take a moment to step into the world of high-tech trading, where artificial intelligence isn’t just a buzzword, it’s a game-changer. I’m talking about VantagePoint A.I. and its remarkable Predictive Blue Line. This isn’t just a line on a chart; it’s a beacon in the often-murky waters of the stock market, guiding traders through the ups and downs of trading with a precision that’s nothing short of impressive.
Now, let’s break down the rules of engagement here. The slope of this predictive blue line, it’s not just a line, it’s a trendsetter, a pathfinder in the world of $V. It’s where the rubber meets the road in determining the general direction of the stock. And here’s where it gets interesting: the Value Zone. This is where savvy traders look to buy at or below this predictive blue line during an uptrend or sell above it during a downtrend. It’s like finding the sweet spot in a game of high stakes.
But let’s not get ahead of ourselves. This predictive blue line, it’s not just drawn out of thin air. It’s the product of VantagePoint’s cutting-edge Neural Network and Intermarket Analysis. Think of it as having a crystal ball, one that gives you a sneak peek into the future of market trends.
And then there’s the black line, a 10-day moving average that acts like our rearview mirror, giving us a glimpse of the market’s recent history. But the real star of the show? That’s the predictive blue line. It’s where traders in an uptrend look to jump in, right at or just below this line.
Now, pay attention to this: when you see two consecutive closes above this blue line, it’s like the market’s giving you a nod, hinting that an uptrend could be on the horizon. Conversely, two consecutive closes below it could signal a potential downtrend. This isn’t just trading; its strategic positioning is based on solid, AI-driven analysis.
And here’s a little nugget of wisdom for the traders out there: when that predictive blue line climbs above the black line, it’s like the market’s rolling out the red carpet for an UP-entry opportunity. It’s your cue to stay alert, stay informed, and most importantly, stay ahead.
So, in the grand scheme of things, VantagePoint’s predictive blue line isn’t just another tool in your trading arsenal; it’s your compass, your guide through the ever-changing tides of the stock market. Remember, in the world of trading, staying ahead isn’t just about being fast; it’s about being smart. And with tools like this, you’re not just riding the waves; you’re charting your course through them.
Neural Network Indicator (Machine Learning)
A neural network is a type of artificial intelligence (AI) that mimics the way human brains operate. At its core, a neural network consists of layers of interconnected nodes, or “neurons,” each processing input data and passing on their output to the next layer. The first layer receives the input data, and the final layer produces the output. Between them are hidden layers that perform complex computations.
In the context of trading, a neural network is constructed to analyze financial data and make predictions or decisions. The process involves feeding the network historical market data, including prices, volumes, and possibly external factors like economic indicators. The network learns by adjusting the weights of connections between nodes to minimize the difference between its predictions and actual outcomes. This learning process, often involving vast amounts of data and complex calculations, is why powerful computers and sophisticated algorithms are essential for constructing an effective trading neural network.
Picture this: at the bottom of your trading chart, there’s a Neural Network Indicator, a kind of crystal ball, if you will, for the market’s short-term movements. When it lights up green, it signals strength in the market. Red? That’s a heads-up for potential short-term weakness. And yellow? That’s the market taking a breather, moving sideways.
This Neural Network, it’s not just any tool. It’s like having a brilliant artificial mind in your trading arsenal. It’s constantly sifting through mountains of data, making sense of the market’s twists and turns. And the best part? It’s always learning, always adapting, getting smarter with every trade.
For those in the know, those Power Traders, it’s all about confirmation. They’re not just looking at this Neural Network Indicator in isolation. No, they’re cross-referencing it with the predictive blue line. When both are singing the same tune, that’s your green light. But if they’re giving you mixed signals, it’s time to hit the brakes, reassess.
In the world of trading, neural networks are like having a secret weapon. They’re uncovering insights and patterns that traditional methods might lack. And for the serious trader, this is a game-changer. It’s about detecting those subtle, non-linear interdependencies that can make or break a trade.
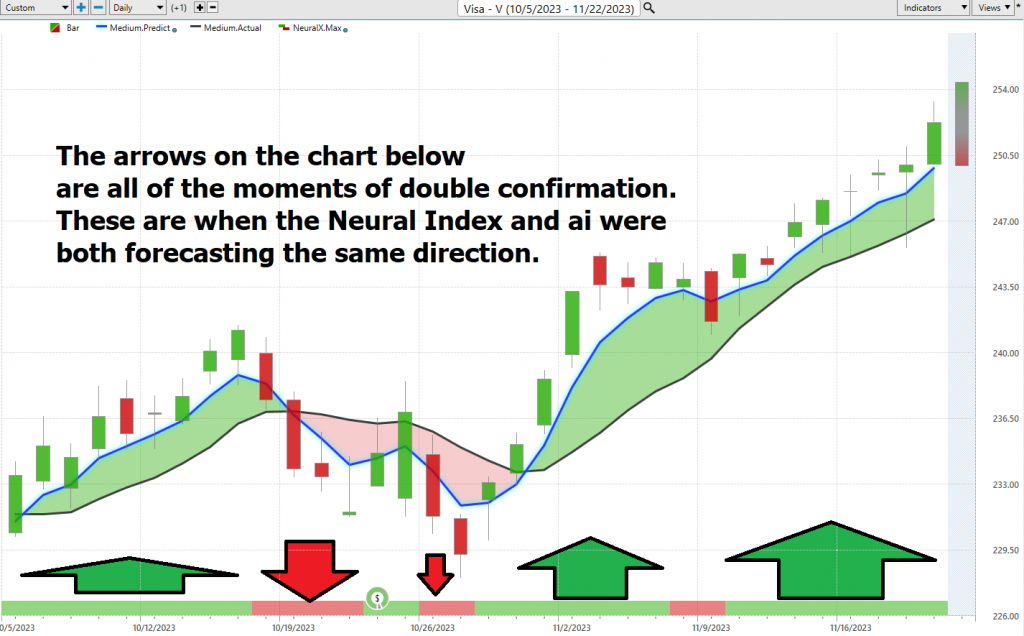
So, here’s the strategy: when the A.I. forecast and the Neural Net are both flashing green, that’s your window to jump in, and find a trading opportunity to go long. But remember, in trading, it’s not just about the tools you have; it’s about how you use them. Always double-check, cross-reference, and stay one step ahead. That’s the cornerstone of success in this high-stakes world.
For Power Traders, it’s about combining the prowess of the Neural Network with the insights of A.I. When they align, you’re golden. But if they’re telling different stories, caution is your best friend. In the end, it’s about using every piece of intelligence you can get your firsthand tofind those statistically sound trading opportunities. And in today’s market, that’s not just smart; it’s essential.
VantagePoint Software Daily Price Range Prediction
Strap in because I’ve got a game-changing tool that’s the secret sauce for all you Power Traders out there. I’m talking about VantagePoint Software’s Daily Price Range prediction forecast, and let me tell you, this right here is the real deal, which separates the big dogs from the newcomers. This is the key that unlocks the door to precision trading.
Now, I don’t need to tell you that every trader faces a daily battle, a struggle to decide when to jump into the market and when to sit tight. It’s enough to keep you tossing and turning all night. But fear not, because VantagePoint’s A.I. is here to save the day. It hands you the predicted high and low points on a silver platter, giving you a crystal-clear view of the opportunity and trend. No more second-guessing, my friends.
Let’s take a look at the numbers, shall we? Check out the average trading range metrics for $V over the past year, spanning daily, weekly, and monthly time frames.
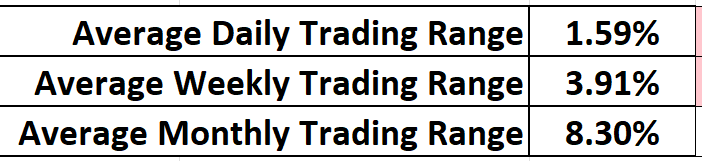
But here’s the golden rule of trading, and you better pay attention because this is where the magic happens. It’s all about nailing the perfect moment to enter and exit the market. VantagePoint doesn’t just help you find that moment; it does it with breathtaking precision. The Daily Range forecast gets updated daily, giving you invaluable insights into where prices might be headed. Think of it as having a wise old mentor whispering market wisdom in your ear.
And now, feast your eyes on that chart. This isn’t just some fancy artwork; it’s your trusty guide for placing stops and managing risk. Notice how price rarely ventures below that dark line? Well, that’s your cue for ideal buy stop placements right in that specific vicinity. It’s risk management at its absolute finest.
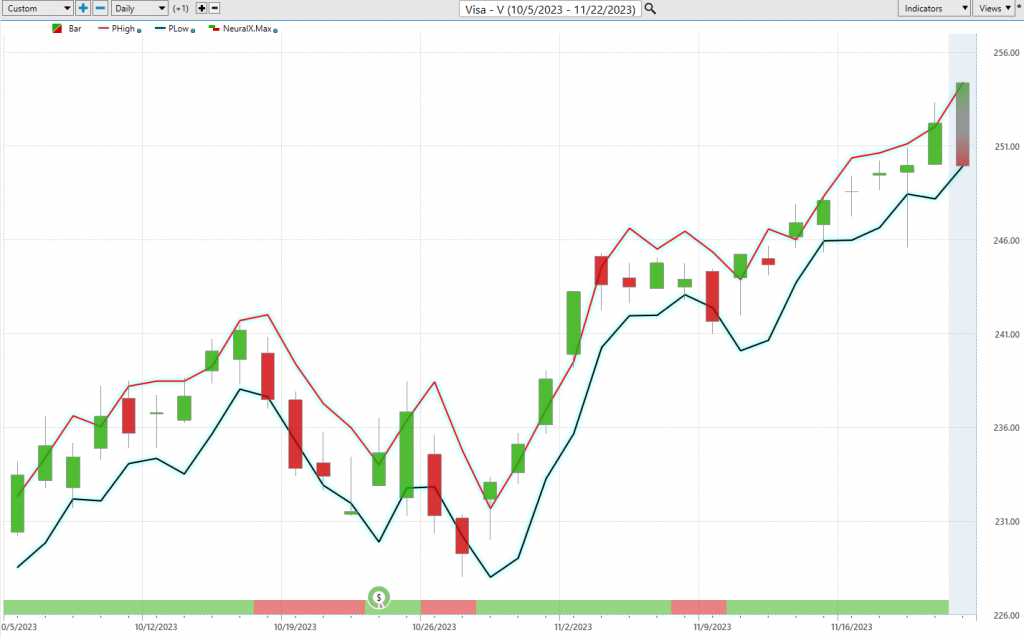
Now, let’s talk strategy, folks. Those upper and lower bands of the price range forecast carve out a clear channel of trading activity. And here’s a gem for all you sharp swing traders out there: Keep your eyes peeled for buying opportunities near the channel’s bottom and selling chances near the top. It’s a cautious approach, but it’s loaded with potential for success.
But hold onto your hats because here comes the grand finale, the pièce de résistance. When Power Traders combine this daily range forecast with the double confirmation setup, it’s like wielding a precision instrument for spotting swing trading opportunities. Just one glance at that chart, and you’ll witness the daily range forecast in action, making moves with surgical precision. That, my friends, is the remarkable power of VantagePoint. Don’t miss this game-changing tool. It’s time to level up your trading game!
Intermarket Analysis
In the dynamic world of trading and investments, it’s crucial to navigate beyond the surface, to delve into the deeper truths that govern the movements of markets. Picture this financial universe as a colossal jigsaw puzzle, where each piece – whether it’s stocks, oil, or currencies – plays a pivotal role in the grand scheme of things. But let’s not be swayed by the sensational headlines; they’re merely plot twists in our financial narrative.
Enter the realm of intermarket analysis, a potent tool akin to a detective’s magnifying glass. This method isn’t just about looking at one market in isolation; it’s about understanding the intricate web that connects various markets. Developed by pioneers like John Murphy, intermarket analysis revolutionized how traders view the financial world. Murphy, in particular, is often hailed as the father of this approach, bringing to light the subtle yet significant relationships between different sectors like stocks, bonds, commodities, and currencies. Vantagepoint A.I. Software founder Lou Mendelsohn certainly pioneered furthering intermarket analysis to help traders improve their decision making processes as well.
Imagine you’re holding a string, and as you tug on it, you notice the other strings responding. That’s the essence of intermarket analysis. It’s about recognizing how these ‘strings’ of the financial world are intertwined, allowing savvy traders to anticipate market movements and refine their strategies for maximum gain.
In essence, intermarket analysis is the Sherlock Holmes of the financial world. It’s the key to unlocking the mysteries behind price fluctuations, revealing how different aspects of the financial world are interconnected. It’s not just a tool; it’s a mindset, a way of seeing the financial world as an interconnected matrix where each element influences the other.
Now, let’s turn our attention to the real power at play – our response to the truths we uncover. In the world of trading, it’s not enough to be swayed by the daily drama of financial news. We need to dig deeper to understand the underlying forces driving asset prices in this global marketplace.
Intermarket analysis is our guide in this endeavor. It sheds light on how different markets, like stocks, oil, and currencies, are connected. Understanding these connections is like having a map in a treasure hunt. It helps us see the bigger picture, how changes in one market can create ripples in others, and how global events shape our investment landscape.
So, don’t be led astray by the fearmongering of sensationalist media. Base your decisions on facts, on a deep understanding of these market connections. Intermarket analysis isn’t just a tool; it’s your compass in the tumultuous seas of finance, helping you navigate through storms and calm waters alike.
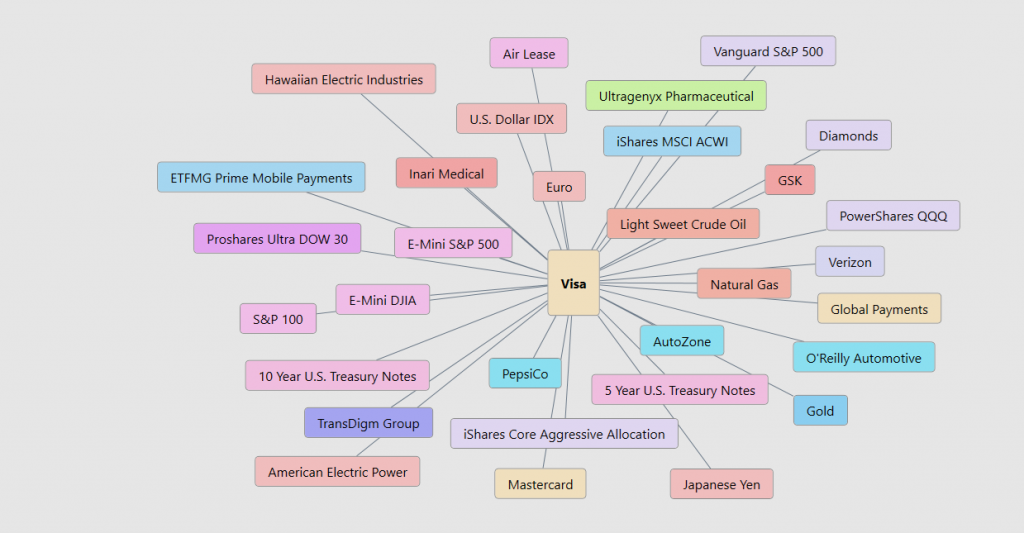
And now, feast your eyes on this Intermarket Analysis graphic. It’s a treasure trove of information, unveiling the 31 markets that are key to deciphering the price movements of $V. This graphic isn’t just informative; it’s a window into the drivers of $FRO’s performance, offering a glimpse into the forces shaping its trajectory. Understanding these market drivers is invaluable, providing insights that can guide your trading decisions and strategies. In the world of finance, knowledge is power, and this graphic is a testament to that truth.
Our Suggestion
As I mentioned in the introduction of this stock study, our favorite setup of all time is whenever we find an asset simultaneously making new 52 week and new 10-year highs. This confluence is a clear indication that the asset is overcoming all barriers related to growth. For this reason alone, $V deserves to be on your trading radar.
Over the past year VISA grew earnings by 16.1%. Earnings are forecasted to grow by 10.59% moving forward.
Pay close attention to how prices react and respond to the current 10-year high. So far volume has been strong and very supportive of a continued advance.
We continue to look for opportunities to buy weakness and advise traders to practice good money management and use the A.I. forecast as your short-term positioning guide to this asset.
Our recommendation is to follow the A.I. trend analysis as outlined in this stock study and practice good money management on all trades.
We will re-evaluate daily based upon:
- New Wall Street Analysts’ Estimates
- New 52-week high and low boundaries
- Vantagepoint A.I. Forecast (Predictive Blue Line)
- Neural Network Forecast
- Daily Range Forecast
The trend in $V is UP. Momentum is strong. Pay attention to the next earnings call in $V on January 26, 2024. Earnings and revenue growth make $V a very unique trading opportunity.
Let’s Be Careful Out There!
It’s Not Magic.
It’s Machine Learning.
Disclaimer: THERE IS A HIGH DEGREE OF RISK INVOLVED IN TRADING. IT IS NOT PRUDENT OR ADVISABLE TO MAKE TRADING DECISIONS THAT ARE BEYOND YOUR FINANCIAL MEANS OR INVOLVE TRADING CAPITAL THAT YOU ARE NOT WILLING AND CAPABLE OF LOSING.
VANTAGEPOINT’S MARKETING CAMPAIGNS, OF ANY KIND, DO NOT CONSTITUTE TRADING ADVICE OR AN ENDORSEMENT OR RECOMMENDATION BY VANTAGEPOINT AI OR ANY ASSOCIATED AFFILIATES OF ANY TRADING METHODS, PROGRAMS, SYSTEMS OR ROUTINES. VANTAGEPOINT’S PERSONNEL ARE NOT LICENSED BROKERS OR ADVISORS AND DO NOT OFFER TRADING ADVICE.


