


VantagePoint AI Market Outlook for the Week of April 20, 2020
VIDEO TRANSCRIPT
U.S Dollar Index
US Dollar Index
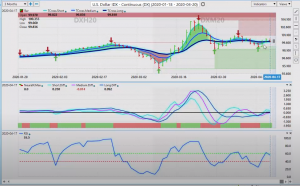
Hello, everyone. Welcome back. My name is Greg Firman and this is the VantagePoint AI Market Outlook for the week of April the 20th, 2020. Now, to get started this week, we’re going to begin where we always do with that very important US dollar index. Now, what we can assess here is the dollar is basically moving sideways between a known resistant verified resistance here at 10103 and our downside support coming in at or about the 9834 area with additional support coming in at 9081. Now, we have a very mixed signal here on the MA diff cross, but our neural index is pretty firm here. We’re trying to move higher, but again, struggling to hold onto any gains. Now, it would appear that at least some of the US economy is going to start opening up very soon. That may give the dollar a boost, certainly giving the equity markets a boost. The question is, is it sustainable? That’s what we have to assess here going forward. Do we reopen the economy and then it gets closed again? Do things get worse? There’s still a lot of unknowns out there for the current time. But while the dollar is holding below our key support going down to 9834, there’s a slight biased for dollar strength as we start moving towards the end of the month. As we’ve discussed over the previous few weeks on the AI Market Outlook here, there is a known dollar cycle when the dollar is strong at the end of the month, end of the first week of the new month, and then usually weakens after the nonfarm payroll number.
S&P 500
S&P 500 Index
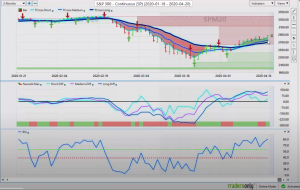
Now, the boost in the equity markets has been quite strong over the last several days, but again, this move was forecasted long before it started moving up. We can see that our triple EMA cross started back here on April the 6th. A lot of people, including myself, were not overly supportive of this move up in the equity markets, but it continues to hold gains. Now, when we look at where we are from the high, considering everything that’s happened here, the S&P 500 is still showing some very strong resilience here to say the least. The question now is, is it a buy the rumor, sell the fact? Are the equity market’s going to keep moving higher? Now, our neural index is very mixed. We are in heavily overbought territory, but that doesn’t mean it can’t go higher. However, my optimism on further gains remains heavily guarded until such time as we at least retake this high around 3124. Now, after the announcement that some of the economy is going to start taking steps to reopen, that obviously had a very negative effect on gold. Now, we can see this verified resistance up here, very strong, but the one thing I’ve noticed as of late is that gold and the S&P 500 have been moving more or less up and down together ever since things started to worsen with the COVID virus.
Gold
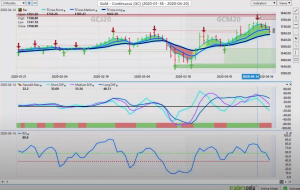
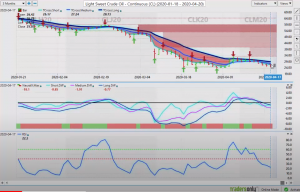
When that started to happen, you saw monies trying to keep the equity markets propped up, but real money also going into gold. For this coming week, 1680 is going to be a big week whether it can hold. We have a medium term crossing our long-term predicted difference with the neural index, which suggests we have more downside ahead on gold. However, remember guys that we still need to see where we go from here in the current situation with the COVID virus. Now, oil is trying to recover here a little bit, but again, there’s just simply no buyers for oil here. Whenever it does retrace higher, the sellers appear to be just sitting there waiting. Now, somewhat shocking that oil was actually breaking down below $20 a barrel this past week. Again, still not a lot of demand for oil even with some of the economy starting to turn around and open back up. We’re going to have to wait and see on this one, but either way, I would anticipate that oil would recover if we actually have a summer driving season this coming year
GOLD
Crude Oil
Crude Oil
Euro/USD (EUR/USD)
Euro versus US Dollar
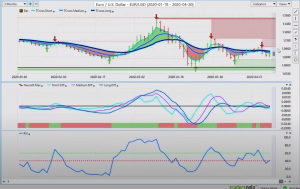
Now, as we move into a number of our different Forex pairs for next week, the Euro is now, again, front and center here, guys. We can see that the Euro is backing off any rally here. We moved higher. But then as the S&P started to recover, that old correlation came back with a vengeance, didn’t it? It pushed the Euro back down. We saw the Euro strengthen and backed off. This coming week 10916 is our key level, but my concern here is that we have a very, very mixed signal around the zero line on the predicted differences. The neural index has been spot on from the time I called it to the upside to the time I called it to the downside. Even if we’re just looking at the neural index, it’s telling us for now that as long as we’re below this T cross long, this key pivot area at 10916 and the neural index is red and not green, we would prefer to sell into rallies. Again, this is all going towards that dollar strength. The US potentially coming out of lockdown, so we’ll continue to monitor it. But right now, again, you can always use the additional level. This is something that I teach in the VantagePoint live training room here with using just the blue line by itself, 10892, excuse me. We know where the resistance is here, guys, 10892, 10916. We’re sitting right on that level. If we can stay above this blue line for two days in a row, then the Euro may have a chance of actually moving higher.
U.S. Dollar/Swiss Franc (USD/CHF)
US Dollar versus Swiss Franc
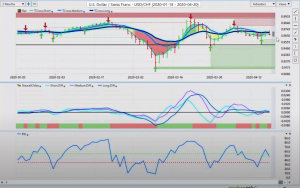
Now, as we move into the counter pair to the Euro-US, which of course is the US-Swiss Franc, we’ve got critical resistance at 9694. This pair has been all tangled up in the VantagePoint key pivot areas pretty much the entire week. Decent longs, but also very good shorts off this particular area. The neural index has gone from green to red and our RSI is pointing down. This is, again, a potential warning sign that the current move in the S&P 500 may not be a true move here, guys, because the correlation here is if the dollar-yen and US-Swiss Franc are moving lower, in most cases, so is the S&P 500. We’ll continue to monitor this key level at 9694. Once again, if we bring in our blue line by itself, you can see I’ve always talked about that two day rule, closing above this blue line at 9681.
British Pound/U.S. Dollar (GBP/USD)
British Pound versus US Dollar
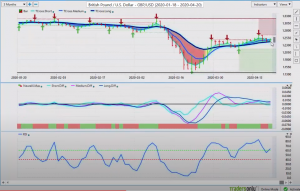
We simply are not able to do that. Again, the predicted differences all tangled up around the zero line. We want to get a good confirmation of which direction this is going to move. We likely will not get that until Tuesday, so be very careful with that particular pair. Now, as we look at the pound-dollar this week, we’ve had both good buying and selling here. Right now the neural index is turning green. We’re holding onto that VantagePoint key level at 12414. Long’s carry a slight edge here while above that particular level. Now, once again, if we look at our blue line by itself, you can see that it actually isn’t as bullish as maybe as what it looks. We’ve closed below this level one or two days, but not in a row.
U.S. Dollar/Japanese Yen (USD/JPY)
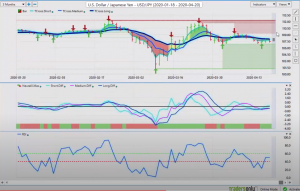
We’re going to continue to monitor, but right now there is a slight biased to the downside as we move in towards the end of the month, we know the dollar gets stronger. Again, if we look at this particular verified resistance high, 12646, here’s my advice on this one. It’s free advice guys. Be careful with this one and US-Canada on Mondays because what’s often happened is they make a big move up or down on Monday and then they just completely reverse on Tuesday. If the pound-dollar makes a big run up to 12642 on Monday, the probability is it’s going to reverse lower. Again, be very cautious with that and watch these key VantagePoint pivot levels. Now, when we look at the dollar-yen, the dollar-yen has had a pretty decent week. The shorts were still the far better play here. But again, when the equities turned around, the dollar-yen turned around. Just remember that in your trading guys that the dollar-yen will literally follow the S&P 500 up and down. As the S&P recovers, so does the dollar-yen, but you’ll notice where it recovered, off a very identifiable verified support zone coming in at 10693. For now, we remain basically deadlocked between the VantagePoint T cross long at 10807. We’ve got the additional verified resistance at 10938, and very strong support at 10693. A break on either side of that level will then in turn show us the real move. In my respectful opinion, we will get that when the equity markets make a final decision whether they’re going to recover or whether they’re going to sell off again.
US Dollar versus Japanese Yen
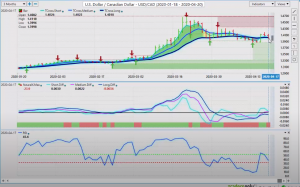
U.S. Dollar/Canadian Dollar (USD/CAD)
Now, as we move into the US-Canadian pair, once again, the Canadian economy is really taking a hit with the lockdown that’s still in effect now until May the 12th. That’s not overly positive for the Canadian dollar. We can see we’ve got our medium term crossing our long-term predicted difference, but our neural index is very, very conflicted here. In my respectful opinion, we are likely to make a big push down on Monday only to turn around and likely go higher on Tuesday, Wednesday and Thursday if oil continues to move lower, if gold moves a bit lower, but more importantly, the US-Canada also needs that S&P 500 moving higher if it’s going to continue this potential downtrend. Now, again, we’re struggling right around this key VantagePoint level at 14018.
We’re closing pretty much just a little bit below this on Friday. Again, be careful with this pair on Tuesday. On Monday, it’s likely to follow this primary move down with the neural index, but be cautious of a reversal on Tuesday.
US Dollar versus Canadian Dollar
Aussie/U.S. Dollar (AUD/USD)
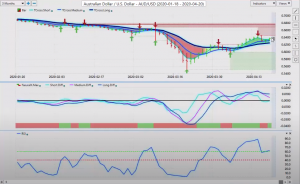
Now, with the Aussie and the New Zealand, both of these currencies have come around, but again, they’re feeding off of a couple of different things. The Aussie feeds off of gold, it feeds off of the metals, but it also feeds off the S&P 500. If the global equity markets would start to recover, that’s likely to help the Aussie dollar. But if they don’t, it could be going lower. Now, again, we’ve got a very mixed signal here. The medium term crossing the long-term predicted difference. This appears to have been just a retracement back to the key VantagePoint level.
Our T cross long at 6232. But again, we need to hold above this level. When we click on our F8 on this particular pair, you can see that we’re really struggling to hold above this key VantagePoint level. Now, this is again, something that I’ve taught on a weekly basis in the VantagePoint live training room where we use this blue line as a daily pivot area to buy and sell from. We also use it to gauge the strength of a pair or the weakness of our pair. You can see that once we break this predicted moving average and we close below it, the market is in constant contact with it every day thereafter until it starts to reverse again. We’ll watch this one very closely, but as you can see, we are starting to really struggle here.
Australian Dollar versus US Dollar
New Zealand/U.S. Dollar (NZD/USD)
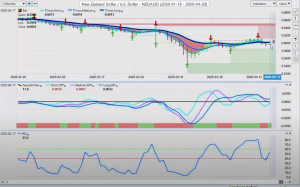
that high, around 6444, is still a reasonable level to attempt shorts. The same thing would apply to New Zealand. Once again, a lot of people, just to clarify, they feel that they’re different pairs, but really the Aussie and the New Zealand-US, it’s the exact same trade almost here, guys. Just keep that in mind. Don’t go long on one and short on the other or something like that because it doesn’t make a whole lot of sense, right? It’s the same trade. When we look at the Aussie, we’ve got the same setup here. It’s trying to recover. If we look at the blue line by itself, that predicted moving average, we actually do have two days that we’ve crossed below this particular blue line and we have very identifiable verified resistance, again, just up here above the 61 levels.
It could be a very good short here, guys. We just have to let this thing progress a bit. Well, the one thing I’ve noticed about the markets, particularly over the last several years, is that whatever happens on Monday, the exact opposite happens on Tuesday. With that said, this is the VantagePoint AI Market Outlook for the week of April the 20th, 2020.
New Zealand Dollar versus US Dollar


