Welcome to the Artificial Intelligence Outlook for Forex trading.
VIDEO TRANSCRIPT
Okay, hello everyone and welcome back. My name is Greg Firman and this is the VantagePoint AI Market Outlook for the week of April 22nd, 2024.
US Dollar Index
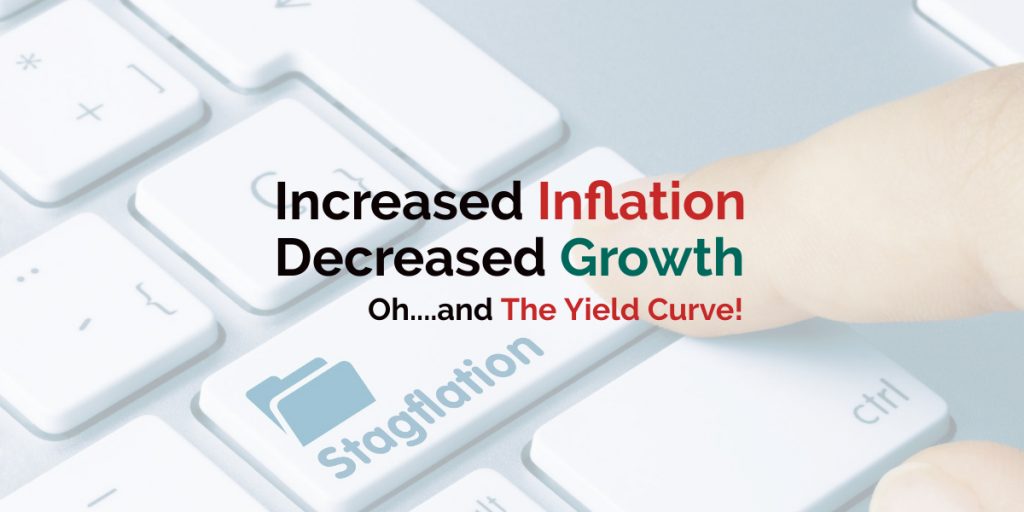
Now, to get started this week, we’ll begin with the all-important US Dollar Index. As we can see with the index, it’s holding gains up here, but we’re stalling out at this newly formed verified resistance high of 106.51. We would have to break above this area next week in order to maintain this upward momentum in the dollar. Now, it is going to be very choppy because of the Israel-Iran conflict. That could send a risk-off scenario further, excuse me, and put more money into the dollar. But we do go into a Fed blackout; that’s the good news.
So right now, we’re above our T-cross long. The current retracement level is 105.22, but the quarterly opening is a big area at this particular time of year, 104.49. So these are our support levels. We do have a contrarian reversal signal on the dollar, the MA diff cross. Now, this is pointing towards dollar weakness going into next week, but it is a retracement or contrarian retracement. It’s not necessarily a new trend. That retracement point would be the T-cross long at 105.22. If that level holds, we would be buyers at this particular level because, again, this is an outlook, not a recap of something that’s already happened. So we want to make sure before the market starts trading on Monday or Sunday night that we know where these levels are and what the immediate signal is.
Now, this is a very mixed signal. The neural index, the neural index strength, the predicted RSI is above the 50 and the 60 level. So the only signal here that again, based on the correlation of 31 other markets, is suggesting that the dollar is actually going to move lower.
Now when we look at it from an AI perspective and what really drives the dollar here, the direct top 10 in correlated intermarkets are the Pro Shares Ultra Euro, the US Singapore Dollar at 89%, the Pro Shares Ultra Short Treasury at 84.17, a list of US Dollar-based pairs, OB energy, and again, an individual stock at 69% positive correlation.
Now if the dollar does fall next week, then we also can look at the flip side of this. There is actually an 83.5% inverse correlation to the Dollar Index. So if the dollar falls, it suggests that this grouping of stocks will rise. That’s the basis of the artificial intelligence and the direct intermarket correlations that either drive the dollar or will move in the opposite direction of the dollar. So it’s very important where money is pouring into the dollar and not it’s not going into necessarily Bitcoin, Oil, Gold, some of these other markets.
Then again, if that dollar turns, if the dollar moves higher, these groupings will move higher also. But if the dollar moves lower, we look at this grouping down here. Now, from the quarterly correlations, we can see that that can change somewhat. Now again, it’s not the same, the US Singapore Dollar on this particular quarter, the start of the second quarter or the third quarter for the US, I should say, we can see there’s a 98.34% correlation to this US Singapore dollar. So that would be if the Dollar Index extends higher, that would be a pair we would look at.
But that’s just a quick window into how the AI technology and the neural networks because this is not just a predicted moving average with a series of standard technical indicators. The core process in the software is that it uses those intermarket correlations not only to show what’s happening with the target market but more specifically other markets to trade whether this market goes up or down.
Gold
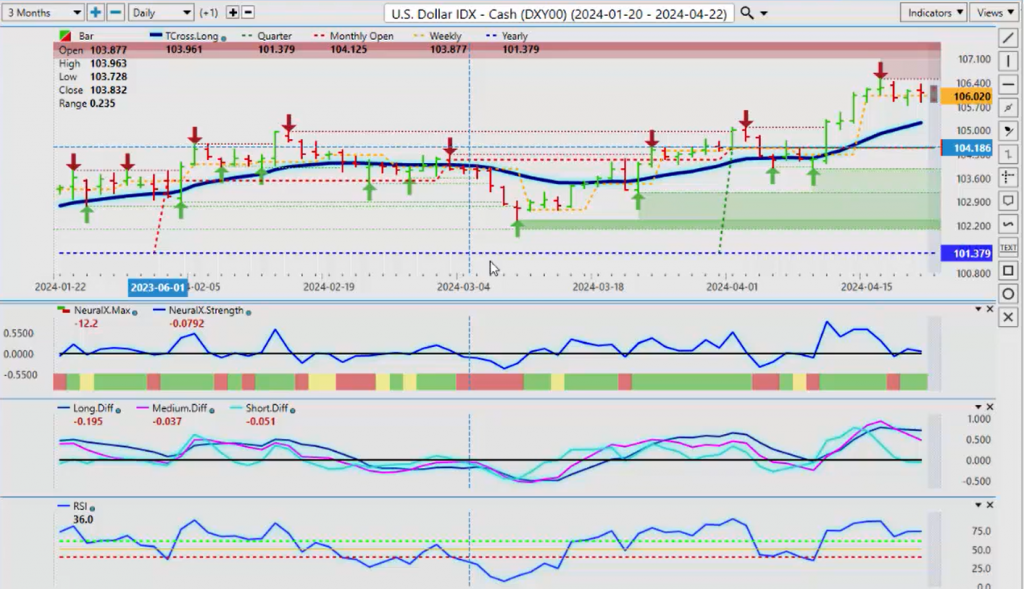
Now, Gold this past week again continues to climb, but we are stalling out somewhat up here. We also have a newly formed verified resistance high of 2427. That is the area to watch, but as you can see the strength of the long-term trend, the medium-term, and the short-term trend, while it’s still above the zero line, it’s weakening, it’s falling. So again, we need to monitor this to see where this is going.
So the quarterly opening and the monthly opening, very important levels, 2233. This is the retracement potential retracement point that we would look at, but for now, the long predicted 2374, you can see that every single day this past week, we’ve been basically using that as a buying point because again, taking the correlation of 31 other markets gives us an exact pivot point in these markets to be able to trade from. So buying Gold on the way up has been very profitable going all the way back to the end of, I would argue, the beginning of March when this actually started right here. We crossed over the current yearly opening price.
Another thing we don’t want to get involved with here, guys, is a rolling performance model. We need to anchor. We need to have anchor points. So the current yearly opening price, the current monthly opening price, the quarterly, and even each week, I use the current weekly opening price. If I’m above it, I’m long; below it, I’m short. This is a very objective level, not subjective—objective meaning that we can gauge it, and that’s a line in the sand. If we’re holding below any current weekly opening price, even in a bull market, it can still be actually the sellers could be in control, and that’s just an easy way to validate this.
So again, Gold is very mixed, and I would argue that it’s going to have its work cut out for it next week. But if this conflict remains, then Gold will definitely hold on to its current value.
S&P 500 Index
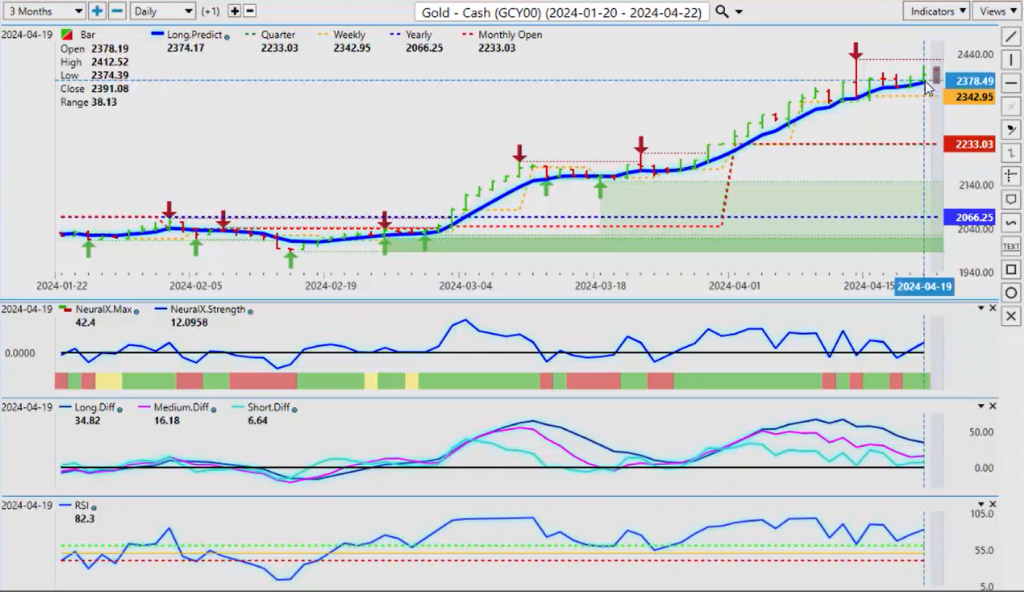
Now, the S&P 500 again, really taking a hit here this past week, and also it’s again very important that we have an accurate look at what this market actually did—how much was it up or how much was it down? We need to do that with proper anchor points, not a rolling performance model. Because when I look at this, this is a very big down week at 3.52% on the particular week. So if there is any kind of resolution to the Iran-Israel-Palestine conflict and everything settles down, this could easily retrace and likely will back to our T-cross long, and that, at the very minimum, and that level is 5116.
But we can’t randomly pick where this market, we can’t use a random 5 days, or a random 30 days, or a random 365 days. We need solid anchor points. To me, this market is a little more than a little bit overdone here, and this is a reaction in a risk-off scenario. So if we get more of a break in this conflict, then you’ll see the buyers come back into the equity markets. And you know when we look at the predicted RSI, 8.3, the predicted differences are, again, I will use the terminology ‘out of fair value.’ I do not believe in overbought or oversold or any of these terminologies. ‘Out of fair value’ would be the terminology that I would use, and there is a strong possibility that these equity markets turn and move back up. Now, in order for that potentially to happen…
Volatility Index ($VIX)
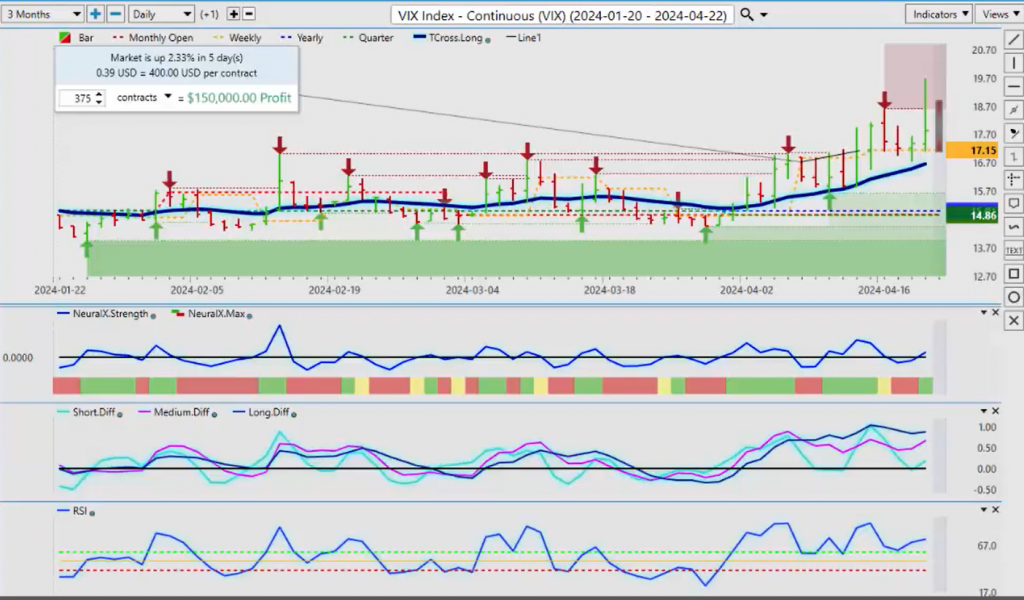
We do need this VIX moving lower. As you can see, we had a big push up again on this VIX, which I’ve talked about the last several weeks. I’ve been pointing out that people should be careful of this; it’s showing volatility in the equity markets. The VIX goes up, the S&P 500 and the global indexes, they move lower—that’s the way this works from an in-market analysis standpoint. So we had a big push up but it didn’t really hold on to those gains much by the end of the day. So watch for a breakdown; at the very least, if we can see our T-cross long here, 16.65. But in this scenario, if we click on F8 in our software, this particular level, 17.45, is where we’re looking for a break next week. If we break down below that, then we could start moving lower.
But what concerns me here is the VIX is making new highs and we’re holding above the quarterly and the current yearly opening price. Again, if I move these around and said, okay, the last five random days or the last 15 random days, then I wouldn’t have a proper anchor point in my trading to show me what’s happening this week, this month, and this year—very, and this quarter, more importantly, very, very important.
So right now, you can see that the VIX is still showing strength here. Our short-term strength has bounced off the zero line and it’s starting to move up. So be very cautious with this. The European equities, my friends in Germany here, I like to definitely help them out too. So you can see that basically, the DAX I would argue is holding up slightly better than what the S&P did. So when we look at this closer, where basically we started the week, you can see that we’ve come down, and I believe that this is partly due to Euro weakness.
DAX
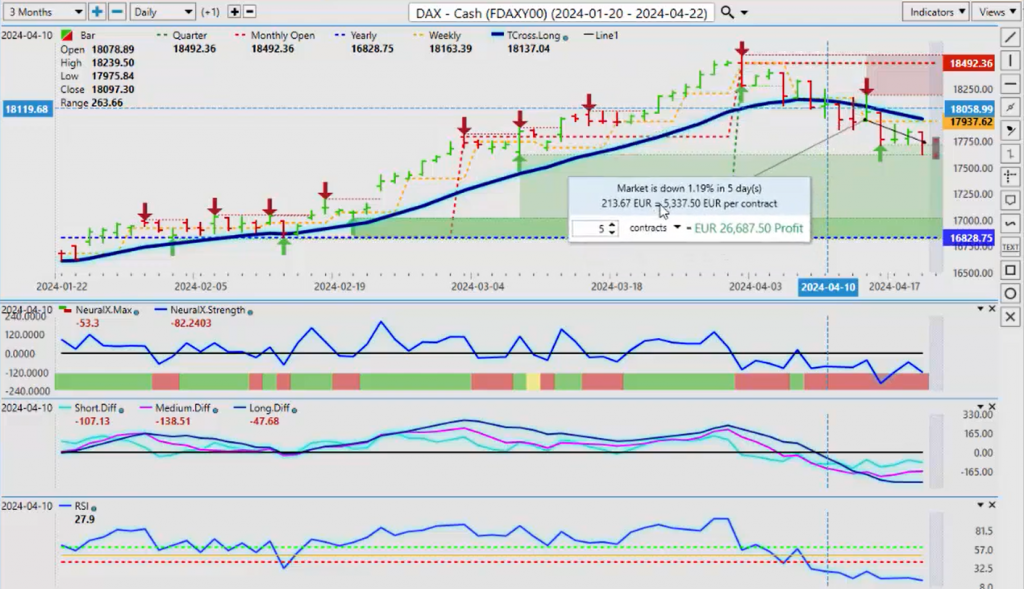
So only the DAX struggled but it’s only down 1.19%. So it’s clear, if we look at a country’s currency or its equity market, usually one is doing good and the other is not. So here the Euro is not doing well, and that’s, in my respectful opinion, only based on that direct inverse correlation between the DAX and the Euro is why the DAX fared a lot better than the S&P and the NASDAQ and some of the other global indices.
So again, for next week, this is a warning sign right here. Our MA diff cross is warning us that the DAX is likely getting ready to turn back up soon because, again, this is an outlook, guys, not a recap of something that happened last week or the week before. We’re looking at current signals while the market is closed, I might add, in preparation for the week of April 22nd. Trading is looking forward. This is warning that potentially the DAX could be the better place, the European equities could be the better place to be versus the US at the current time. But I would also argue that if things calm down, both will go back up. That’s the way I would currently play this particular situation.
Light Sweet Crude
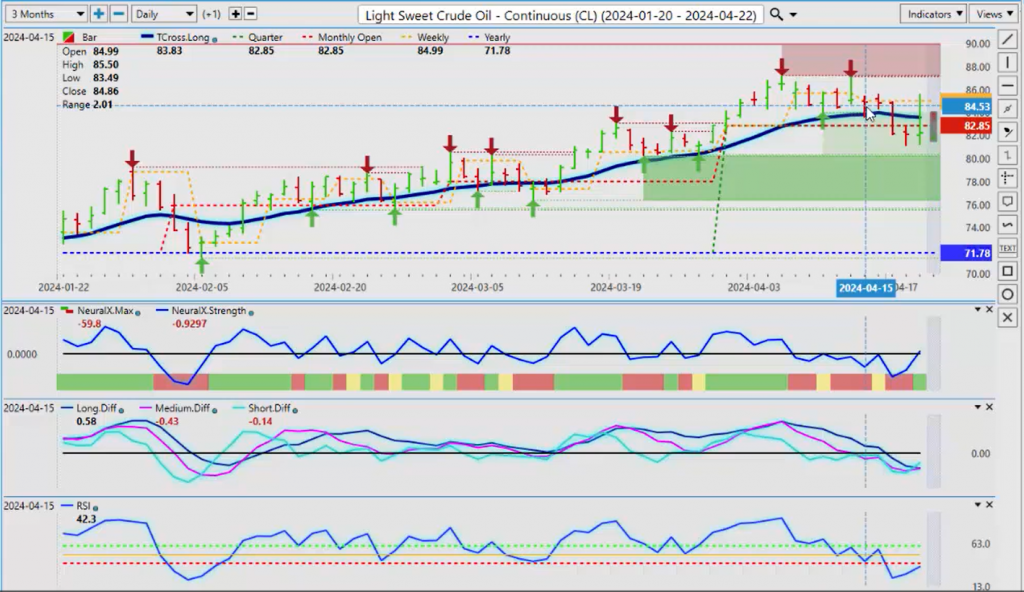
When we look at Light Sweet Crude, once again, crude having a pretty terrible week considering the conflict. But just remember the US is producing a lot of oil; they’re not dependent on dirty Saudi oil anymore or Middle East oil. So, I believe that weaker oil prices will speed up the resolution of this particular conflict and just because of this conflict, it doesn’t mean that oil will go higher here.
Gasoline prices, our Bob contracts are likely to move higher because they’re doing the changeover from winter gas to summer gas, and usually, prices spike during that time. So the direct in-market correlation, if I’m looking at either buying Arbab gasoline contracts or Light Sweet Oil at this time of year, I would argue Arbab gas contracts are better for that particular reason because the fundamental of that changeover is a supply and demand issue, in my view, is what I’ve normally seen.
So, oil for now, it does remain very positive on the year, 71.78, but it needs to get moving up here. We’ve got some pretty significant resistance forming up at 87.22. Me, being domiciled in Canada, I can’t speak for the US, but I would welcome lower oil prices, much lower actually, because that would cut off terrorist funding. A lot of different things would come that would benefit the world with lower oil prices. So we’ll see how this one works out here, but I would not be a buyer of oil strictly because of this conflict. I think that’s the opposite view, maybe at this time, and the gas contracts may be a much better play.
Now when we look at some of our Forex pairs going into next week, we are going to see a lot more volatility, guys. That’s just the nature of the beast here at this time. So the Euro, again falling pretty hard the previous week, this week the Euro actually did okay, and it actually squeaked out a small gain from the open to the close. But again, very important when we’re doing this that we take again, showing everybody how to use proper anchor points to determine the percentage gain or loss on the week.
Euro versus U.S. Dollar
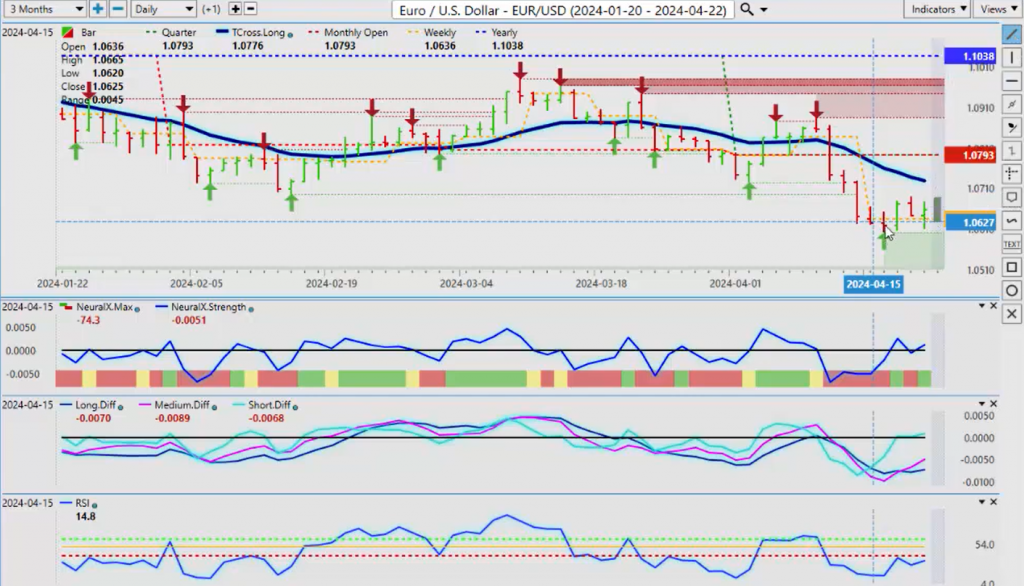
So they’re saying the Euro didn’t fare well this past week, well actually it did squeak out; it is slightly positive. That could be the base. We have a contrarian reversal signal on the Dollar Index. This could lead to some Euro strength next week, and we don’t have to worry about the Fed because they’re in blackout. We have a number of reversal scenarios. We’ve got our MA diff cross warning, again not necessarily a new trend in the Euro, guys, the Euro is clearly in a downtrend. I wouldn’t dispute that, but a corrective move higher back to the T-cross long at 1.0730, well that appears imminent based on these predictive indicators. So we’ll monitor this one, but I would be very cautious holding longs once we get close to 1.0725, and I suspect we could get to that area by Tuesday or Wednesday if we have some kind of break in the action or in the war, in or potential war between Iran and Israel. That’s the big concern we all have now.
U.S. Dollar versus Swiss Franc
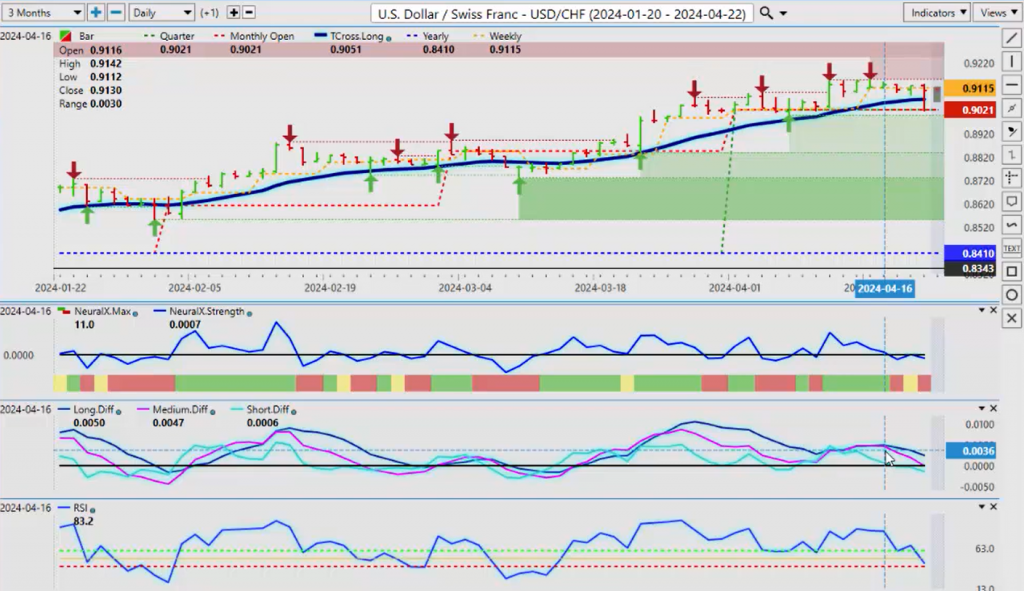
The US Swiss Franc, again, very highly correlated to the US Dollar Index, and that too is warning, or giving a sell signal going into next week, meaning dollar weakness. If we have dollar weakness, we have potentially higher equity markets, which I’ve discussed on here. We potentially have higher oil prices, gasoline prices, but it doesn’t necessarily mean that Gold‘s going to go higher. Gold‘s been tracking the dollar very closely; the two of them being somewhat positively correlated over the last month. So right now, we can see very significant resistance with these verified zones up at the high, 9.15. If we can’t get above this area next week, guys, then there is a bigger short coming on this one. But I would like to see us break down below the quarterly opening, 90.21. I think it would be reasonable to set up sell limit orders below that area in anticipation that we could see some dollar weakness coming.
British Pound versus U.S. Dollar
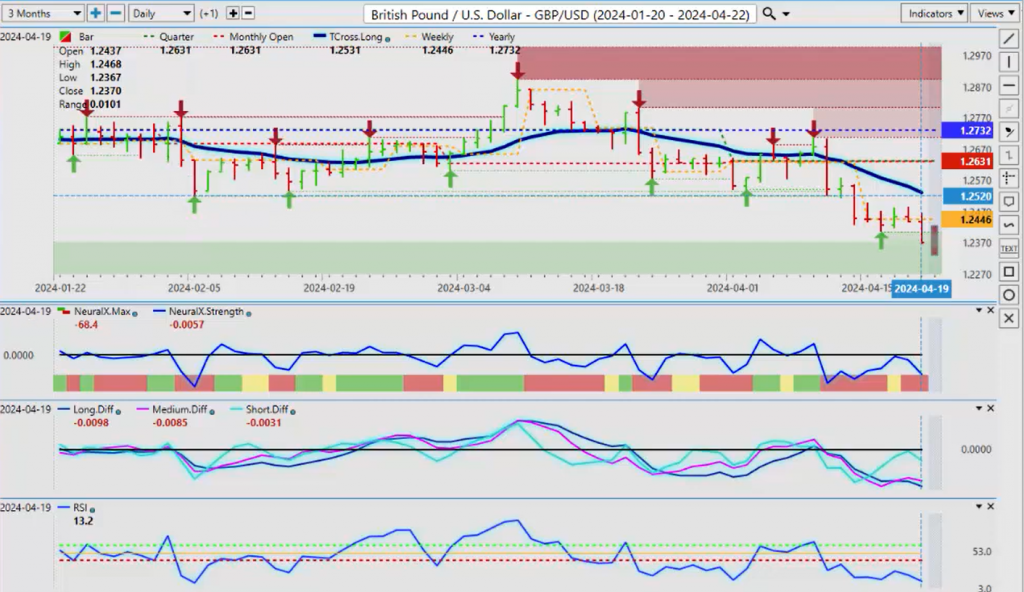
Now, the Pound Dollar, the pound cross pairs did very well for the early part of last week, and then they started to succumb to the weakness. The Bank of England…Number of things, but for now, there is still a very weak buy signal on this, so we’re going to watch the Dollar Index. If it starts—if the Dollar Index can’t retake those highs that I discussed, then it’s going to move lower. It may only be corrective in nature, but that would push the Pound higher to our retracement point, which would be our T-cross long at 1.2531. This is the area we want to keep an eye on. That’s our again, we want to back off the Fibonacci, the Bollinger Bands, and all this stuff, and look at a hard line in the sand that we can actually use. So once again, that would be a retracement point, but we are in a downtrend, 1.2732. We are below the current yearly opening, we’re below the current monthly and quarterly opening, and we failed on the week, but now we’ve closed the week at 1.2370. I suspect there could very likely be a significant reversal coming on this pair back to that corrective level that I’ve mentioned here.
U.S. Dollar versus Japanese Yen
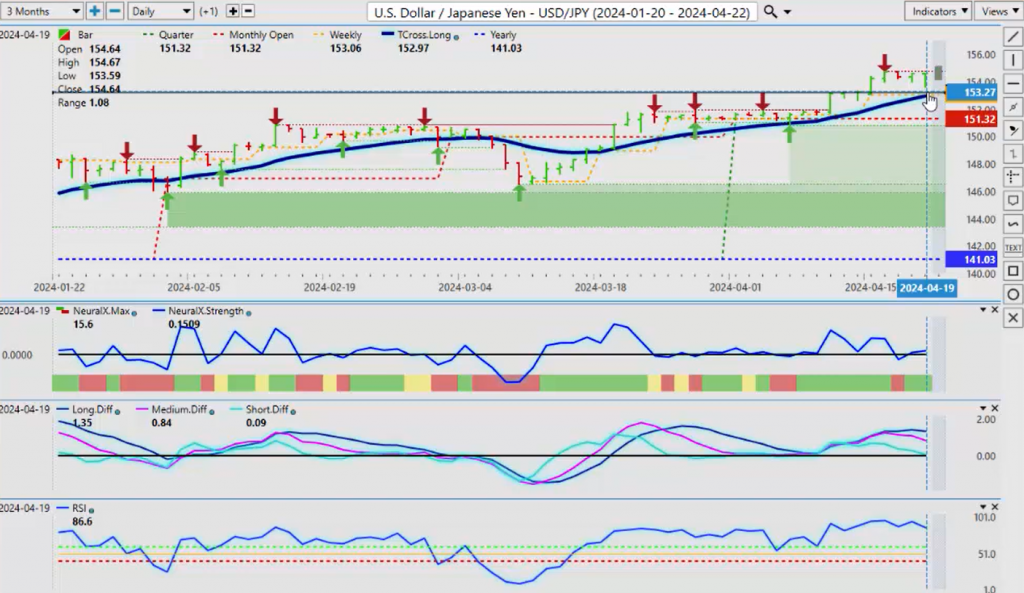
Now the Dollar Yen, once again, I am still expecting the Bank of Japan to step in and intervene at these levels, but as you can see this past week, the verified resistance high is coming in now at 154.78. They’re going to do something to strengthen this Yen. The Bank of Japan has really shot themselves in the foot on this one. I talk about it every week, but I’m not a buyer up here, guys. If you are, then I would stay close to 152.97, the Vantage Point T-cross long, but again, a warning sign that this could be getting ready to move lower on that MA diff cross.
U.S. Dollar versus Canadian Dollar
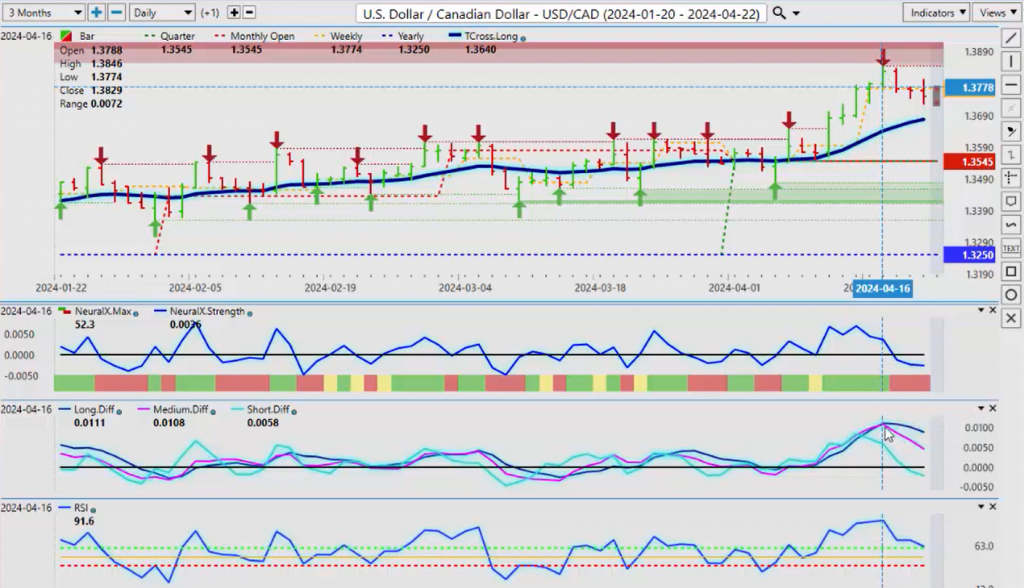
Now the US-Canadian pair, taking a beating at the beginning of the week, again, much weaker data coming out of Canada, likely a recession, and probably in a recession, I would argue now. But we’ve peaked out at the high, and that’s 1.3846. Significant, you can see these dark red clouds hovering up here, and as soon as it moved towards those verified resistance zones that have come from a few years back, we got some sellers coming up here. So unless we can get above 1.3846, then likely this pair is heading lower. And one of the reasons I’ll say that is because of those oil and gas, more the gasoline prices, that tends to boost the Canadian Dollar. But if we look at this very sharp drop in the MA diff cross here, this retracement is in progress, and you can see that there is absolutely zero lag in the way that this indicator works.
Now, if I went back here and I showed the crossover, then the crossover is not confirming that yet, but the MA diff cross gets us in almost on the same day, guys, and this is a fantastic contrarian indicator based on the medium-term strength of this trend against the long-term strength of this trend. The MA, the pink line crossing over the blue line, will get us into this trade very quickly, and I believe we have further downside coming with this particular pair as the dollar begins to soften.
Australian Dollar versus U.S. Dollar
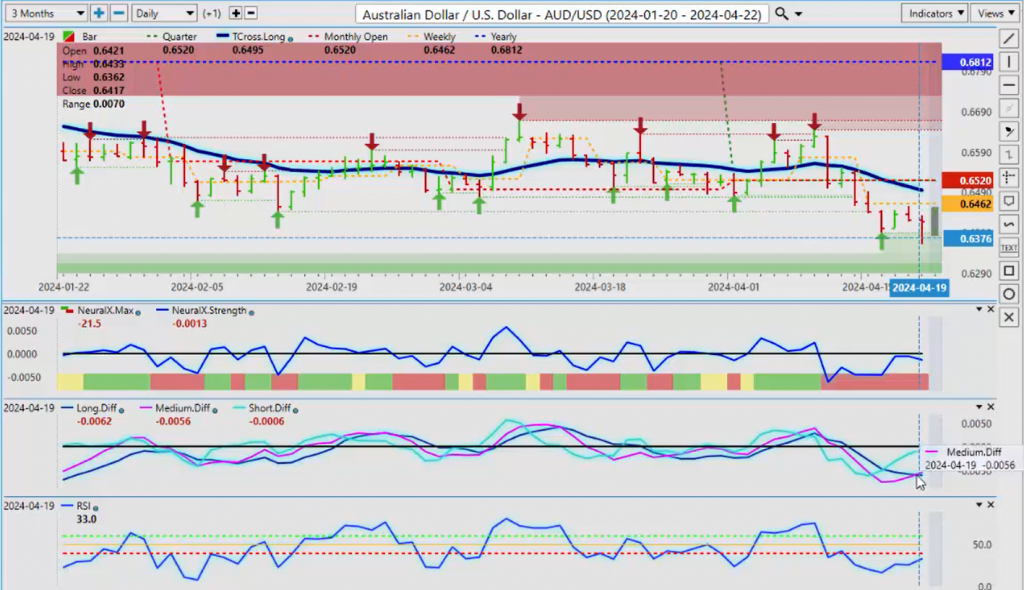
Now the Aussie currency here, hard to believe we have sellers at 64 cents, but we do. But again, I am watching and anticipating a reversal on this pair. So what I can point you to is this signal right here that I’ve discussed through this entire presentation—the MA diff cross is crossing to the upside. The worst possible thing that I could say about this tool is it’s always early to the party, guys. So right now, there are multiple indicators warning that the dollar is not as strong as what people are saying it is. But again, nothing is 100%, but we have a verified support low that’s coming in at 63.9. That’s the area you want to watch next week. You can see we had a false break on Friday; it dipped down below that verified zone but didn’t close anywhere near it; it recovered all of its losses by the end of the trading day on Friday.
New Zealand Dollar versus U.S. Dollar
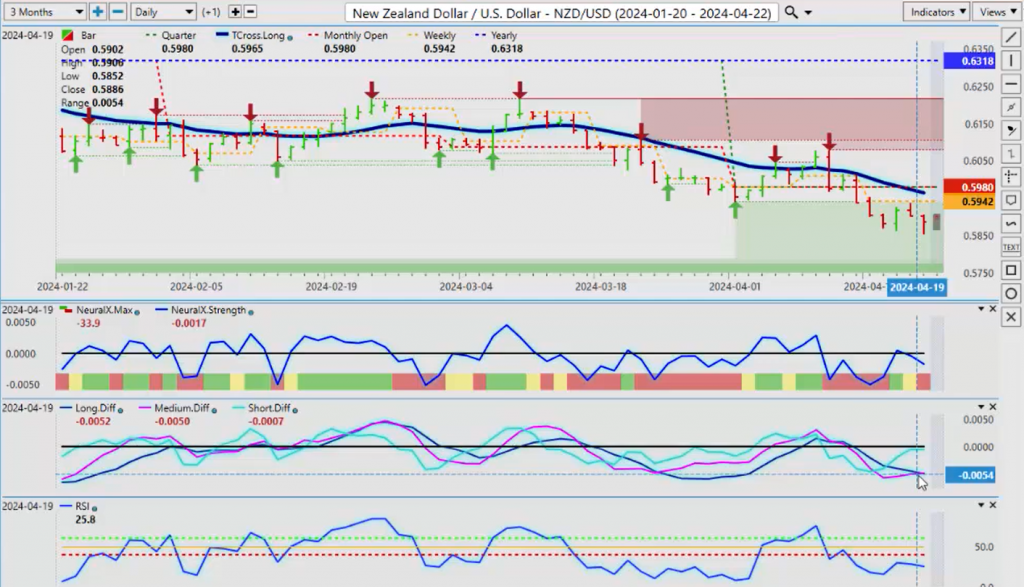
We’re seeing something very similar with the Kiwi. You can see that same signal is trying to form; it’s conflicted; we’re below our T-cross long; the neural index is not in support, it’s in progress. So we’ll keep an eye on this one during the week, but I would simply argue in this scenario that I could go like this on Friday and say, okay, 58.55, if we can’t close below 58.55 next week, then we’ve got a long here, we’ve got a buy. So we keep an eye on the Dollar Index.
If the equity markets recover, that will support longs on the CAD, the New Zealand Dollar, and the Aussie, and potentially the Pound and the Euro. They’re all tied together. We will have another busy week, but again, one of my favorite weeks because we’re in Fed blackout.
So, with that said, this is the VantagePoint AI Market Outlook for the week of April 22nd, 2024.