


VantagePoint AI Market Outlook for the Week of April 6, 2020
VIDEO TRANSCRIPT
Hello, everyone, and welcome back. My name is Greg Firman, and this is the VantagePoint AI Market Outlook for the week of April 6, 2020. Now, to get started this week, we’re going to do things a little bit differently. We’re going to do a market recap of what we talked about in last week’s Forex weekly outlook and we’re going to look forward into what’s likely going to happen this next week.
Now, in last week’s Forex weekly outlook, I talked about the monthly seasonalities of the strength in the dollar. Now, somewhat comical, one of the comments, and I enjoy the comment section of this very much so, but one of the comments was, “Stop with the short term analysis. The dollar is going lower. That’s all there is to it.” I can’t help but find that somewhat comical when we look at the actual outcome of what happened last week.
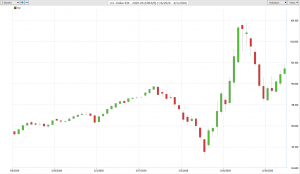
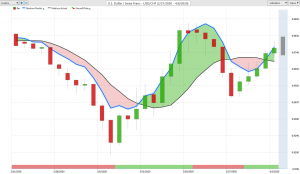
U.S Dollar Index
Here is the move from the dollar. As I had stated in last week’s Forex weekly outlook, that it is very likely that the dollar is going to go higher this week. This is not short-term analysis. This is a weekly outlook, not a yearly outlook or a quarterly outlook, a weekly outlook. So when we’re talking about what’s going to happen in the next week, currencies are not like stocks. They move 1% of their value per day, and they’re very stable. You’re not having these big wild moves, where the dollar is just going to sell off in the matter of a week.
So what I have stated very clearly in last week’s weekly outlook, that in the first week of the new month, the dollar is very strong. We can see from last week’s trading from Monday to Friday on a single contract in the dollar index, the dollar index was up 2.75%. A single contract returns $2,530 based on that analysis. If we were buying one contract a day or five contracts overall, that’s a $12,650 profit. A very, very good move.
Now, this is the problem. Retail traders don’t see this. They think that because of the current situation, the dollar is just going to sell off and the dollar is weak. But in actual fact, when we look at our longer-term charts, there is nothing to substantiate such a comment. The dollar was very weak all the way until 2008. The dollar is bottomed out in 2008 and for the last 12 years has been going higher, 10 to 12 years it’s actually been going higher in a relatively strong move.
So what this tells us very clearly is that in a risk-off environment or in a high-risk environment like we’re in right now, the dollar actually shines. So selling dollars is not a very good play, and that’s what your more experienced traders will tell you or that they already know. Retail traders, however, they like to talk about this, talk about that, look at the long-term view. But this is the reality is, is that the monthly, the cycle on the dollar is still there. There is demand, real money demand, for US dollars in the first week of the new month.
Now, as we go into next week’s trading on the dollar, we can see we’ve got the medium-term crossing the long-term predicted different starting to move higher. What I’ve also seen and what I will also warn the viewers again today is that usually after the nonfarm payroll number in the middle of the month, the dollar is a little softer because the demand dries up. That’s how Forex trading works, guys. We’re either buying or selling US dollars. That’s the basis.
So the analysis going for next week would be we’ve got our T cross long 99.88. Just like last week, I’ll show you those pivot areas that you need to watch. 99.88, as long as we stay above that particular level, the dollar will remain strong. When we look at the key VantagePoint key pivot area, that’s coming in at again, 1.0114 very, very strong. But as you can see, the dollar has basically gone up for five straight days from last week’s weekly outlook. A very, very strong move. If you know what you’re looking for, you would have been very, very profitable last week buying dollars, which I’ll show you guys throughout the course of the presentation.
S&P 500
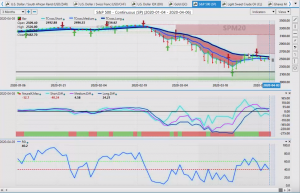
Now, with the S&P 500 for next week, once again, these key VantagePoint pivot areas coming in 25.56. The entire week we’ve been jammed up along this area, and we’re struggling. Right now, we’ve got our medium-term crossing our long-term predicted difference down with the neural index. So the key levels that we want to watch is again, 25.56. We’ve got verified resistance at 25.90. We must break through these levels if we’re going to go higher. Again, if we look at that key VantagePoint pivot area, that level’s coming in at 24.91. If we start slipping below that level, the downside is likely to accelerate.
Now, oil has had a bit of a boost up again from last week, some of the rhetoric and the talk with the current administration in that. So oil is pushing a little bit higher, but my optimism on any further gains in oil remains heavily guarded, particularly if the S&P 500 sells off. So we’ll watch this high level very closely at 2840, 2849. If we can push above 2849 we’ve got a shot at our next target, which would be back up in the 36 area. But again, usually, when oil moves or anything moves up on headlines, it’s unlikely to stay.
Gold
Now, as we look at gold, once again, last week, gold has come down, a little soft midweek. Gold and the US dollar moving up together from Wednesday to Friday. A very good move up in gold. But if you understand these pivot areas using the predicted moving average, these levels are quite easy to pick out. You can let the market come to you. 1596, a key level here.
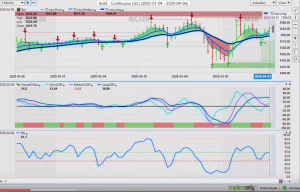
o again, going into next week’s trading, it’s a weekly outlook, guys. It’s not a quarterly or a yearly outlook. All trading goes from week to week. We have cycles that go from week to week based around demand. The market is only trending 20% of the time. 80% of the time we have the sideways trade. That’s where we make our money, right? So watch the level on gold very closely. That’s coming in at 1604. The additional key level there, our predicted moving average, coming in at 1623. As long as we’re holding above these two levels, we could move higher. But again, we’ve got that medium-term crossing the long-term predicted difference, which is a warning sign. But you can see the neural index is not in support. So gold still holding for now.
Now, as we come into our main Forex pairs, once again starting the week based around last week’s weekly outlook, which was not a recap, it was an outlook saying what is likely going to happen, the primary theme that was discussed in last week’s Forex weekly outlook is that the dollar is likely to strengthen. Again, that point was argued, saying that the dollar is in a big downtrend, the dollar is going to no longer be around. That’s just utter nonsense, guys. That’s all it is.
Euro/USD (EUR/USD)
Now, as we come into our main Forex pairs, once again starting the week based around last week’s weekly outlook, which was not a recap, it was an outlook saying what is likely going to happen, the primary theme that was discussed in last week’s Forex weekly outlook is that the dollar is likely to strengthen. Again, that point was argued, saying that the dollar is in a big downtrend, the dollar is going to no longer be around. That’s just utter nonsense, guys. That’s all it is.
When we look at this, very little has changed. Governments have to buy US dollars at certain times of the month. That’s why we identify these monthly seasonalities. That’s why longer-term seasonal traders are actually quite good also, because those seasonalities are very repetitive. So when we look at the euro from the open of last week, prior to the weekly outlook coming out, I had stated that the dollar is likely to strengthen. That moved down 3% on the week, 343 pips. On a single contract that’s $3,176. Five contracts or one contract a day would net you $15,800 in the Forex market based around last week’s recommendation.
Now, again, that is solely based around buying US dollars, not selling them. So when we look at our key levels now for this week, we need to stay below 107.82 if this downtrend is going to continue. But as I’ve said, usually after the nonfarm payroll number, a couple of days afterwards, the dollar starts to soften again. So if you’re going to sell dollars midweek, that would make more sense based around these seasonal monthly patterns that I’ve tried to identify. Again, remember guys, this is a free video here. This is analysis of the market from an experienced trader’s point of view.
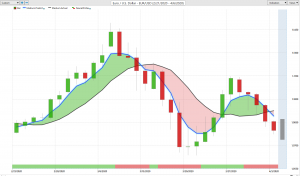
So when we look at this, again, we’ve got major, major support down here. There’s a lot of problems in the euro zone. European Union may be breaking apart. We don’t know. So once again, when the US economy sneezes, the rest of the world catches a cold. Okay? So remember that. I’ve shown you guys what happened in 2008. That strengthened the dollar. It didn’t weaken it. The dollar was going into free fall in 2008, and it’s been going up ever since. Right? So now we’re in another major risk-off environment here. That is not an environment to be selling dollars for the most part.
So we’ll monitor this down here, but if we look at our F8, our key pivot area to start the week will be one 107.87. As long as we’re holding below that level, shorts are feasible. Be careful down at this verified zone at 106. If we’re going to bounce, that’s likely where it is.
U.S. Dollar/Swiss Franc (USD/CHF)
Now, if we go to the US Swiss franc, again sticking with the recommendation from last week’s weekly outlook, the open of the market on US Swiss Franc. From the open to the close on Friday based around buying US dollars netted 2.6% over those five days or 254 pips. A single contract will net you $2,600, but five contracts, or one contract a day, will net you upwards of $13,000 buying US dollars. So once again, a very good trade. It looks like we have additional upside here with our medium-term crossing our long-term predicted difference. But once again, be very cautious towards Wednesday and Thursday. That’s when the dollar is going to weaken if it is going to in this current environment. If we look at our F8 using our VantagePoint software, we can see our intraday pivot or daily pivot area that we need to hold above is 97.84. That level is updated daily in the VantagePoint software, and we can see how accurate that actually is.
British Pound/U.S. Dollar (GBP/USD)
Now, once again, if we look at our pound dollar from last week, keeping the same methodology that we talked about, that I talked about in last week’s weekly outlook, we can see that again, from the open of the week to the end of the week, we are down 1.3% or 162 pips. That’s $1,317. Or on a five-contract, one contract a day basis, that’s $6,585. That’s one heck of a trade. Looks like we have further downside on the pound dollar here also, but we’re sitting on a key VantagePoint pivot area. That would come in at 122.70.
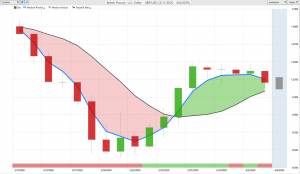
How I would play this, guys, again, it’s not about being right or wrong, it’s understanding the market. Right now, we have a key VantagePoint pivot area at 122.70, and we have a verified resistance zone that’s coming in at or about the 124.84 area. A break on either side of that level will trigger likely a bigger move. That’s what we would be watching for. Right now, it looks like the pound has further downside.
U.S. Dollar/Japanese Yen (USD/JPY)
Now, with dollar yen, the dollar yen, the one we were supposed to just go ahead and short it right off the open, well, if you went ahead and shorted that right off the open, one thing, the first thing I’ll tell you is that if you did that, I was the one that was on the other side of your trade on the long side of that. We see the clear outcome from that. When we look at this from the open of the market to the close of the market on Friday, we’re up 113 pips or $1,045. Over five contracts, that’s $5,225. All of this can be verified from last week’s video weekly outlook, what were looking at for the week, the dollar strength, all of these things.
So while other people are arguing about the US dollar is going to go down, it’s not going to go up, it’s not going to survive, we’re ignoring all that nonsense, and we’re following the VantagePoint indicators for these kinds of profits. That’s what we want. So going forward into next week with the dollar yen, it would be more likely that it would be this week that the dollar moves, the dollar yen moves lower, not last week. The reason I say that is that if the S&P 500 cannot break through that level I discussed, then the S&P 500, if it goes lower, it will pull dollar yen down with it. It’s about the equity. It’s not about the US dollar. That’s what the yen follows. So always remember that.
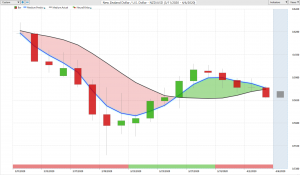
U.S. Dollar/Canadian Dollar (USD/CAD)
If we look at the Canadian dollar, we see the exact same thing here, guys. From the start of last week’s weekly open, I had stated again that this is a week where we will see US dollar strength. If you were following that methodology, you’re up basically 1.8% on the week on this pair too, or 251 pips. A single contract is $1,769. Five contracts nets you $8,845. Well, if this is short-term trading, guys, I’ll take it all day long. Okay? Again, it’s understanding the rhythm of these markets and how they work. Right?
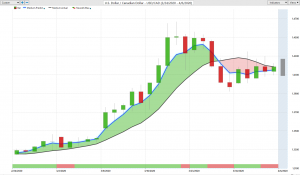
So when we look at it going forward into this week, the US Canadian pair, that key level comes in at 140.59. As long as we’re holding above 140.59, longs are still viable. We have the medium-term crossing the long-term predicted difference. We’re looking for this to continue to advance. Now again, when we click on our F8 in our VantagePoint software, we can see we have the additional, the blue line by itself. That pivot area is 141.88. We’re closing the week again at 141.86 ,so it’s a little shaky here. So watch the additional level down around 140.56.
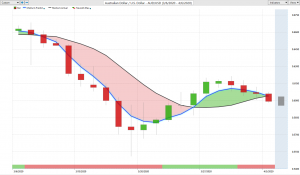
Aussie/U.S. Dollar (AUD/USD)
Australia US, guys, the same concept as we talked about in last week’s weekly outlook, which is not a short-term outlook. It’s a weekly outlook. Trading is determined from week to week. If you’re a buy-and-hold trader, then this is probably not the best environment for you because again, you’ve got very high volatility. If we look at this trade from last week, the Aussie US pair is down 2.9%. The Aussie currency is so weak against the dollar, it can’t even hold, it can barely hold the 60 cent mark. So to even suggest the dollar is weak is utterly ridiculous because when we look at this, the Aussie US chart, if you look back at the Aussie US chart over the last even two years, this chart is pretty clear here. For the last two years, the Aussie US has been going down.
So if the Aussie US has been going down, then obviously the US dollar is strong, not weak, over the last two years. Right? So when we look at this right now, the Aussie single contract, guys, $2,987. One contract a day or five contracts off to start nets you $14,935. Pretty good deal buying US dollars, isn’t it? So when we look at this, guys, this is what we’re looking for, this kind of move.
So next week our plan here is we watch the 61.02 level. The VantagePoint, AI T cross long 61.02. If we get back up above that, the pressure’s off the downside short-term. The additional level you can look at here is, again, this pivot area right at the 60 cent mark. We’ve closed at 59.91. I know that it seems unconscionable that we would be shorting this pair at 59 cents or 60 cents, but guys, the fact of the matter is it works. Right?
The Aussie US is in a long-term bear trend against the dollar that goes back to about 2011. But if you’re, again, not looking at the short-term and looking at the medium to longer term and combining it with the seasonalities, then you would better understand how this move, why shorts actually do work and why buying US dollars is a good play.
New Zealand/U.S. Dollar (NZD/USD)
We see almost the exact same thing with New Zealand US. If you sold it right off the week based on last week’s AI Market Outlook, New Zealand US is down 3.2% on the week, which is huge for this pair. 194 pips. That’s 32.22 on a single contract. Five contracts nets you $16,610. Hey, I’ll buy US dollars all day long with that kind of money. Right? So when we look at it for next week, what we’re looking at, the key VantagePoint level, 5968. We’re watching that key level very, very closely. If we break back up above that level, then the pressure may be off the downside, at least in the short-term.
When we click on our F8, once again, these are very easy to replicate strategies, guys. This is a pivot area. The long-predicted, that’s coming in at or about the 59.17 mark. So we’re looking at this again for the market to stay below that. If it stays below that level, then we will likely see further downside on additional US dollar strength.
So once again, we’re in very unprecedented times, but these strategies that we talk about here on the VantagePoint channel, in the VantagePoint live training room are highly effective when you know what you’re looking for. So with that said, this is the VantagePoint AI Market Outlook for the week of April 6, 2020.


