



Welcome to the Artificial Intelligence Outlook for Forex trading.
VIDEO TRANSCRIPT
VantagePoint A.I. Market Outlook
Okay, hello everyone and welcome back. My name is Greg Firman and this is the Vantage Point AI market outlook for the week of August the 24th, 2026.
US Dollar ($USDU)
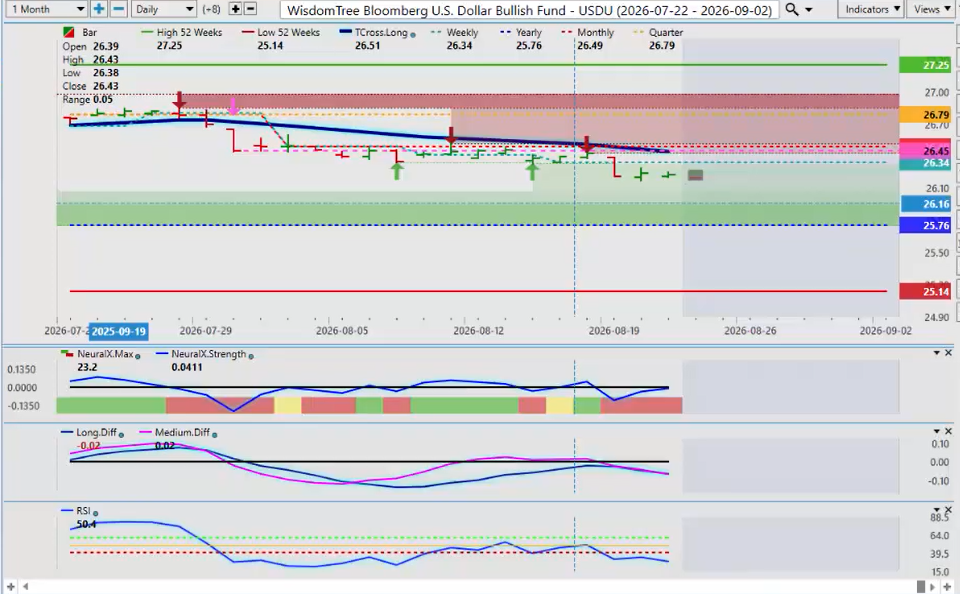
Now, to get started this week, we’ll begin where we always do with that very important US dollar. Now, the USDU is being used because it takes a broader look [snorts] at the US dollar, not just the like the dollar index where it basically is mainly focused on the euro. So, for now, we remain positive on the calendar year. Definitely the dollar under pressure with the uh the Treasury’s debt buyback program that was uh came out of nowhere this past week affecting the the dollar obviously affecting Bitcoin and gold. These are not seasonalities guys.
These are fundamental events which we’ll discuss on here today. So for now 2576 is a very key level for the dollar index and for this particular ETF. In most cases, the US dollar is strong in the month of September for again a fundamental reason that a seasonal can that can identify meaning that the US fiscal year end is in September is on September 30 or the month 30th the month of September and basically there’s a large demand for US dollars to settle trade balances to close the books for the year and that’s why I found the Treasury department’s uh I found it very interesting their timing on the debt buyback program knowing that that would weaken the dollar that would actually give them uh potentially the opportunity to pick up cheap US dollars. So keep that in mind guys. But for now uh the dollar is still holding firm above that calendar yearly opening.
Gold ($XAU/USD)
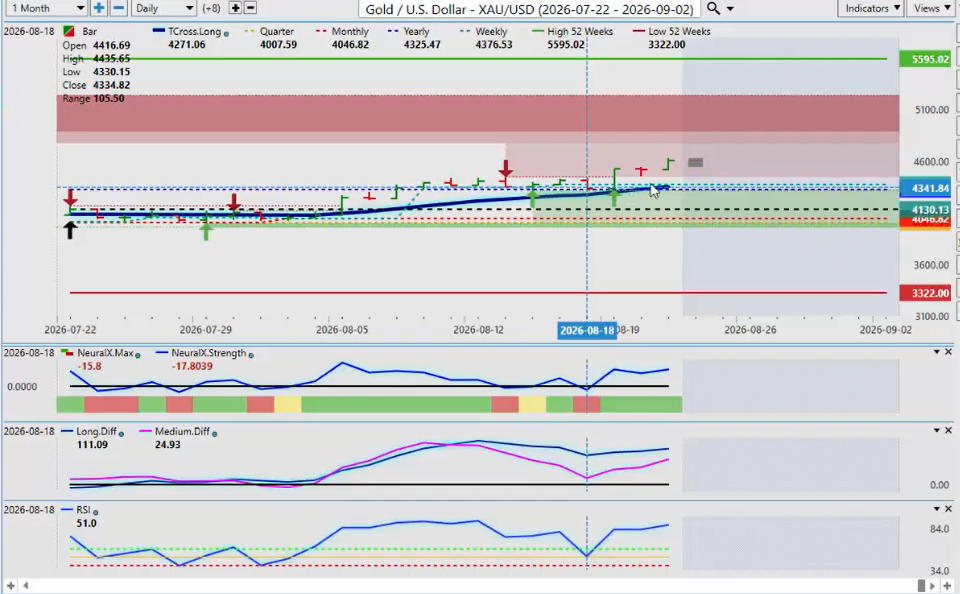
Now last week with gold I had mentioned exclusively that uh in most cases most cases not all the gold doesn’t do that well or I would not be a buyer of gold into the end of August or September that I would normally prefer to pick that up in October. Now again, as we can see, this past week, we were we retraced back to the calendar yearly opening price, the level that I talked about in last week’s outlook and said that’s the level you need to focus on. And if we can hold above it, then gold will extend higher. But as you can see, it was moving lower and then in comes the Treasury buyback uh the debt buybacks from the Treasury Department and that immediately sent gold higher. Now, what I do find interesting about this particular move, which I’ll talk about in a minute, is that gold has about a 95% positive correlation to the euro.
The euro has not breached its yearly opening price at this point. But once again, when we look at that, and I did state very clearly that this is a positive development. We’ve moved above the yearly opening price right here. uh and again we’ve extended higher but there this is a double-ended sword for the treasuries uh department here because in my view and I’m watching the Fed funds very very closely and they ticked up meaning the there was basically very little possibility of a rate hike in September and I still don’t think there is but this uh buyback debt buyback program that could trigger a rate hike And that would be positive for the dollar, negative for Bitcoin, negative for gold, and potentially negative for the equities. So, it’s going to be very interesting to see how this one plays out. But for now, as I [clears throat] stated last week, uh, and again, one of the reasons I had mentioned this too about August is that Vantage Point uses advanced seasonal technology.
In my respectful opinion only, uh 20 years is is becoming uh there’s lag in a 20-year seal. Vantage Point’s new seasonal tool can come down to as starting a starting point as little as 5 years. Very much like the difference between say a 200 day moving average and a 20-day moving average. The we’re getting the lag out of it. Now again, Vantage Point was also positive on gold this month, but it had hit its price targets as of last week, and that’s why I mentioned that.
Uh, and again, I would encourage everybody to come into the Vantage Point live training room. We we do gold, the dollar, forex pairs, stocks with this advanced technology every single week. uh but again the retracement point now for gold and this [clears throat] is one big positive that I will say for gold when the T-Cross Long crosses over the yearly opening price which is what occurred this past week that is normally very bullish uh so September could it be a better month for gold possibly but again watch out for any talk of rate hikes and the best advice I can give you is keep a very close eye on Fed fund futures and see if they tick up over 50% in the coming in the days and weeks ahead.
Global X DAX ($DAX)
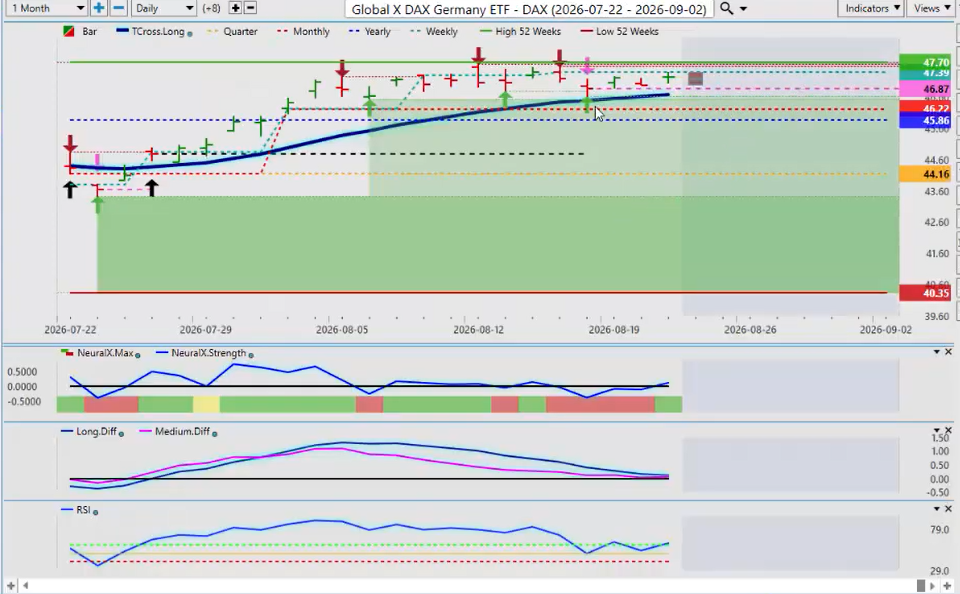
Now, with the Global X DAX, uh once again, it’s moving higher. It it actually has performed very well this past week. Uh we’re made a new 52- week high yet again back up here on the 17th. Now, our T-Cross Long here is coming in at 4667.
Now again with this type of trade setup in your vantage point software there there it’s very objective. We have our T-Cross Long is our key level. Then we have our yearly opening price to identify the primary trend. Then we can identify how we’re doing on the quarter and how we’re doing on the month by using that opening price. So we’re positive on the quarter, we’re positive on the month and we’re positive on the year while at the same time above the single predicted moving average. There’s very little to be confused with this and and that’s what I would point out here guys.
So again when we’re we’re looking at the different markets it is important that we identify what the market is doing not what a partic necessarily what somebody’s opinion is or series of of indicators. we have to look at those opening prices uh because often it will it will be a potentially that needle in the haststack that we’re looking for to to identify the trend. So right now the DAX does look pretty good.
Invesco QQQ ($QQQ)
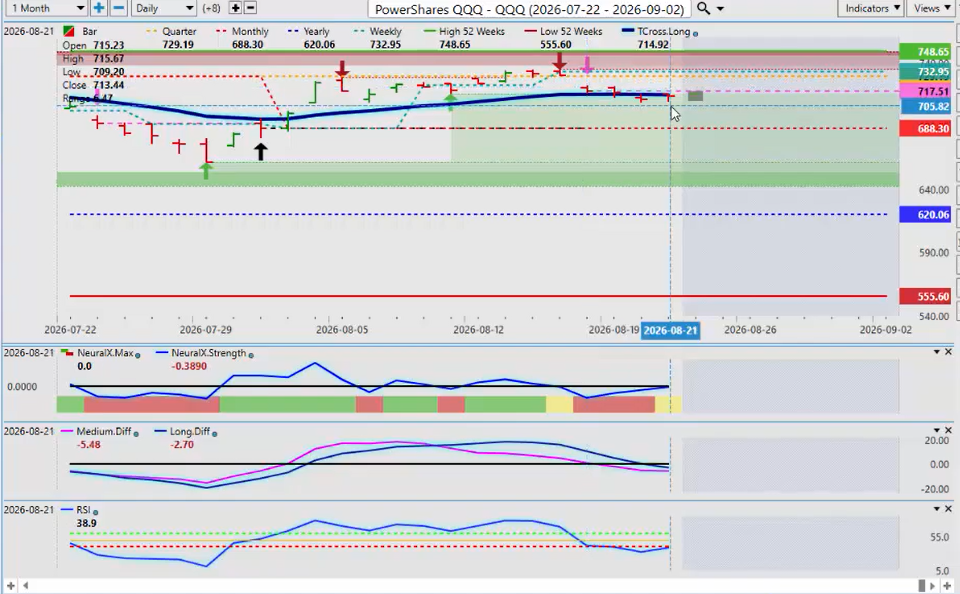
Now the Q’s when we look at the Q’s I’m a little surprised by this one after the big move up bit Bitcoin being of course the big winner this week. uh gold coming in number two to Bitcoin. But both of them again it proves that theory that that Bitcoin is potentially a digital gold and it does positively and inversely cor correlate itself to gold but it’s nice to see them both going up. So right now with the Q’s uh I would expect some type of rebound here. Uh but the the indicators and the seasonal pattern on equities equally not a great month for the equities.
If we look back at the Q’s one year ago, you can see that last year we got a bit of a boost in September there and it was all based around very similar to where we were right this year in 2026 is very similar. We’re all talking about rate cuts. But again, did that debt buyback program could that alter the path of the new Fed? Yes, it actually could. So again, last year in September, the Q’s did relatively well actually uh and again but Bitcoin was also in a in a bull market last year at this particular time. So I believe the Q’s either way will do just fine come midepptember and October.
But for now, we’re struggling a bit. But again guys, let’s identify the primary trend both on the monthly and on the yearly. The Q’s the calendar yearly opening price is 6206. The primary trend is up. The monthly opening price is coming in down here at 68830.
Again, the primary trend on the month is still up. These are retracement points, guys. Uh but the but again, my only concern is we’ve slipped below the T-Cross Long at 71492. I would like to see us get back up above that.
SPDR S&P 500 ETF ($SPY)
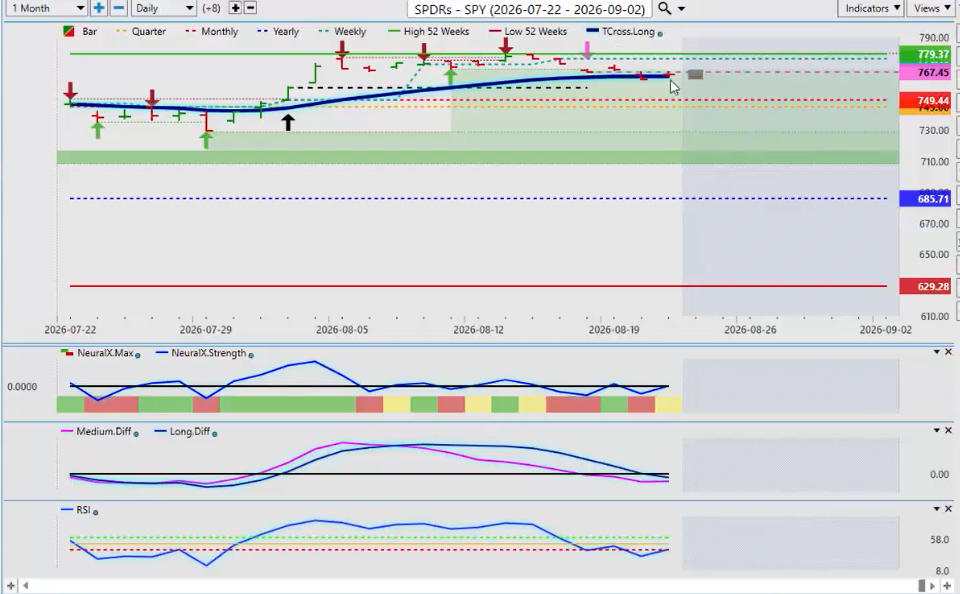
We’ll see something very similar with the SPYs, but the SPYs are a little tricky. You can see how they closed just above the T-Cross Long at 764.95. Now, I do prefer personally that’s just personally I do prefer the SPYs versus the Q’s because it’s a little less volatile. Uh but the primary trend here actually the SPYs are a little bit stronger than the Q’s. But you can see once again we have a medium-term and a long-term crossover to the downside.
But this is why it’s very important. And again, if you look at my indicator list on here with the triple cross, you can see that I’ve removed the short and the medium. I don’t want any confusion. I want a line in the sand here, guys, to say, okay, if I can break down below this and stay below that level for two days, then and only then would I consider shorts. But that’s a very tricky uh way to do it, guys, because the primary trend is clearly up.
Bitcoin ($BTC/USD)
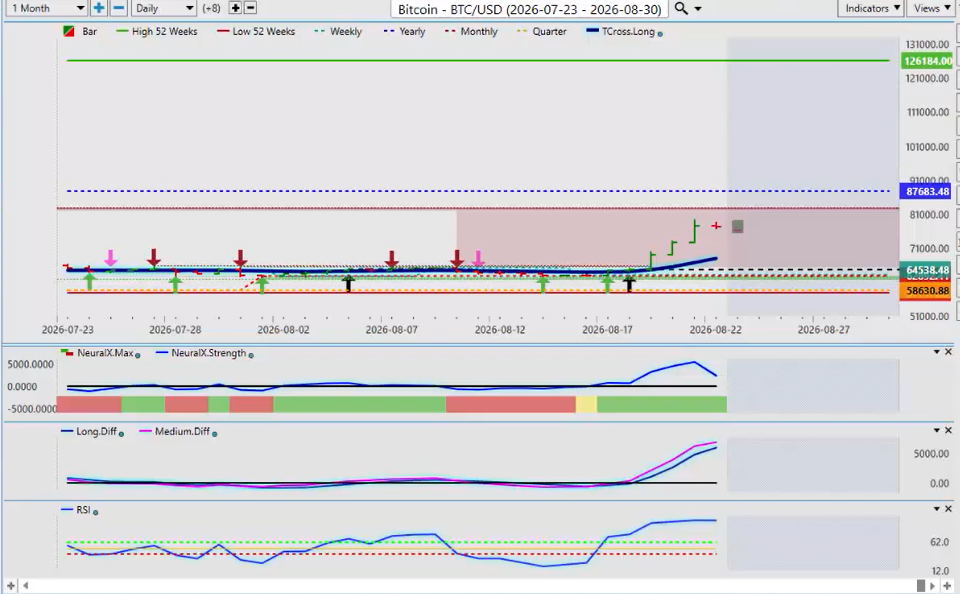
Now, again, the big winner this past week is Bitcoin. Now, Bitcoin, uh, again, what I would like to point out here, guys, is I talked about last week that we’re we’re coming to the end of of a bare market on Bitcoin. There was several analysts the other week, uh, just two weeks ago actually, that were calling for Bitcoin is going to 10,000, quantitative computing will kill it, blah, blah, blah. And I’m like, no, no, no, no.
There’s a very clear seasonal pattern in Bitcoin over a longer period of time, 3 years up, one year down, three years up, one year down. And I found it very interesting on Monday that we we closed above the T-Cross Long and we we we’ve got a bullish hack and she signal and next thing you know Bitcoin starts climbing before the not after but well it did after too but it was already on the move prior to the Treasury announcement of the of the debt buyback.
So what I will point out here is again we’re still negative on the year 87,683. I believe we will get above that area by year end. I believe that next year the next three years going forward will be very strong years for Bitcoin and gold. Yes, I think gold can follow it. Maybe not at the same speed but very similar.
Uh so again our retracement point is our T-Cross Long 67,826 but just remember guys the primary trend on Bitcoin is still down while below that critical yearly opening price. The indicators in VP are starting to roll over and turning flat. There was a big shock to the market when they came out and made the announcement on Wednesday. Uh right out of the gate, Bitcoin went screaming higher. But be careful going forward until we get confirmation that the trend is going to shift. And that way we would do that is by breaching and staying above 87,683.
Euro versus US Dollar ($EUR/USD)
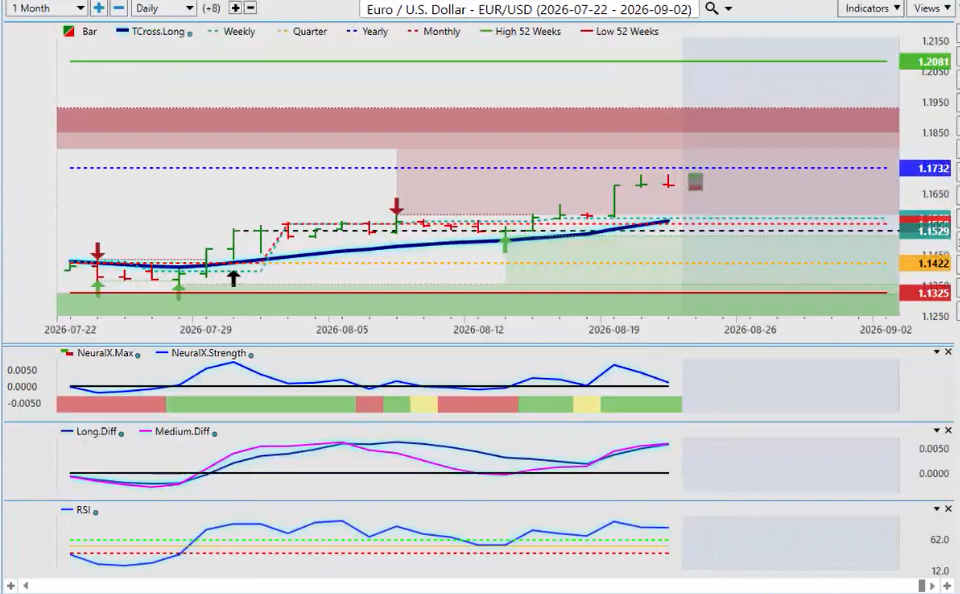
Now the Euro US as we enter the forex market this is where things get interesting guys. When I’m buying gold I am buying Euro US. The the two are literally joined at the hip. And I was a little surprised this past week after gold made the big push with Bitcoin that Euro US did not. So I believe the market could be thinking a little bit further out on this saying uh is this buyback debt buyback program good and or is it bad? Which one is it? And could that trigger the Fed to start hiking because of inflation? Well, we’ll see.
But right now, uh, this is either a very, very good short or it’s a very good long, but we need to get above 11730. So, what I always like to do, guys, is give a little bit to the bulls and a little bit to the bears. If you believe this is going lower, 11732 is your key level to sell at. If you believe that this is going higher and we need gold to continue higher, equities and Bitcoin, we need all of those going up to support the euro. Then you put a buy stop order above 11740. If it breaks up above there and gold is still rising, then you’ve got yourself a very good long trade. But if gold starts stalling out, that is a key driver of sending the Euro US lower.
Another one what I affectionately like to call is the poor man’s seasonality is we go back each year from this date and see what it’s done and you can see it was very very choppy but the euro did actually rise last year on almost the exact same fundamentals and that was the Fed cutting right so again I would be very very cautious uh assuming that the US dollar is just going to go lower because there’s a lot of things that are not Being said, if we look at the US economy, the business sector, it’s booming, guys.
So, uh again, I think that there’s a lot of once again, the media tends to pick and choose what it likes to talk about and it really likes to spin things on Monday morning. Whatever you hear on Monday morning, chances are by Tuesday morning, it they will be saying the exact opposite. So, be very very cautious what you believe in what the media is telling you. uh particularly on certain websites. So with the euro uh again I think I’ve covered that but all of the the bulls and the bears this is where the battle lines are drawn guys 11732.
British Pound versus US Dollar ($GBP/USD)
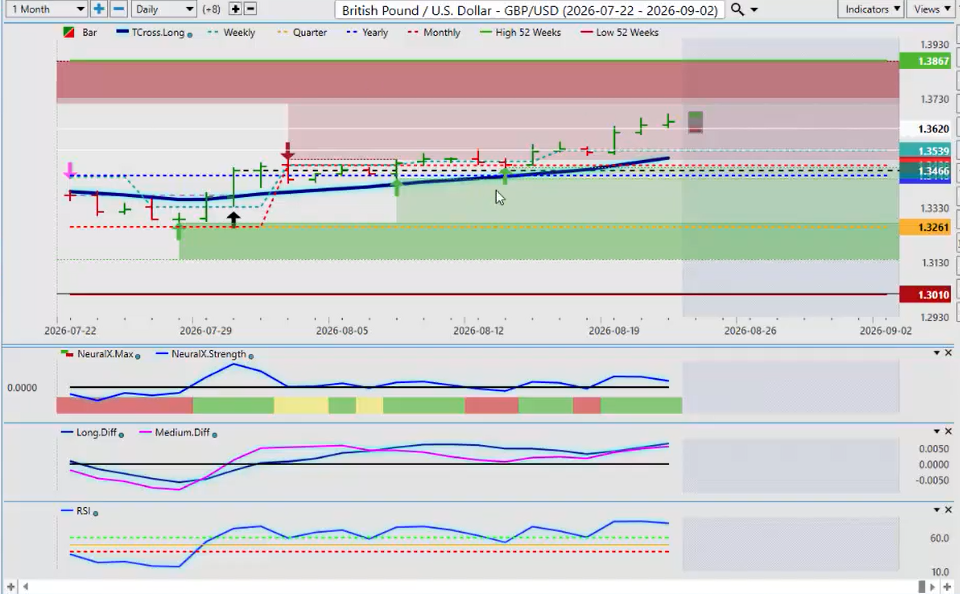
Now surprisingly the pound is made a clean break of the yearly opening price. Now, the stacking on this one looks pretty good because you can see we’ve got the year the yearly opening at 13448 134 134.86. But then the quarterly is all the way down at 13261.
So right now the British pound needs gold going higher. It needs the euro going higher. It needs the dollar moving lower in order to advance. But I believe there will be a potential retracement point here.
Now, one of the other ways that we can do that is when we look at our indicator list in vantage point, uh, I really do like to use the predicted moving averages by themselves. So, I can bring in the long PMA, which is the long-term crossover with just the blue line, and that gives me another powerful layer of support in this particular case. So, that long predicted will come in at 13,583. That is the key level that we would see if we can hold above if this is truly bullish.
So again, uh the indicators are a little bit mixed here. The medium-term predicted difference is below the long-term predicted difference, suggesting we’re losing momentum up here. So your retracement points would then be 13583 [snorts] and of course 13511, that very important T-Cross Long.
Australian Dollar versus US Dollar ($AUD/USD)
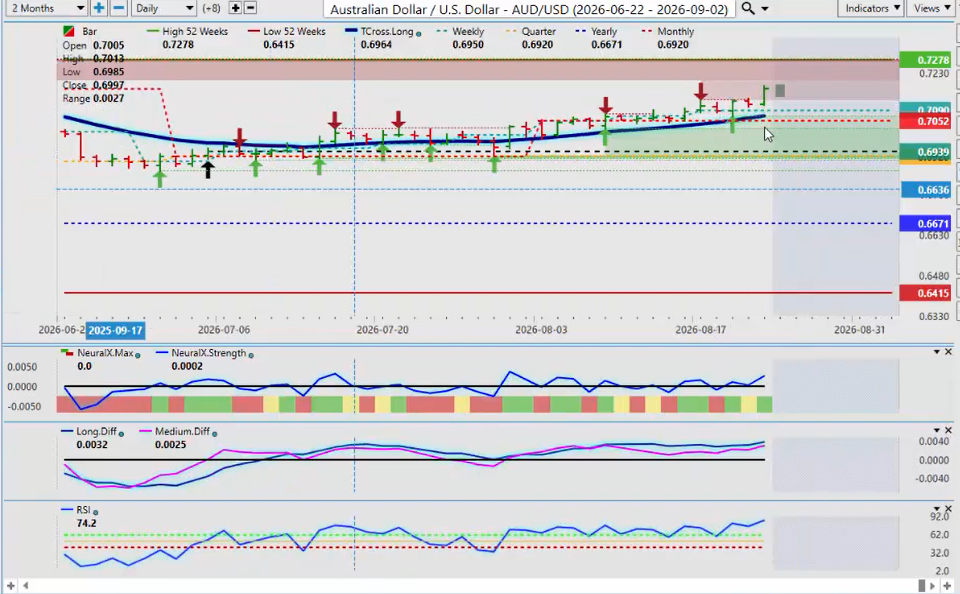
Now, the Aussie US pair. Uh, this has been hands down my one of my favorite long trades in the forex market in 2026. And the argument that I’ve made during this entire period of time is that we have never been below. We’ve never been negative on the year. So, when these pullbacks happen, guys, that is a retracement. That is not a new trend.
A new trend will form when we actually turn negative on the calendar year. But you can see we’re getting uh we’re getting higher highs. We’re uh we’re getting uh higher lows. Uh this is all bullish. Uh but the month of September not always the best month either.
So when we look at it again, last September, all based around the the Fed rate cuts again, uh it it gave a nice boost and and I could argue we’ve been climbing off that level basically ever since. So the Aussie currency remains uh one of the top ones to buy in my respectful opinion only. Uh so what we do is we identify areas in which we can potentially buy from the T-Cross Long 7069. Uh that is a very powerful level.
Now what I can do is go back here in my software click on properties and I can apply that long predicted to everything and say okay well maybe I should put another layer of support in there. And you can see we had a pull back on Wednesday all the way down to the T-Cross Long. Just remember guys, the Aussie is very sensitive to equity moves, right? Came back, hit the T-Cross Long to the number on Wednesday after that extremely volatile trading day after the treasury spoke and then you can see we tapped on the long predicted and then we tapped on it again on Friday.
So again, good buying. We identify the levels 7113 and our T-Cross Long at 7096. Those are two potential entry points. We look at the monthly opening price 7052. This is very very heavy support here guys. And then the primary trend 6671. So again everything looks pretty solid here for this to extend higher.
US Dollar versus Japanese Yen ($USD/JPY)
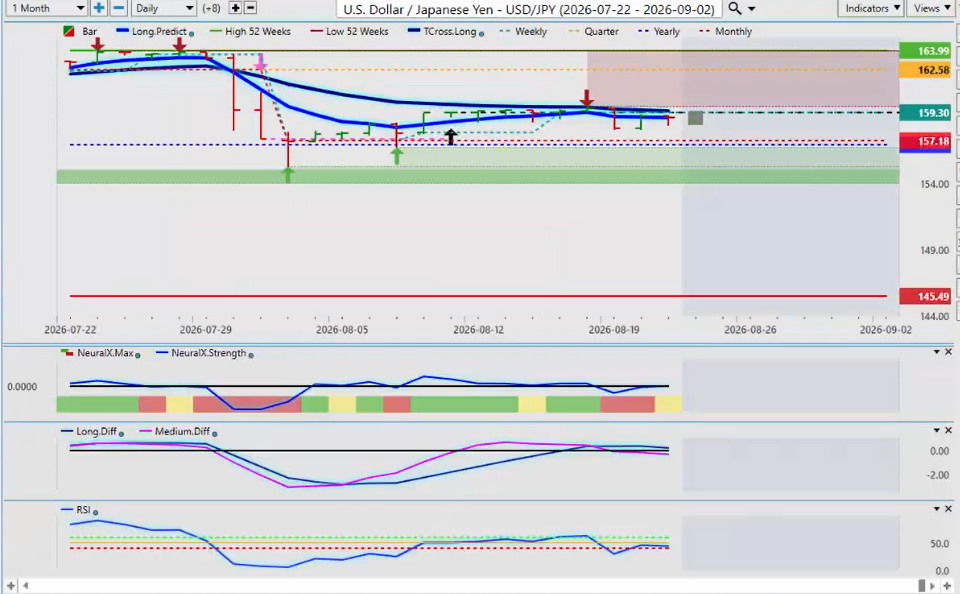
Now with the dollar yen and going back to the intervention this week from the Treasury Department, my view is that no intervention has ever worked. Uh Swiss National Bank, Bank of Japan, probably what the what the Treasury Department did this past week. This type of intervention seldomly works, guys. The importance of the calendar yearly opening price is right here.
This is a joint intervention between the Fed, the US Fed, and the Bank of Japan trying to talk the the US dollar down and try and prop the yen up. Didn’t work, guys. We we immediately rebounded and not one of these days did we close negative on the calendar year. And now we’re rising again. So, if we can break through the T-Cross Long, then you will have another buy on this pair 15943.
It’s very difficult for me to even say that there could be a long trade at at the 159 160 level. But the reality is this is the number one carry trade. That’s that’s a that’s fact, not fiction. The market wants to stay long this pair as long as they possibly can.
And just because of this debt buyback, uh I will again say it, the business side of the US is doing extremely well. And you can research that yourself. It’s not down and out. There’s not none of that is true. So again, watch that T-Cross Long very closely.
Now, with the new uh Vantage Point AI weekly outlook, I’ve I’ve got a lot of uh emails and uh requests to do some ETFs, throw in a couple of stocks and an ETF each week. I’m happy to do that for you guys, but I am going to stick on the metal side of this going forward.
Global X Uranium ($URA)
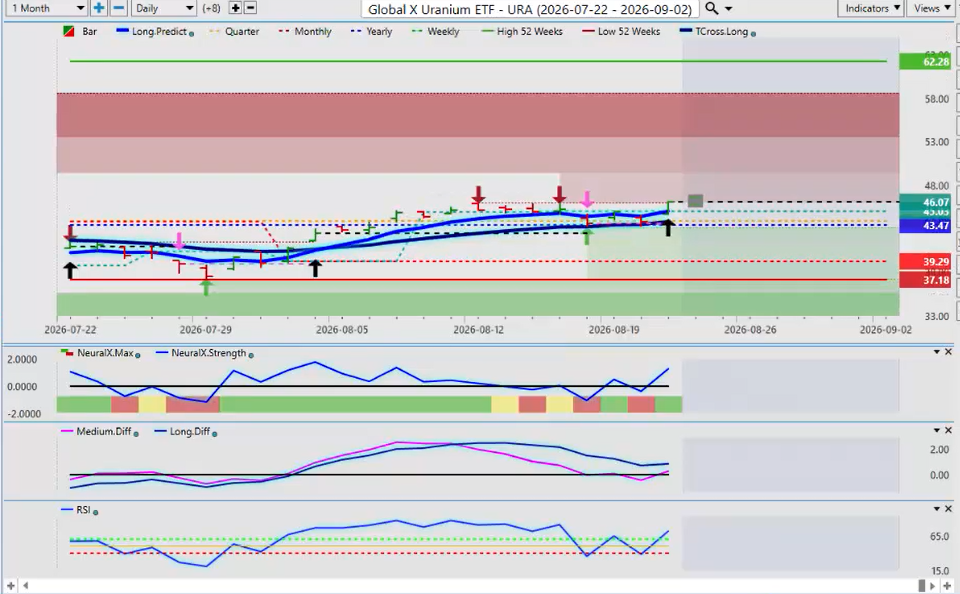
So, Global X Uranium. Now I think everybody’s aware now there is no deal between the US and Canada. So critical me minerals I believe are probably going to spike because there was a veiled threat from Governor Carnage Prime Minister Carney excuse me excuse me uh that um he kind of suggested over on Saturday yesterday that maybe they wouldn’t have access to that.
So that is probably going to cause I think that will indirectly now support your precious metals uh minerals like uranium like gold like silver all these things. So, uh, we’ve got a fresh hacken signal off of the T-Cross Long.
And when we look at this, you can see the medium-term. This is again, guys, uh, and again, this is for educational purposes only, the medium-term crossover. You must break down below the T-Cross Long before you validate a medium-term crossover. Uh, and you can see we hit the T-Cross Long, we got a hackenashi signal, and it was dead wrong. And that’s not a bad thing, guys, because I’ve actually talked about this in the live room. This is the signal we want.
And it’s sitting just like gold was last week, guys. The yearly opening price, which is coming in at 4347. We’re T-Cross Long 43.86 and a hackeny buy signal. As I said last week guys, hackenashi is not necessarily a Japanese candlestick or it doesn’t it’s not grouped in to the Japanese candlestick where there’s so many of them I don’t even know how many. With hackenashi you have three up down dogee that’s it.
So when the hackeni is used with the primary trend the yearly opening price the T-Cross Long the monthly opening you’ve got potentially got yourself a very good-look trade here. uh and it’s fresh and it’s ahead of the market because always remember guys this is an outlook not a recap that of something that happened a week ago two months ago whatever this is an outlook looking for opportunities for next week and you really you utilizing some of the more powerful tools in the VP software so right or wrong good bad or indifferent this is a very good trade setup and I do like to give potential price targets with these things too.
And I believe uh potentially we have a good shot and this is not I would argue that this is not a oneweek trade guys. I think we might be looking at a couple of months out of maybe even longer out of this one. But 6228 the 52- week high is absolutely a target going forward over the next several weeks, several months. So I would look closer at this one.
And again, the VP indicators are now back on the right side of the trend here again picking up on that volatility. And but again, without it breaking down and closing below the T-Cross Long, then that signal has not been validated. And again, the on that bearish hacken, you got the yearly opening and the T-Cross Long sitting right there. I am not trading against those two indicators, guys. I’m going to trade with the market, not against it.
Viper Energy Partners ($VNOM)
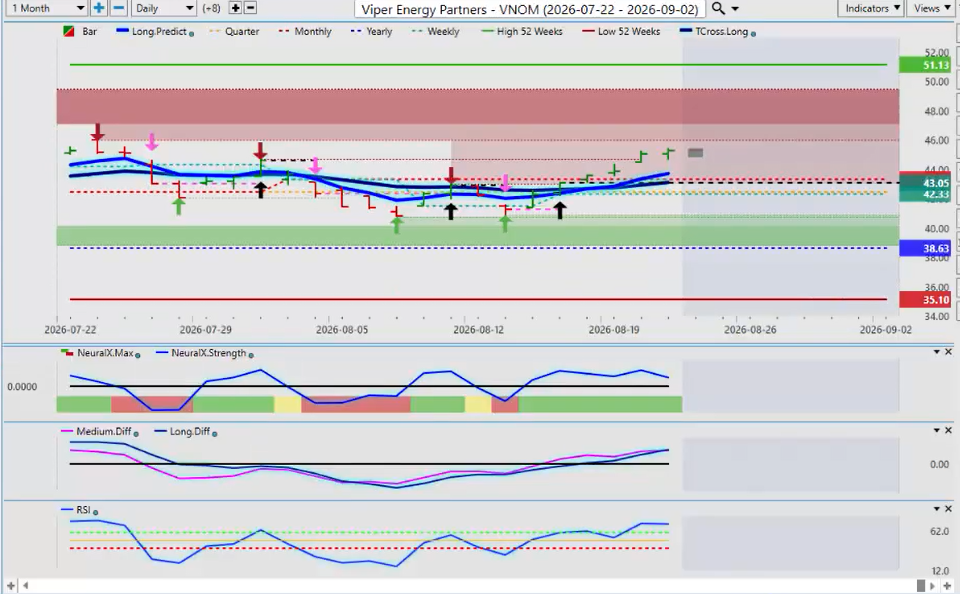
Okay. Now, Viper Energy Partners, we’ve been doing this one actually in the VP live training room for for probably about a week or two now. A couple of different buy signals have come off of this. Now, remember, identify the primary trend, the yearly opening, current yearly opening price 38.63.
We have a hacken signal there that formed on Monday of this past week. But I believe we have more upside, guys. I believe that 5113 is still in the cards, but again, I do like to give immediate targets and that would be between 47 and $49 a share.
So, with energy likely to spike next week with everything in the Middle East, we’ve got the the debt buyback program, we’ve got potentially equities and gold and uranium rising, then this one should follow it. That’s the the whole theory be behind inner market technical analysis. So again, our key level, our T-Cross Long, that’s coming in at 4310.
And then our long predicted, which I’ve added, is 4369. So there’s your buy area between 4369 and 4310. And for the more aggressive traders, you could use the predicted high and low, but I think we may see a well, it’s hard to say. We’ll see how the market starts off, but it’s going to be a choppy start, guys. uh with no trade deal between the US and Canada, it’s going to be a very cho choppy start to the week.
Ecolab ($ECL)
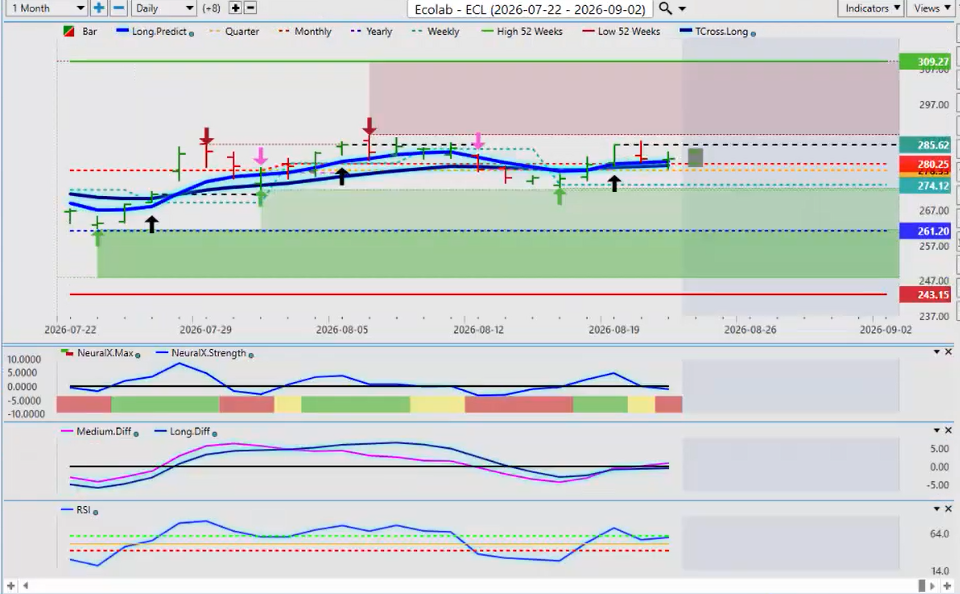
Now, a secondary stock here uh again a little bit more expensive stock, but just the same. We’re looking at uh Eolab ECL. Now, again, we want to identify that primary trend 26120, the yearly opening price. Uh we’re positioned pretty much right between the 52- week high and low. So, we’re looking for this one to move.
Now, I believe this stock can potentially by month end get towards 296, maybe even 306 to the upside. Uh the indicators here, we got a fresh crossover again. Now, you can see that that hei is on side. This is not on side, guys. We’re above the yearly opening price. No, it it was a good short-term trade, but we want to try and stay with the primary trend.
You can see all kinds of examples of this with the black arrow is a buy. The pink ar purple arrow is a sell. So, all of our support is sitting at 279 and 288. So, pretty decent area there to look for longs.
And again, we we always an easy way of checking something too on the immediate trend is look and see what it did last year, right? So, it did struggle a bit there last year, but when we look back and we go back two years, no, it did actually quite quite well. And when you go back 3 years, this is just a way to see if you can validate what’s happening. But this stock has come a long way here, guys, from all the way down at 150 up to where we are now. So I believe it to be a reasonable trade.
Uh but again this one would be more towards the for the towards uh this coming week and the end of the month. So uh I would definitely expect a choppy volatile start to the week but with that there will always be opportunity. So with that said, this is the Vantage Point AI market outlook for the week of August the 24th, 2026.