VantagePoint AI Market Outlook for the Week of December 14, 2020
VIDEO TRANSCRIPT
U.S. Dollar Index
Hello everyone. Welcome back. My name is Greg Firman, and this is the VantagePoint AI Market Outlook for the week of December 14, 2020.
Now, as we go into one of the final weeks of the trading year as liquidity is going to start to dry up the market, again, we’re going to see very, very choppy trading conditions as we move into year-end. We’ve got the Fed next week. We’ve got still no stimulus package that’s agreed upon between the parties in Congress. Nothing is passing there. Probably a weekly extension. Then we’ve got, again, no Brexit deal. And the Fed. We’ve got a lot of things going on here next week, so you really want to limit your trade and be very, very cautious.
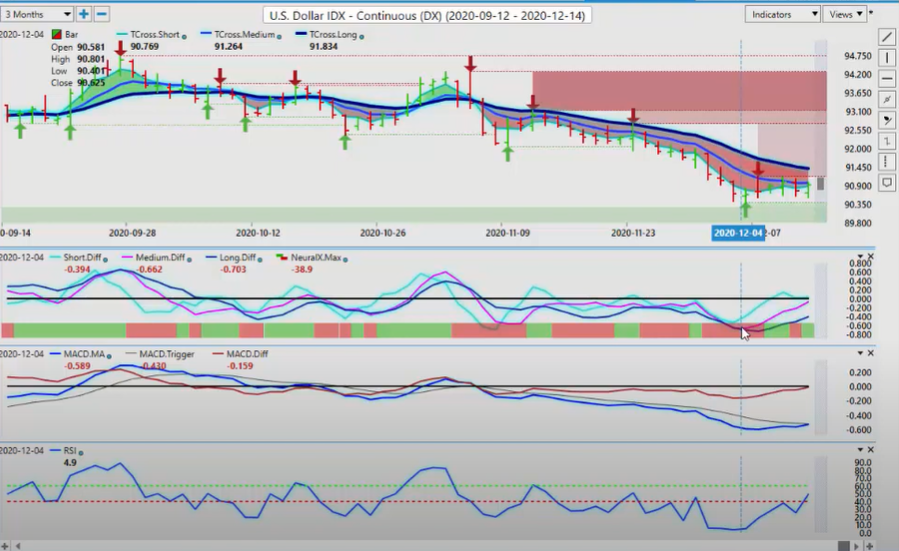
What we’re going to do here is, again, start where we always do with the U.S. Dollar Index. What we can assess here with the Dollar Index, the key VantagePoint pivot area, 91.43. We’re holding below this particular level, but we have verified support basically telling us we have little to no sellers of US dollars down at this particular level of 90.40. So we want to watch this level to begin the week, or the entire week for that matter, to see if we can hold above this. When we look at our main indicators here, we’ve got a rising RSI, but the main indicator here is the medium-term crossing the long-term predicted difference. When we cross this down and put our F8 on here, using that key predicted moving average as a pivot area. That level is coming in at 90.91. We’re closing at 90.92.
With that medium-term trend to the downside weakening against the longer-term trend to the downside, it suggests that the dollar may try and recover next week. But again, we talked about the seasonalities in last week’s presentation. One of the gentlemen posted a very, very good article on the seasonality in December and how the dollar is usually weak, but then it regains its footing in January, February, March, April, as I showed on my particular chart. When you combine those two things, you get a very powerful seasonality, both on a yearly basis and a monthly basis. Again, the closer we get to January 1st, into that first week of January, the more likely it is the dollar’s going to recover.
Gold
Now, what’s surprising again, this past week, is gold has desperately tried to recover. But with all of the things that are going on, the Brexit deal falling apart, the stimulus package falling apart, the ultra-dovish Fed, all these things combined together, gold should be screaming higher and it’s not. Once again, we’re trying to push above that key VantagePoint level, but this is a classic signal warning us about any kind of longs on gold. The medium term crossing the long term predicted difference to the downside with the Neural Index.
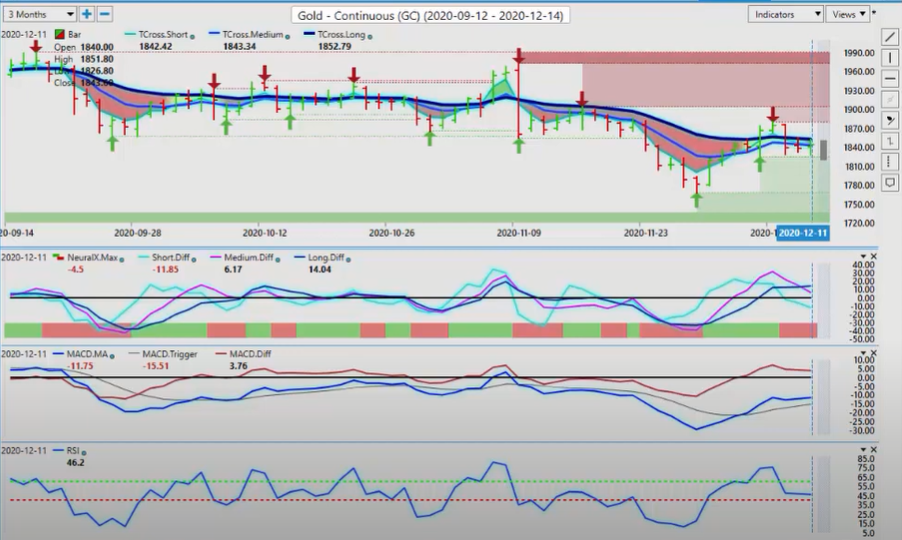
Now, again, our RSI has gone completely flat here, warning us that gold is likely going to struggle. I have made the argument, particularly over the last year-and-a-half, that there appears to be more money going into Bitcoin as a reserve asset than there is gold. That is something to keep in the back of your mind. The arguments and debates over Bitcoin have been very heated on TV, like Bloomberg, CNBC, different forums and websites. I certainly don’t get into that kind of nonsense, but I just look at price, guys. What I can tell you is that, from a factual standpoint, is that Bitcoin has doubled in value every year for the last 10 years. Gold has done very well also over the last several years, but it’s struggling up around these levels again, and we’re failing. If gold is going to make its move, it would appear that next week would have to be it.
We’ve got, again, the T cross long at 1852. We must get above that for the long-term trend to shift. I would like to see it close above that level for a couple of days in a row. Now again, when we click on our F8 here, a very important predicted moving average to use, we also 1847. If we can clear above that, then gold could maybe move higher. But again, the medium-term crossing the long term predicted difference is not overly supportive of that.
S&P 500 Index
Now, when we look at the equity markets here, once again, fielding some of the questions from last week’s Weekly Outlook, one of the comments was that VantagePoint did not call the move lower on the S&P 500. I would argue that that is actually not true. When we look at this, we have visual resistance building rate here. When we look at one of the most powerful indicators in the VantagePoint arsenal, would actually be the medium-term crossing the long-term predicted difference. So we can assess here, as I said to the gentleman, this actually crossed, the medium-term crossed the long-term predicted difference. Now, the pink line represents the medium-term crossover. The dark blue line represents the long-term cross over. So when we look at this resistance, the medium-term crossing the long-term predicted difference, if nothing else, nothing else, tells us not to buy up here. Be very cautious with longs up here. The Neural Index then slowly turns over to red, confirming the medium-term crossing the long-term predicted difference.
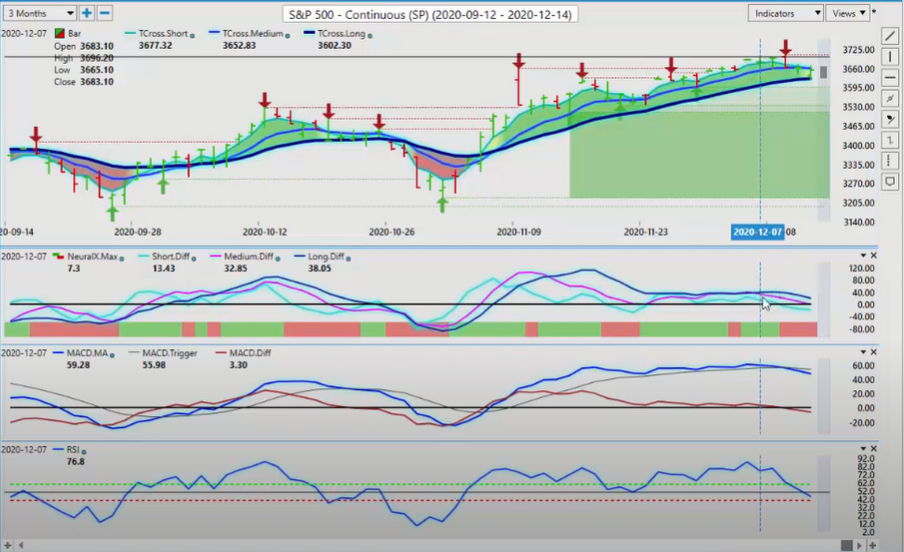
But then I had warned the gentleman that’s in the chat, is that this is still a long while above the key level, which is 36.25. Now I had stated that when the market was trading up at 36.60, so we are able to anticipate that like a moth to a flame, the market will move to that predicted moving average, that 36.25. It hit that to the number and then bounced out of that and closed some 25-fold points above that level. Now this by no means, does it suggest that the equities are out of the woods here. As I had mentioned at the start of the presentation that, again, you’ve got Brexit’s falling apart, the stimulus package is falling apart, and you’ve got the Fed coming on Wednesday. It really is the perfect storm here, guys.
Our predicted MACD is suggesting that this could be a deeper correction on the S&P 500. The RSI is below 50, but it is not below 40. If the predicted RSI breaks below 40, we could see a much deeper corrective move. If that comes to fruition, then we’re going to likely see oil fall, but oil is still holding its ground here. So when we’re talking about inner market correlations here, if oil continues to hold its value, that may help keep the equities up, or vice versa. Again, as I had stated in the comment section of last week’s weekly Outlook, that the S&P 500 is still a long. Just because it moves lower, that doesn’t mean that the trend is over. The markets are continually moving. The bulls and the bears are continually fighting it out for position. Nothing goes straight up, nothing goes straight down.
Crude Oil
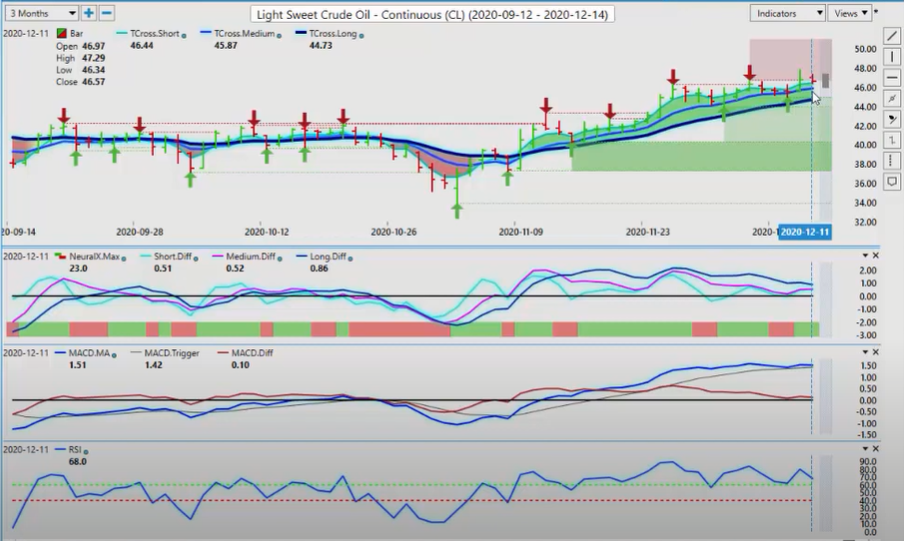
But again, when we look at this, oil remains firm and it’s still a long, well above the T cross long, at 44.73. When we click on the F8, you can see that again, oil is holding a long the VantagePoint predicted moving average, and it’s in contact with it on a daily basis for that matter. So as long as we’re holding above these two levels, oil still has a chance of extending, but it needs the equities to move with it.
Bitcoin
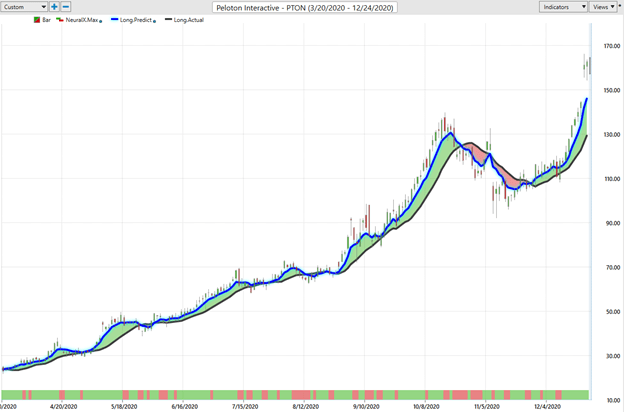
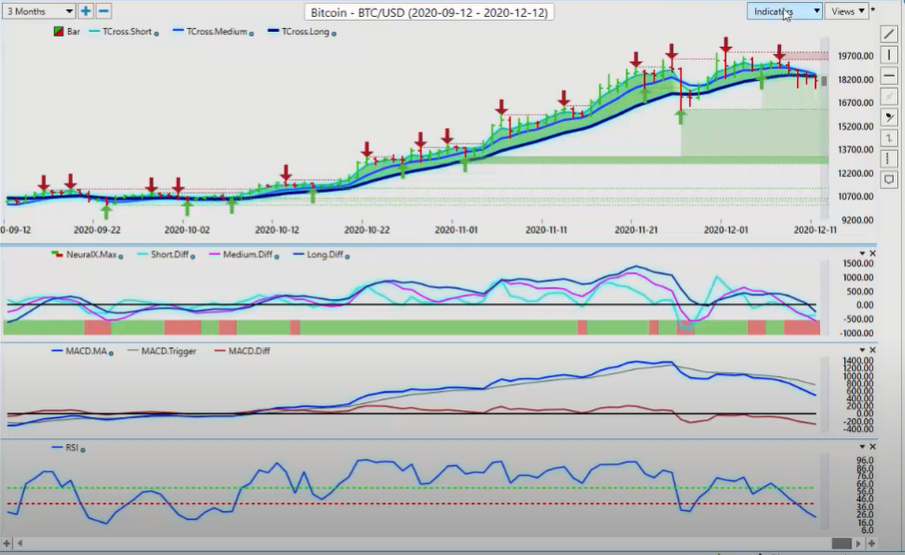
But again, the real story here is Bitcoin yet again. This is where we’ve been, just back in October, back down here at the 10,100 mark. I’ve been a strong advocate for Bitcoin longs here. We’ve doubled from this value almost. Now, at the current time, this is another potential warning sign of pending dollar strength. You’ve got Bitcoin pulling back here. Once again, there’s our medium-term crossing our long-term predicted difference to the downside. We’ve got a break of the predicted RSI of the 40 level, suggesting we have a little bit more downside on Bitcoin. But if we’re lucky enough to get a pullback in towards the 16,259 area, it’s likely going to be a very good long, yet again, as I’d stated. You can fact check what I’ve stated.
Bitcoin has basically doubled every year for the last 10 years. Who would not want to be involved in an investment like that? I’ve also offered up here and in the rooms, GBTC, Bitcoin Investment Trust. There’s multiple ways to get exposure to Bitcoin, but it is certainly worthy of a look for the average investors, particularly when people like Warren Buffet tell us it’s a scam, yada, yada, yada. Okay, Warren, we’ve heard that before, and you’ve been wrong many, many times before, particularly in the Forex market. So it seems to me that Buffet may struggle a little bit when forecasting currencies or things that he doesn’t agree with. So you want to make sure that you’re your own advisor here when looking at these charts. Again, the charts are still, this is a corrective move in Bitcoin, in my respectful opinion. We will continue to monitor it to see if it has any legs to the downside. But my optimism on that remains heavily guarded. I believe that Bitcoin in 2021, in 2022, it’s inevitable that it will break well above the 20,000 mark.
Euro versus U.S. Dollar
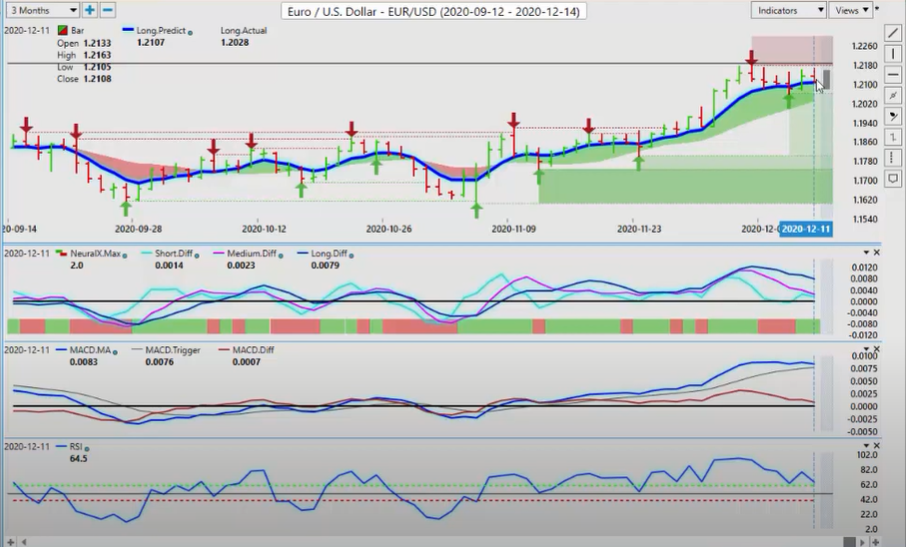
Now, when we look at some of our Forex pairs, once again here, guys, we’re just about done trading. I expect this week coming to be very, very volatile. The key VantagePoint level, 120.20, it is still a long, or a buy while it’s above this particular area. Now, if you click on your F8, then you can get much closer to the flame here. This pivot area is 121.07, and we’ve been struggling with it all week. Our medium term crossing the long-term predicted difference, but the Neural Index is not in agreement here. So again, we want to watch these key levels that I’ve discussed. The first thing we would have to do is break down below here. But for a shift, a complete and utter shift in the Euro trend, we must break back down below the 120 level.
British Pound versus U.S. Dollar
Now, as we look at the pound dollar going into next week, it’s just quite ugly. The trading ranges on the pound dollar this past week have been all over the map, all the way up to 136, all the way down to 131.80. It’s just all over the map. Trust me, if even half of what I’m reading this weekend is true, it’s going to be even uglier next week.
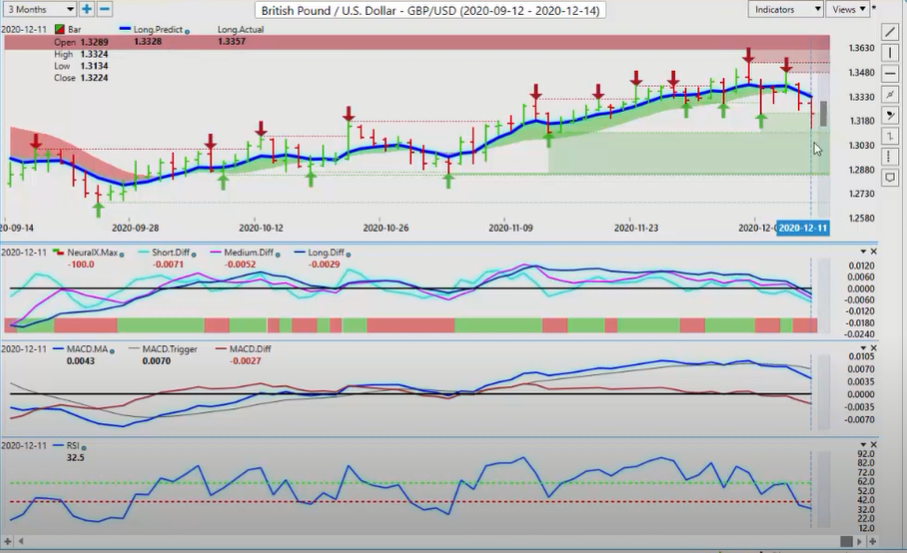
Now another level you want to watch here too, which coincides with these key VantagePoint levels, is around the 130, 132.51 area. Now that’s the yearly opening price and that’s a big level. So when we look at the long-predicted, we’ve got 133.28, we must get back up above that. But the predicted differences are down. The MACD is down or RSI. But again, this payer could whipsaw right back up to 137 here, guys, if there’s any positive settlement on Brexit. But at the time this video is being produced on Saturday afternoon at 2:00, it is not looking great. The UK is talking about having military ships patrolling around the UK to protect their waters. Be careful with this pair guys. That’s all I can say right now. We have a very bearish setup in the VantagePoint software.
U.S. Dollar versus Japanese Yen
Now, if everything falls apart here, there’s no stimulus package, if there’s no kind of settlement in Brexit, then the dollar-yen is really a one-way trade, and that is down. If we get any positive developments, that can change things quick, but here, this is an outlook, not a recap. So the key levels are identified 104.20. For the trend to shift on the dollar-yen pair, we have to break above one 104.20 and close above it two days in a row. The indicators are still saying we have more downside. The predicted RSI is not being used as an overbought oversold accumulation distribution. These are indicators that attempt to show turning points in the market that fail time and time again. They were moderately effective back in the 90’s, but in these types of markets, they’re quantitative programs, algorithmic programs that move at the speed of light, and they’re all rule-based here.
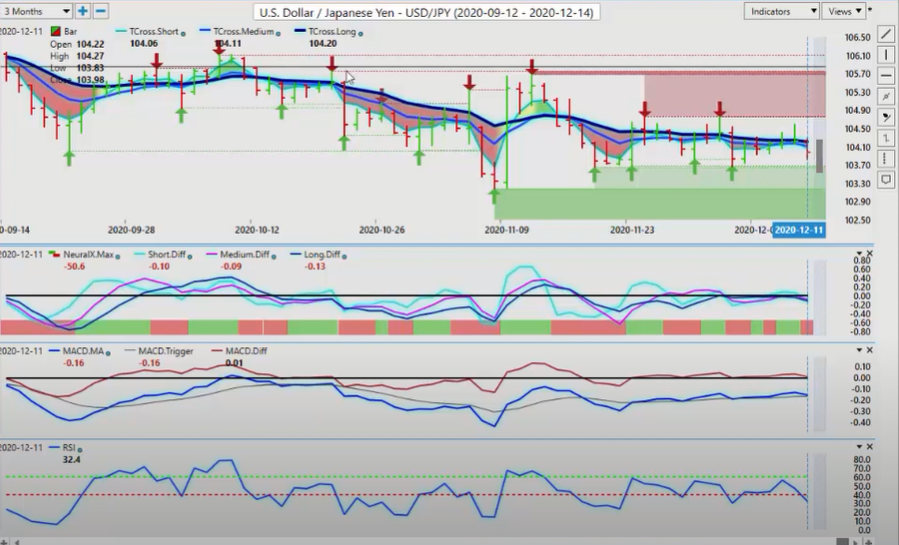
If their systems are triggered, they will cut all their longs and they will pile in shorts and vice versa, and at the speed of light with these ticket orders. So again, be very, very cautious here. When we look at this right now, 104.20, if we click on our F8 in our VantagePoint software, any gains the dollar-yen was trying to make, you can see we failed near the verified resistance zone, and then we turned down again, but we’re in a very tight range here on the dollar-yen between 103.65 on the downside, and the upper part of that is about 104.76. But we’re struggling also around the same level. A double top or a double bottom doesn’t necessarily mean that it’s going to bounce one way or the other. We need a clean break to get out of this particular area that we’ve been struggling in for basically the last three or four weeks. So a break of that level, guys, on either the upside of the downside, there will be a significant trade.
U.S. Dollar versus Canadian Dollar
Now, the Canadian dollar showing again, more strength this week on oil prices rising. But as soon as the equity markets start to fall, the Canadian dollar, the Aussie dollar and the New Zealand dollar fall with it. So going forward into next week, if we’re going to buy the Aussie, the New Zealand or the CAD, if we’re going to buy these currencies, guys, we have to get the stock market moving higher. If the stock market is down, these currencies fall into the category of risk off. They will all come under heavy selling pressure. Right now, in my respectful opinion, again only, the Canadian dollar is grossly overvalued at 130 or 135.
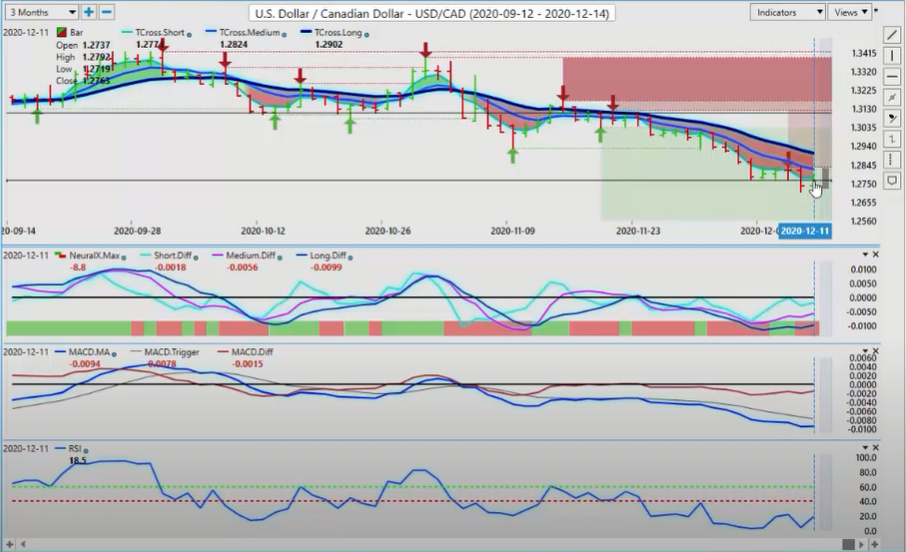
So we will see here. The Bank of Canada is on hold. They’re not going to get any help there. The predicted differences are still slowly starting to rise. The RSI is starting to rise, but this is a good example of trying to trade off an overbought or oversold or accumulation distribution type of signal. Because at what point do you get into the market here? It’s been oversold basically within days of this rally starting. So these are the points we like to watch. The breakdown of the 40 level, and we can catch this, or a break of the 60 level, and we get a nice move up. These are the kinds of moves we look for, guys. These types of oscillators, when they bought them out or they hit, or they get very toppy, very dangerous to be taking counter-trend positions at that time. I would like to see the predicted RSI back up above 50, but the key VantagePoint level here, 129.02. I would say it’s imminent that we will be retesting that.
Now the first hurdle it has to get over is the predicted moving average by itself. That’s at 128.02. If we can get back above 128.02. And again, guys, you can see using this predicted moving average is a daily pivot level, the market is constantly in contact with it. You can very easily use this as a pivot area to get into your daily trades and then straddle the blue line on the other side of it. So right now we know exactly where that level is. There is nothing lagging about this. 128.02. We’re closing 127.63. We pretty much know we’re going to come up to that level on Monday. It’s a question whether we can push through it. Another strategy, putting limit orders on the other side of the blue line, around 128.20. If it clears this blue line, it’s likely that’s it for the downside, and we’re going to start moving higher. So that’s another strategy you can use with the VantagePoint software.
Australian Dollar versus U.S. Dollar
When we look at the Aussie US for next week, getting very, very toppy. The only way guys, the Aussie can extend is if the S&P 500 is in recovery mode, and it’s going to start moving higher. Right now, the indicators are still relatively strong, favoring more Aussie strength. But when we look at that key level, the T cross long, 73.99, we’re a considerable distance from that. When we click on our F8, the key intraday pivot is 74.77. So if we were to continue with our longs here, we would use the VantagePoint predicted low of the day, which is 74.80, and then we have the additional support level at 74.77. So once again, guys, it’s a very effective way to use the software.
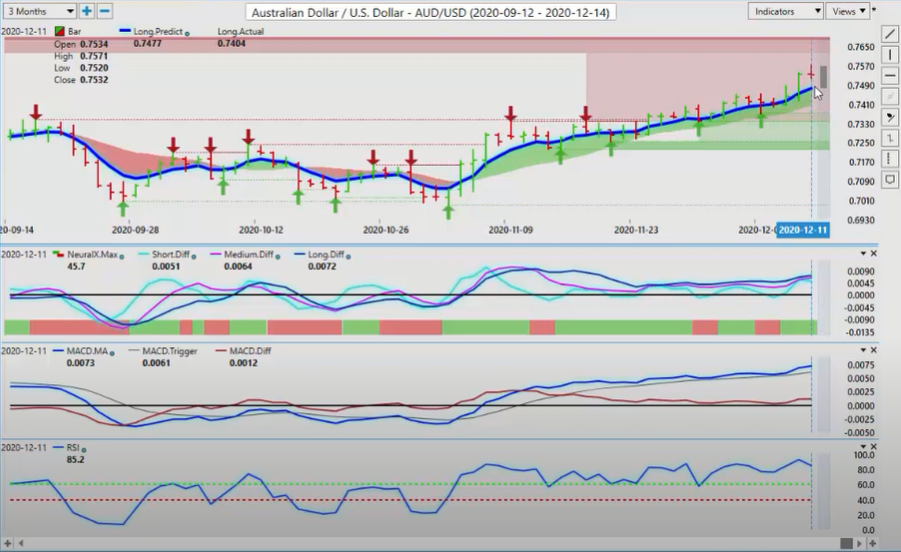
You can have your own viewpoint and just ignore anything I’m saying. You can say, “Okay, well, there’s the key level. He’s identified it. So I believe the Aussie’s going to go higher.” So you would put your limit orders right around 74.77, or you can say, “You know what, I believe that the Aussie is not going to hold up here and the equity markets are going to go lower.” That’s okay too guys. Then you put your limit orders down around, again, down around approximately 74.50 or so. If it breaks down below the predicted low and the blue line, it’s likely going to continue moving lower. We have been moving higher ever since it crossed over this blue line all the way back on November 3rd.
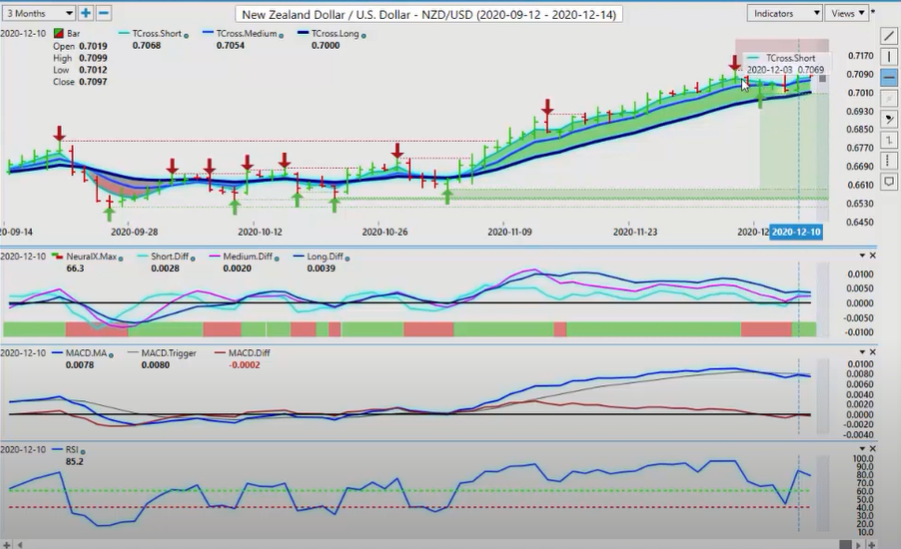
That’s how you play it guys. That’s a strategy that you can use. We can apply the exact same thing to the New Zealand dollar. You can see we’ve had a couple of corrective moves down to the T cross long. This is very similar to what I showed you with the S&P 500. Just because it moves lower, that doesn’t mean that VantagePoint was wrong or this person was right or that person. It’s not about being right or wrong here, guys. It’s about knowing your levels and letting the market come to you, not chasing something. So right now, if I’m, let’s say for example, hypothetically, that I’m buying up in this level up here. Let’s say I bought it up here at the beginning of the week and the market moved lower. Well, I know that I would not want to put my stop anywhere in that area. My stop would be down below this blue line here, and that allows it to come down, test the predicted moving average, and then it’s recovered off that.
New Zealand Dollar versus U.S. Dollar
Now, once again, the T cross long at 70.09, that’s a little, we’re not too far away from it, but my concern guys is the verified resistance that we have coming in at the high, 71.04. I would like to get moving very quickly above that. But here’s the deal. The deal is that you need the S&P 500 moving higher. You need Aussie US moving higher. You need US Canada moving lower. That would support the New Zealand dollar. The inner market correlations will ultimately decide which direction this particular pair moves in.
So with that said, guys, this is the VantagePoint AI Market Outlook for the week of December 14, 2020.
Are you using A.I. yet?