




Welcome to the Artificial Intelligence Outlook for Forex trading.
VIDEO TRANSCRIPT
VantagePoint A.I. Market Outlook
US Dollar (USDU)
Okay, hello everyone, and welcome back. My name is Greg Firman, and this is the VantagePoint AI Market Outlook for the week of July 13, 2026.
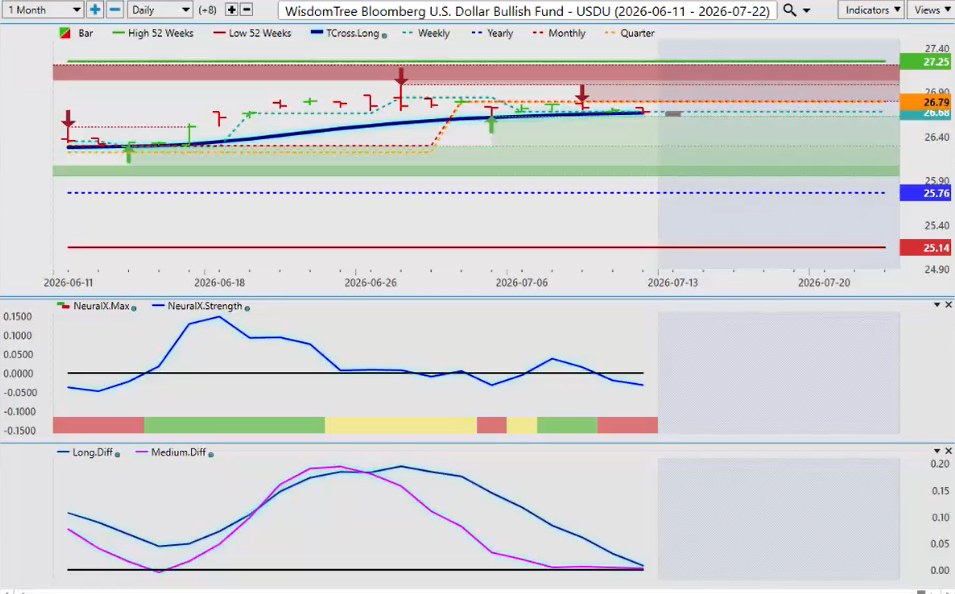
Now, to get started this week, we’ll begin where we always do, analyzing the US dollar, or the US Dollar Index. In this particular case, I am using the USDU, the WisdomTree U.S. Dollar Bull Fund, to measure dollar strength. Now, we’ve been running along the T Cross Long here for several weeks, actually. The T Cross Long is coming in at **26.66**.
Now, the Neural Index is pointing toward a move lower in the coming days, but as you can see, we can’t quite get that medium-term crossover to go to the downside. We had mixed data this past week. The unemployment number from two weeks ago was not a very good number. So, the dollar is struggling a little bit here, but at the same time, we are well within our 52-week highs and lows.
We remain positive on the calendar year at 25.76, but I do anticipate some dollar weakness coming before its main rally in mid-August. So again, we want to watch our key indicators, but for now, the dollar is holding its ground.
Gold
Now, when we look at Gold going into next week, once again, with the dollar holding above that T Cross Long on the USDU, gold is unable to penetrate through the T Cross Long on the gold contracts. That level is coming in at 4137.88.
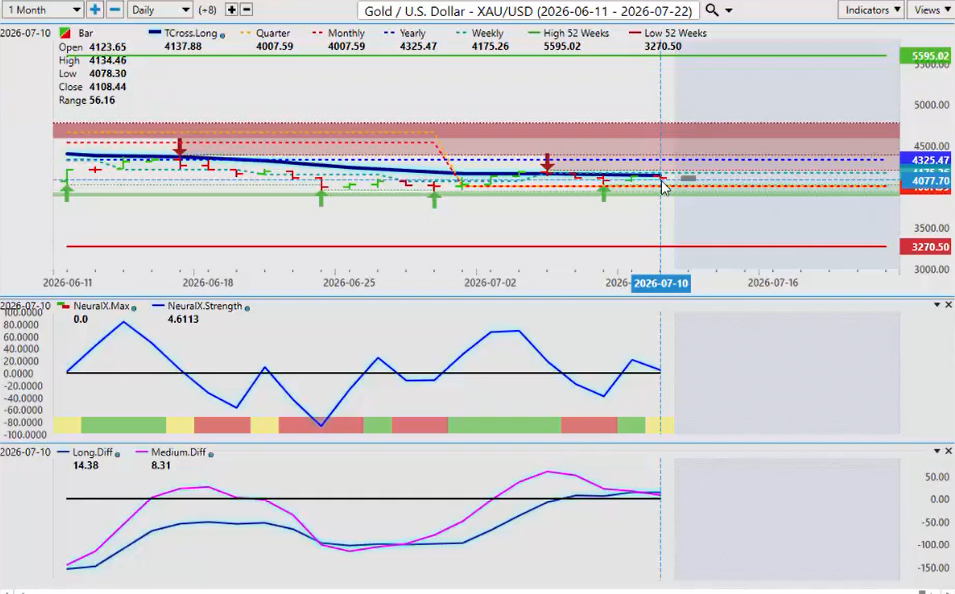
Now again, we’re moving more or less sideways just under that calendar yearly opening price, but we are in the lower end of the 52-week high and low. Now, what is a little bit concerning is we have an MA Diff Cross, the pink line over the blue line, right up against that T Cross Long. That is a warning sign that we could see some short-term weakness coming in gold.
So again, watch this critical level. Another way of playing this is putting a buy stop order above 4138. If we break the T Cross Long, then we have a buy order ready to go. The other way of doing that is putting a buy stop above 4325.47.
Once we get back up over that calendar yearly opening price, then gold would resume its primary trend, which, of course, has been to the upside.
DAX ETF (Global X DAX ETF)
Now, when I’m looking at the DAX ETF, and again, I’m changing up the AI Weekly Outlook to include some forex pairs, European equities, U.S. stocks and ETFs, and the main forex pairs.
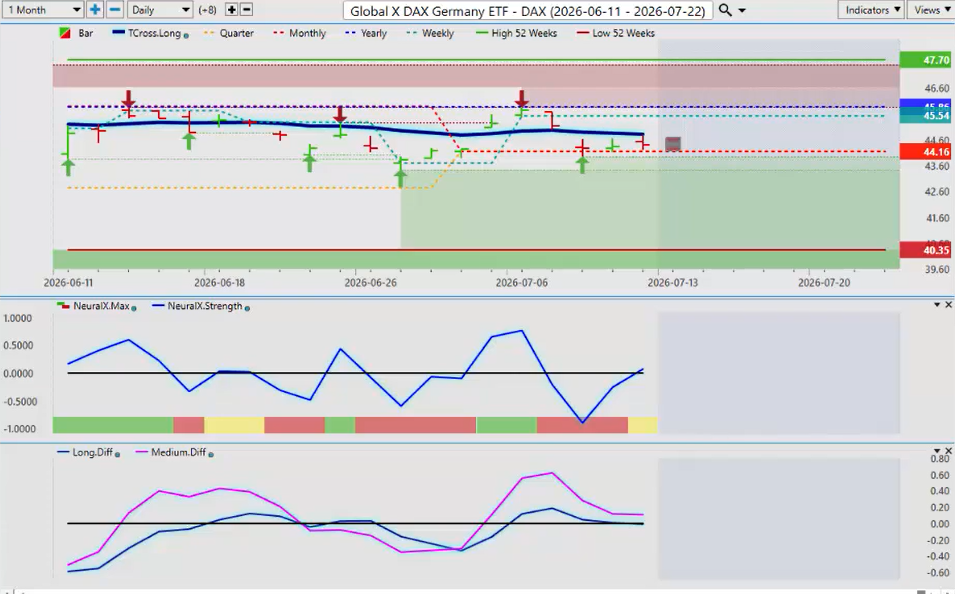
So, with the DAX, again, the euro was unable to really get moving this past week. It tried to break through the T Cross Long, and you can see that the DAX is doing the same thing. Now, on a side note, the Neural Index Strength is pointing up, and we broke above the zero line. We do not have a long-term crossover exactly to the point.
So, all we’re looking for is a break of 44.82 for that to get moving. Again, when we look at that Euro currency, you can see that it’s pushing up against that T Cross Long, and I believe it can break through it. If that’s the case, then the DAX would follow it.
Both the Global X DAX ETF and the EUR/USD are still below the calendar yearly opening price. So, if the dollar does move lower, then we know that the euro is going to go higher, the DAX is going to go higher, and gold is going to go higher. They’re all tied to that U.S. dollar in one way or the other.
But for now, there’s a mildly bullish signal here on the Global X DAX ETF.
Bitcoin
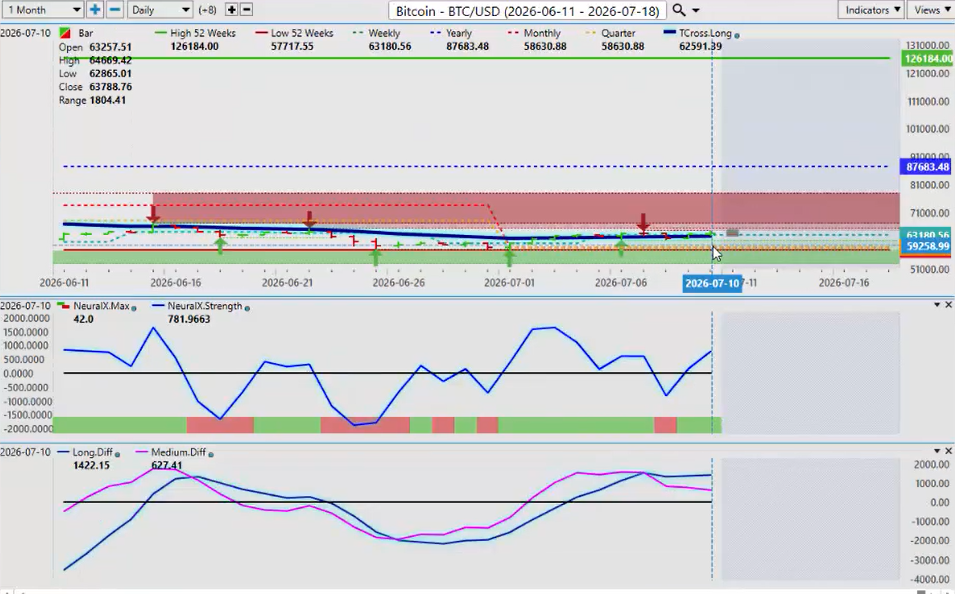
Now, when we look at Bitcoin, I did mention in last week’s outlook that we would likely see some upside in July. But I don’t believe you’re going to see the main rally until about mid-September, maybe late August.
We are closing above the very important T Cross Long at 62,591. If we can hold above that, then we can extend higher. But I can further assess that we have a very mixed signal here. The Neural Index is saying that over the next few days we’re moving higher, but the MA Diff Cross is warning that we still have downside coming.
So, be very careful. The key thing is to know your levels, guys. That T Cross Long is your critical level. If we can hold above that, then long positions are viable. But if we can’t, then we’re likely going to have one more push to the downside before Bitcoin resumes its uptrend in 2027.
British Pound / U.S. Dollar (GBP/USD)
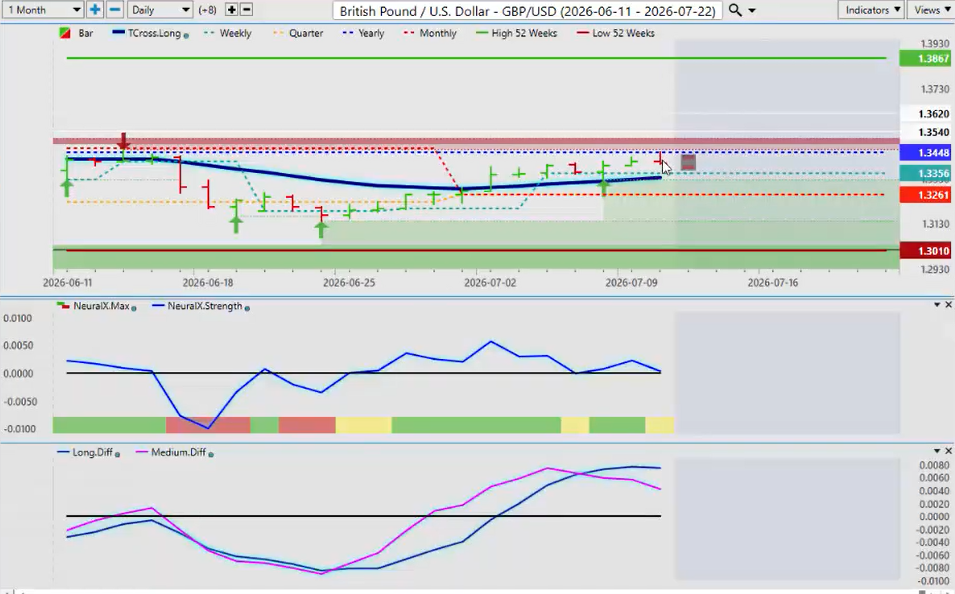
Now, looking at the British Pound/U.S. Dollar, this one has been the strongest of the U.S.-based forex pairs this past week. We’ve broken above the T Cross Long. We’ve held above it all week, but as you can see, we’re right up against the calendar yearly opening price at 134.448.
If this is going to fail, then this is where it’s going to happen. But if we can push through this level and stay above it, then we’ll have pretty decent long positions for the remainder of the month. Everything is riding on breaking that yearly opening price of 134.448.
Once again, I would argue that the VP indicators are saying that is not going to happen. We’ve got an MA Diff Cross to the downside. Now, in fairness, the MA Diff Cross has a dual purpose. It’s a trending indicator, and it will also show us a corrective move.
If we are above the T Cross Long, then that MA Diff Cross is saying, “Look, we’re likely going to correct lower to the T Cross Long at 133.36.” Then we could make a secondary run at the yearly opening price.
The alternative would be that we break through the T Cross Long, break through the yearly opening price, and extend higher. But again, that is a very tall order. We need that U.S. Dollar Index moving lower for that to happen.
Again, that Neural Index Strength is why you have a caution here, because it’s clearly pointing down, and you’re up against a major resistance level. So, keep an eye on that.
Another way of playing this is with buy stop orders above 134.448. If we can hold above that yearly opening price, then we should be able to extend higher.
Australian Dollar / U.S. Dollar (AUD/USD)
Now, the Australian Dollar basically ran flat on the week, but we still have buyers coming in off the quarterly monthly opening price. That key level is 69.20, and we need to stay above that.
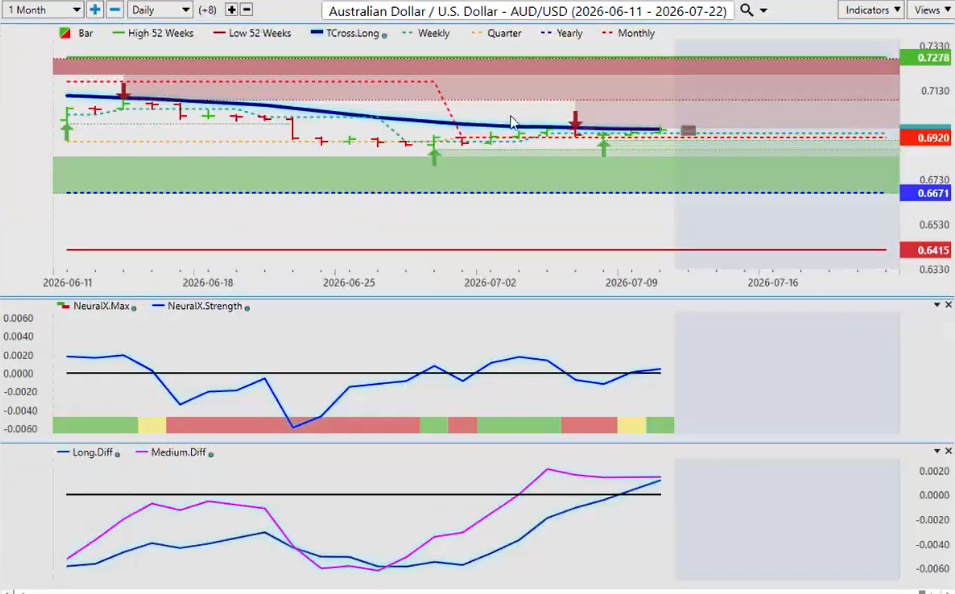
The Neural Index Strength has moved above the zero line. Our Neural Index has turned green. We have a little bit of weakness in the medium term, but we do have a long-term crossover.
So, the only thing we’re looking for now is to break above 65.58, the T Cross Long, which is the Triple EMA Cross. We’re only using the T Cross Long, not the short. There are no crossovers here, guys, just that line in the sand that we have to break.
You can see there were very good short and long opportunities last week. But again, if we can close above this level, we should be able to push higher. That is probably not going to happen until August.
Again, we could see broad dollar weakness coming.
Euro / U.S. Dollar (EUR/USD)
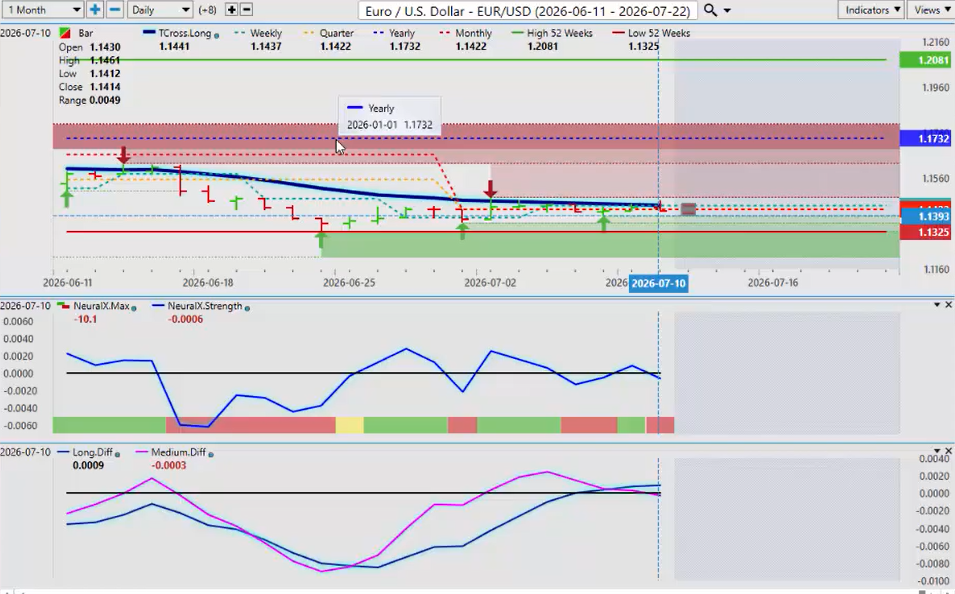
Now again, with the Euro, that T Cross Long is a very important level at 1.1441. It’s a very simplistic play here, guys. If we cannot break above this level, we are likely coming back to the 52-week low of 1.1325.
Now, the Neural Index Strength is pointing down. The Neural Index is down. We have an MA Diff Cross, but we also have a medium-term crossover. My concern with this is the long-term crossover strength, which is the blue line. It’s still technically pointing up, and it’s still above the zero line.
So, this is not a done deal here, guys. The way we can play this, sellers, I like to give something to both the bulls and the bears. Sellers, you will sell into 1.1441.
Buyers, you can buy above 1.1441 on a break of the T Cross Long, but I would be cautious of that until at least Tuesday or early Wednesday trading because, again, Monday is a fake price. If it goes considerably lower on Monday, that would be a buying opportunity for Tuesday. If it goes considerably higher on Monday, well, there’s a very high probability that it’s going to move back to the downside.
Mondays have been a legacy media nightmare. They are putting out all kinds of things to get people not to buy this, not to buy that. They’re creating havoc in the markets, and it’s usually on Monday and early Tuesday. Then they change the narrative, right?
So, be very, very cautious.
U.S. Dollar / Japanese Yen (USD/JPY)
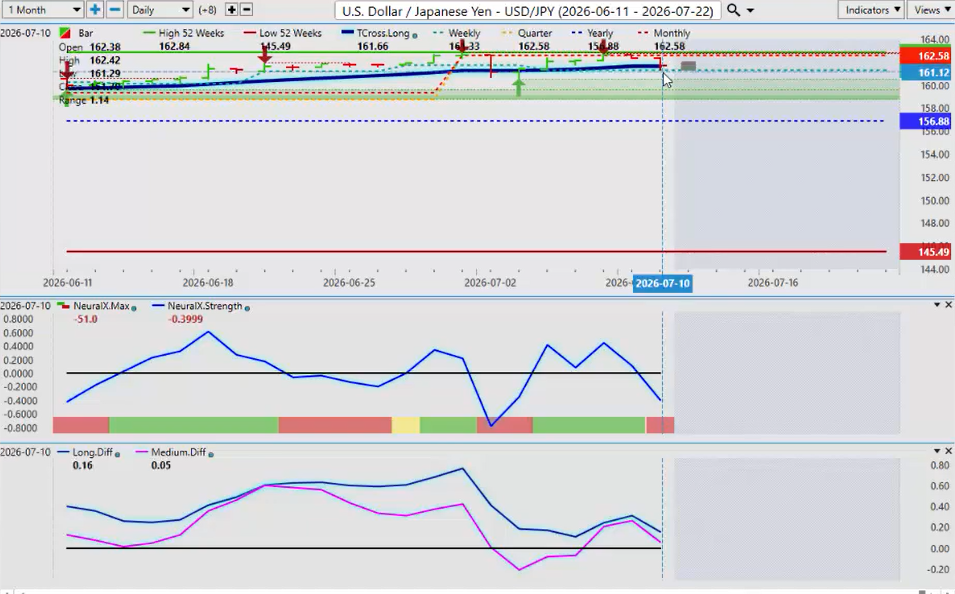
Now, Dollar/Yen, we are holding on the T Cross Long at 161.66. We need to hold this level if the carry trade is to remain in place.
I am of the opinion that Kevin Warsh will not hike rates. If he does, he’s going to need a whole lot better data than what we’ve been getting, especially on the unemployment side. An economy that’s producing 52,000 jobs in a month, with downward revisions to the previous month, is not hiking rates.
Yes, there is some inflation, and that’s transitory with oil prices and food prices. But does it warrant a rate hike? No, it doesn’t, actually. So, we’ll see how this one plays out.
Going into next week, the Neural Index Strength is pointing down, as is the Neural Index. Both our medium and long-term Predicted Differences are also pointing down, suggesting the dollar is going to come under pressure next week.
SPDR S&P 500 ETF (SPY)
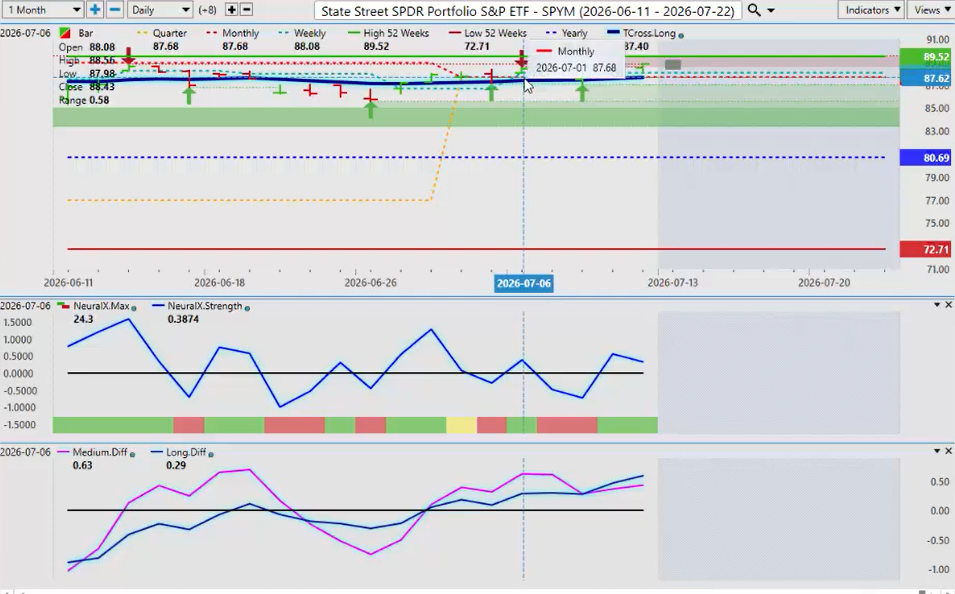
Now, with the addition of ETFs and stocks to the AI Weekly Outlook, it’s just a way of showcasing VP for the next week and giving people opportunities because, again, as per the disclaimer, no recommendation is being made to buy or sell anything here. It’s for educational purposes only.
It’s nice to keep it fresh each week and bring in a couple of stocks, maybe a couple of ETFs, so we do a broader market outlook.
Again, the legacy media is setting things on fire by saying that because the stock market had one down day last week, the momentum trade is coming unwound. There was nothing factual in that statement.
The SPDR S&P 500 ETF (SPY), right now, is looking at a retracement back. We’ve hit our T Cross Long, and we’re starting to rise. So, for next week, we know that our T Cross Long is 87.67.
We’re above the yearly opening price. We’re above the monthly and the quarterly opening price. Now, with this particular ETF, over the coming days and weeks ahead, I would be looking at a target of about 91.85 on the upside.
So again, all the signals here in VP are met. As long as we’re holding above 87.67, this trade still looks quite good, actually.
Black Hills Corporation (BKH)
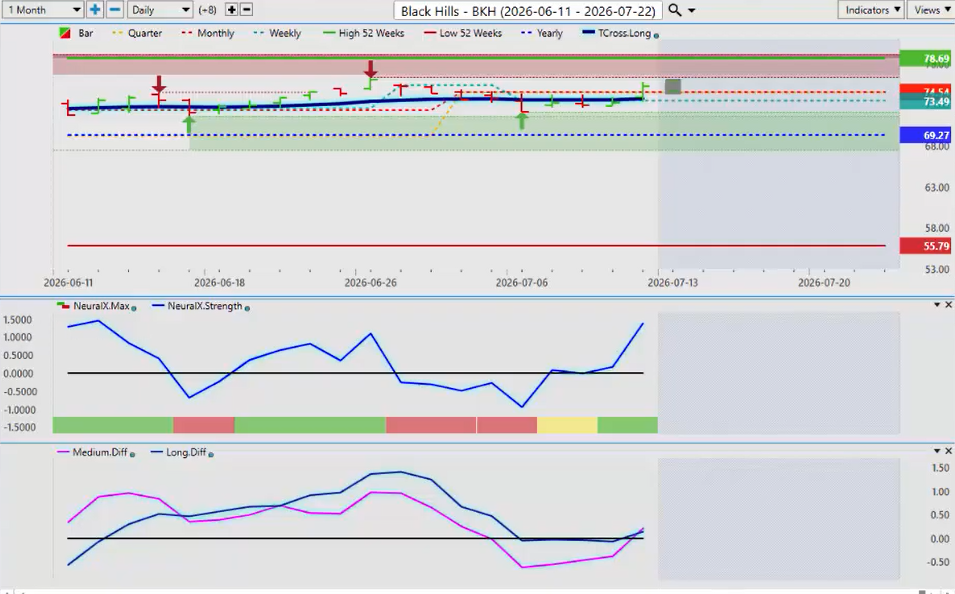
Now, with this volatility, a number of utility stocks have come up this past week in VP. So, looking at **Black Hills Corporation (BKH)**, once again, we’ve had a sell-off, so to speak, that was media-induced in my view, saying the momentum trade is completely coming unwound, which, of course, is not true.
Again, the market is reacting to short-term headlines, but when we look at this chart, our Neural Index is rising. We have always been in an uptrend in this stock over the last month. The yearly opening price is **69.27**.
When I’m looking at **BKH**, I believe an upside target of **78.69** in the days and weeks ahead is viable. We have now closed back above the quarterly and monthly opening price at **70.54**.
So, I believe that’s a reasonable target on this stock over the days and weeks ahead. Maybe not in one day, maybe not in five days, but over the course of the month, potentially toward that **78.69** area. I believe that to be a reasonable target.
Again, that is back up toward the 52-week high, and Friday’s closing price simply helped confirm that.
Barclays PLC (BCS)
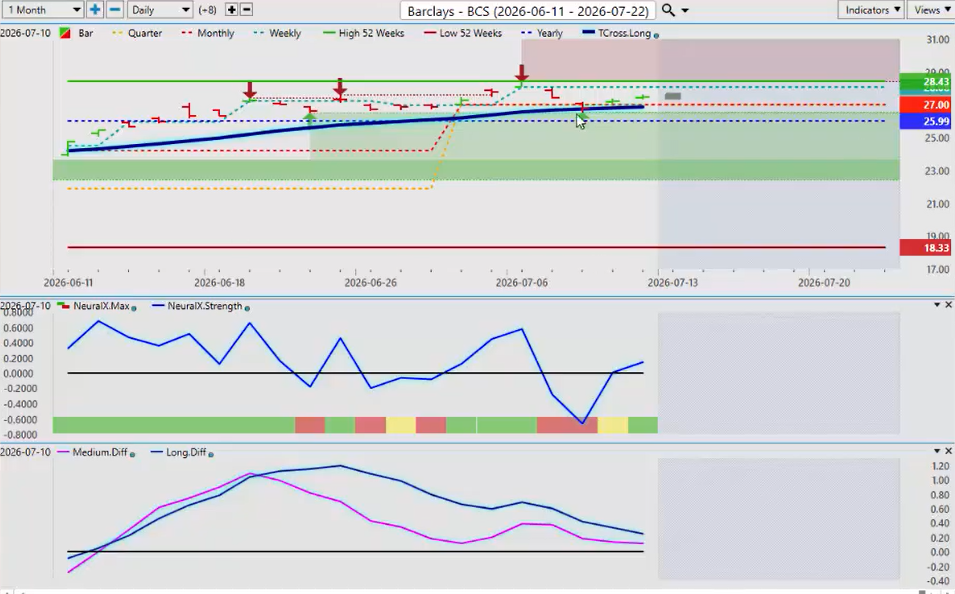
Now, on a more reasonably priced stock, a lower-priced stock at approximately $27 a share, we see the same thing last week. We’ve made another 52-week high on this particular stock at **28.43**.
We have come down again based on the legacy media saying that “Chicken Little is running around, the sky is falling, and the momentum trade is coming unwound.” Well, is it? I don’t think so, guys.
We’ve come back to a natural retracement point, which is the VP Predicted Moving Average, the T Cross Long at 26.71, and we’re starting to rise back up. You can see that the Neural Index is now on board, but at no time was there a medium-term or long-term crossover, and at no time did we close below the T Cross Long or the calendar yearly opening price.
So, looking at Barclays (BCS), I would be looking over the days and weeks ahead for a price target of approximately 29.12. Because once again, this is an outlook, guys, not a recap of something that’s already happened. It’s forward-looking into next week for potential opportunities.
I think that after this corrective move, we can now make a new 52-week high closer to the $29 per share mark.
So again, with these pullbacks, there’s always opportunity, guys. But always remember, if you hear the media saying something on Monday or Tuesday, it’s likely grossly inaccurate.
I believe somebody is feeding them this information to get regular retail traders going the wrong way. But as long as we know our levels, we can always find opportunity with the VantagePoint software.
So, with that said, this is the VantagePoint AI Market Outlook for the week of July 13, 2026.