


VantagePoint AI Market Outlook for the Week of July 6, 2020
VIDEO TRANSCRIPT
Hello everyone and welcome back. My name is Greg Firman, and this is the Vantage Point AI Market Outlook for the week of July, the sixth, 2020. Now to get started this week, we’re going to begin where we left off last week with direct inner market correlations to assist us in our trading week. We’ve got a very high correlation in all markets to the global equity markets, more specifically the S&P 500. When we look at our inter market correlations from last week, I had discussed at length, how a number of different markets, more specifically, again, currency pairs are following the S&P 500, as is the Dollar Index.
U.S. Dollar Index
Now, the Dollar Index prior to all of the COVID stuff, starting up, there was basically a positive correlation between the dollar and the S&P 500. During this, the economic lock downs, that correlation started to break down.
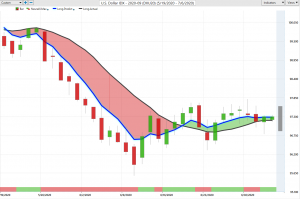
We saw the dollar break away and more of a risk on risk off environment, but we can assess here now that that correlation is starting to come back very, very slowly. When we look at it, the currency pairs that we discussed in last week’s weekly outlook that has come to fruition as the S&P 500 has made a move higher. We can assess that the Aussie dollar, has the Aussie US Dollar has followed it. When we look put the British Pound against the S&P 500, the same thing we’re seeing that everything is dependent on the S&P 500 going up. If they were going to make gains against the dollar.
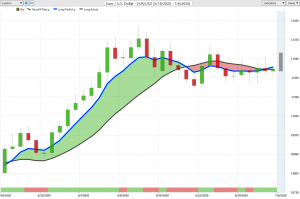
Euro versus U.S. Dollar
The Euro, we can assess here again, basically the same thing. Now, this is an unusual correlation, because again, as I had discussed prior to this, all of this, the COVID, the global lockdown, everything else, there was an inverse correlation between the S&P 500 in the Euro.
And then during the COVID, the lockdown and everything else, we can see that there became a positive correlation between the Euro, US and the S&P 500. So right now, as the S&P 500 starts to rise, we can see here clearly, that the Euro is responding very positively to that. Now, with a pair like the US Canada, where the US Dollar is the base currency, we notice that there’s a very strong inverse correlation, meaning that if the S&P 500 goes up, the US Canadian pair is going down. Now, again, in my respectful opinion, a direct understanding direct inner market correlation using the Vantage Point Software will get you out in front of the market. Because again, this is an outlook, not a recap of something that already happened. We’re looking at this going forward and how we can trade each week.
And what are the driving factors? You have a number of people that will use a Fibonacci, maybe Elliot Wave, different types of Dawn Chan Bands, Bollinger Bands, all kinds of different wild and wacky indicators, which is, which is fine. But again, the inner market correlations are, are what really drive these markets. When we look at the S&P 500 to a commodity like oil, these two charts are virtually identical. So, if, oil is going to continue higher than it is basically it’s relying on the S&P 500 to stay strong. If we look at gold, there’s somewhat of an inverse correlation here. So if the S&P 500 were to break out, that would actually put downward pressure on gold. So again, understanding all of these different moves is what will get you out in front, or if you’re in a trade, and you’re not sure, then if you go to these inner market correlations, they will assist you in determining whether you should stay in that trade or not.
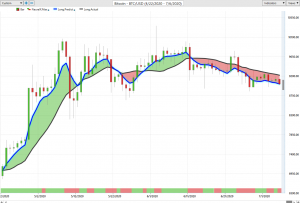
Bitcoin
Now, again, even with Bitcoin over the last six months, there’s been a very positive correlation between Bitcoin and the S&P 500. Yes, that correlation is broken down somewhat, but not enough. It’s still there. So again, if the S&P 500 continues to advance forward, then that would suggest that Bitcoin is likely going to go with it. These are the correlations we watch with the Dollar Yen pair. You can see that these two charts are virtually identical, but often the Dollar Yen is the leading indicator here. So again, if we’re trading either one of these payers next week, or if we’re trading the S&P 500, excuse me, and the US/Japan pair that we may not want to trade both of those at the same time, because of the extremely high correlation.
Now, once we’ve identified these correlations and how powerful they are, we then come to the Vantage Point Indicators using our verified support and resistance zones, our Neural Index, a modified RSI.
Again, these are all the indicators we need to identify price direction once, we understand the inner market correlation. So with the Dollar Index, we have not really advanced anywhere here. We’ve had a better Nonfarm Payroll number, but we still have the Vantage Point verified resistance, and the Vantage Point T-Cross long. These are the same levels that I’ve discussed for the last two or three weeks. We must break through the 98 level. We’ve got very powerful resistance between 97 50 and the 97 70 area. That’s been unable to break. However, in this sideways move, we are also making somewhat higher lows here. So there is still the real possibility that the Dollar Index can break out. But again, when we understand our inner market correlation, there’s a hundred percent inverse correlation between the Dollar Index. And for example, the Euro/US currency pair. So we’ve got the Euro sitting here that can’t advance, but it’s not really moving lower either.
So your, Dollar longs on this particular pair, the safety net here, if we were to go long, we would look at the T-Cross long at one 12 34, and then we would cross reference that to the Dollar Index. As long as the Dollar Index is below the 98 level, the Euro/US is simply unable to move lower here, guys, much more below, much below the one 11 70, one 11 80 area, but we’re really struggling to get and stable low the Vantage Point T-Cross long at one 12 34. So again, if you’re trading the Euro, you are trading the Dollar Index and you are trading things like goal things like the S&P 500. They are all in there, but the basic price action is the Dollar Index. So when we look closer at the S&P 500, these are the things we want to watch in our trading.
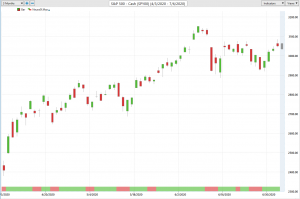
S&P 500 Index
Because again, it’s very difficult for a single indicator to show us this. That’s why we use the Inner Market Analysis Tool. When I identify the S&P 500, we are at very, very strong resistance here. This level is coming in at 31 44, the same level we discussed last week, and even stronger resistance up at 32 19. So again, in my respectful opinion, unless we can break through both of these levels, then there’s still considerable downside risk on the Equity markets. However, the Vantage Point Indicators are telling us that we still have room to go higher, so we will continue to monitor this, but I would recommend extreme caution on longs between this of level of 31 44. And again, this additional verified resistance that’s coming in at 32 19. Now, when we look at gold and we have a comparative analysis, once again, we cannot seem to break through this 1800 mark.
We get very close to it. And then we always go sideways around this particular level. Our main support is now coming in at 1766. If we click on our eight here, this is the key pivot area that we want to watch. 1785, the long predicted, the predicted moving average by itself is a very powerful strategy because again, the correlation to 30, 31 other markets is built into this blue line. And we would look, the primary theory is that if we’re above it, we’re long. If we’re above it, we’re short, but if we can’t hold above this particular level, then we are likely moving lower into that 1760 1750 area. And again, when we look at other commodities like oil, oil will continue, as you’ve seen in the direct split-screen chart will very much follow the S&P 500. So in most cases, oil is strong at this time of year based around the seasonality of the driving season.
But again, we still have social distancing. The economy is not firing on all cylinders yet. You’ve got more cases coming out. So we’re not out of the woods here by, by a long shot, if there’s any further, coming from the media, that there’s a lot more cases that are coming into the system here, then the real risk is they could close the economy down, go into a lockdown again. So we’ve got to always, we have to always remember that guys. Now, when we look at, additional markets like Bitcoin to Bitcoin still is, is showing that there is likely and an investment here. Now, if the S&P 500 can break higher with Bitcoin, we’re looking for Bitcoin to push through the 91 80 area. Now, again, I’ve added Bitcoin to the AI market outlook, because I believe that there is an investment here, and, Bitcoin has tripled this year, a tripled last year.
I know that some of the bigger names out there like Warren Buffet have made very negative comments about Bitcoin, but in my respectful opinion, he’s, great as an investor is Warren Buffet has been over the years. He’s also made some pretty bad calls here, particularly in the currency markets. And Bitcoin is a type of currency. So I look at the numbers, I look at the charts and I’m saying, no, I think we still have an investment here, good, bad or indifferent. I think it’s worth it. So, Bitcoin right now solid, very, very solid support here, coming in, down around the low at 88 48. So unless Bitcoin can take out this level, I think that there is the possibility of yet another long entry coming up this week. We’ve got our medium-term crossing our long-term predicted difference. So there’s a lot of stuff going on here. The RSI is starting to flatten out. The Neural Index is turned green to match the pink line, crossing the blue line here. So watch for a potential reversaL, again on Bitcoin, this coming week.
British Pound versus U.S. Dollar
Now we did discuss the Euro here. So we’re going to already in the intermarket correlations in the main levels to watch some of the other currencies that we want to keep on our eye on this coming week would again be the Pound Dollar. We have a long trade trying to form here. Key support is coming in at one 24 45, but once again, here guys, if we go with our long predicted arm in our blue line by itself, we’ve got one 24 29. That’s the area to watch to begin the week. I can almost guarantee you to a degree of about 80% that the market will come to this level on Monday. When it does, then that we would use that as a pivot area to potentially get long. But again, you must watch and make sure that the S&P 500 is holding onto its gains, or it’s not selling off because the Pound Dollar will react to any violent sell-off in the S&P 500 will drag the Pound Dollar down with it.
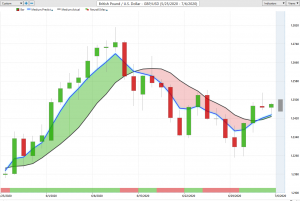
Just always remember that guys, but again, the Neural Index is positive. The RSI is still flat. Our Mac D is trying to form a long signal here with the predicted differences. So I think that we still have risk in the UK with Brexit. There isn’t much of a deal between the UK and the European Union. So there’s, again, a lot of event, risk in the marketplace with pairs like the Euro/US and more specifically, the Pound/ Dollar. Now, if the dollar can turn around this week, if the equity markets can turn around, then the US Swiss franc, also could see a relatively, a decent long trade here. Now we’ve got very, very strong support that’s coming in currently, that’s sitting down in this 94 area, but the level that I’m really watching here would be 93, 76, the bottom of the over the identifiable, I should say, bottom of this overall range over the last three months, we’re holding above 93, 75.
Why continue to hold above that? Longs carry a slight edge, got to get the Neural Index on board. The predicted differences above the zero line. And again, if we click on our F eight on our Vantage Point Software, this is how we get out in front of something. Because again, this is an outlook here, guys, not a recap of something that happened a month ago or three months ago, where it’s a forward looking presentation. So we can identify these levels ahead of time. This presentation is being done on Sunday morning before the market opens, not after. This key level is 94 61. The very simple strategy is, is that if we can get above this level close above this level, then we should see a reversal higher likely back towards the 95 32 high. Now, again, that’s a potentially a very good trade, and we want to make sure that we’ve got stops down below the 93 76.
U.S. Dollar versus Japanese Yen
We don’t want to get tagged out here by the brokers running stops in this particular area. Now with the Dollar/Yen, the Dollar/Yen mysteriously moves higher and then mysteriously moves lower. Now, when we look at where it stopped, it stopped right on the T-Cross long at 107 39. We were looking for this level to hold. However, my optimism on that level holding remains heavily guarded. And that is because we have the medium-term crossing, the long-term predicted difference. And the neural index is down. The RSI is below the 60 level. So we have no upward momentum at the current time. The question is, could that change and what would cause a change? Well, the simple answer to that is yes, significant rally in the S&P 500. If it breaks to the upside, the Dollar/Yen will absolutely follow here.
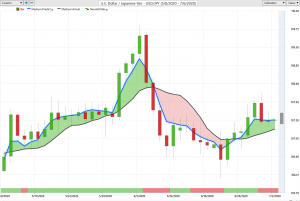
But if the stocks fail around the levels that I discussed, then the Dollar/Yen will break through this particular level. Once again, we go back to our fate to identify an additional pivot area, 107 46. So if we start closing below 107 46, you can see you’ve got a bit of a cliffhanger here. And the blue line is not pointing up. It’s not pointing down, it’s basically dead sideways. So we use that level to look for a potential entry point. As we look at our three main equity currencies, which anybody who has followed me for the many years, that I’ve been doing this between the advantage point AI and my Trader Planet days. We always look at these pivot areas. Now these pivot areas 135 94 and the T-Cross long, but the predicted differences here are starting to push below the zero line.
U.S. Dollar versus Canadian Dollar
It’s again, a warning sign that these stocks could be getting ready to move higher because the US feeds off the S and P 500. So if, if it’s good, a good healthy S&P 500, then they’re going to be buying Aussie dollars, Canadian dollars and New Zealand dollars. Do that. That’s pretty much a given. I used to call these back of my Trader Planet days. I used to call these commodity currencies. They just simply are no longer commodity currencies guys. These are equity currencies. They are having the most powerful reaction to any move in the S&P 500 in those three currencies, Aussie, New Zealand and Kat. So again, if you’re trading these three pairs, you need to be very cautious with that S&P at least monitor that S&P 500 on or about a daily basis. Now, we do a very strong, verified support here.
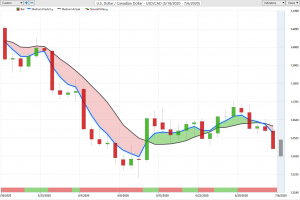
Australian Dollar versus U.S. Dollar
That’s coming in at the low one 34 86. So again, also be cautious of a bear potential, bear trap here, usually selling around these areas is not a great idea. So when we look at this in Monday trading, we identified ups. We identify upside pivot areas, 135 94, but when we click on our F8, we can assess here that the Vantage Point blue line, our predicted moving average is 135 66. That is an area that I, the minimum area that I would target for, for shorts, because Monday again is very choppy trade. When we look at the Aussie and the New Zealand, we can assess it’s the same thing, but it’s inverse US Canada going down, meaning they’re buying Canadian Dollars, means Australia, US, New Zealand, US going up. So we again use those key Vantage Point pivot areas going forward into the week 68, 79 gives us our main pivot area.
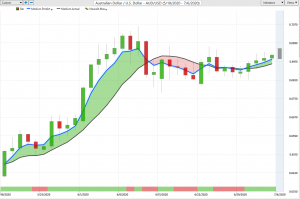
If we click on our F8, we get our additional pivot area here of 69 11. And you can, we can further confirm that the market has been trading off this level for the last three to four trading sessions, small moves on the Aussie dollar guys, but small profits and lots of them. That’s how we make money. That’s the exact model of insurance companies and insurance companies are one of the most profitable companies on the planet. They don’t make money by selling a million dollars a policy for a million dollars. They make money by selling a million policies at 400 or $500 a piece. So those small profits add up to a very large amount the end of the month, the end of the year. So even though the Aussie is only moving 30 to 50 pips a day, there’s still money to be made there.
New Zealand Dollar versus U.S. Dollar
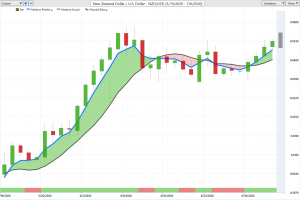
The exact same thing can be said about the New Zealand, US dollar, but understand one thing, guys, it’s the same trade. So when I look at this, our key pivot area, 64, 42, if I want to hone in on a closer area, then that would come in at 64, 85, but 64 85 is the minimum entry that I would look for. That is consistent with the Vantage Point predicted low. But if we start closing below the blue line, then it’s likely the equity markets are reversing. So with that said, this is the Vantage Point AI Market Outlook for the week of July the sixth.
Are you using A.I. yet?


