


Welcome to the Artificial Intelligence Outlook for Forex trading.
VIDEO TRANSCRIPT
Week of June 1st, 2026
US Dollar Index | USDU / UDN
Okay, hello everyone and welcome back. My name is Greg Firman and this is the VantagePoint AI Market Outlook for the week of June 1st, 2026.
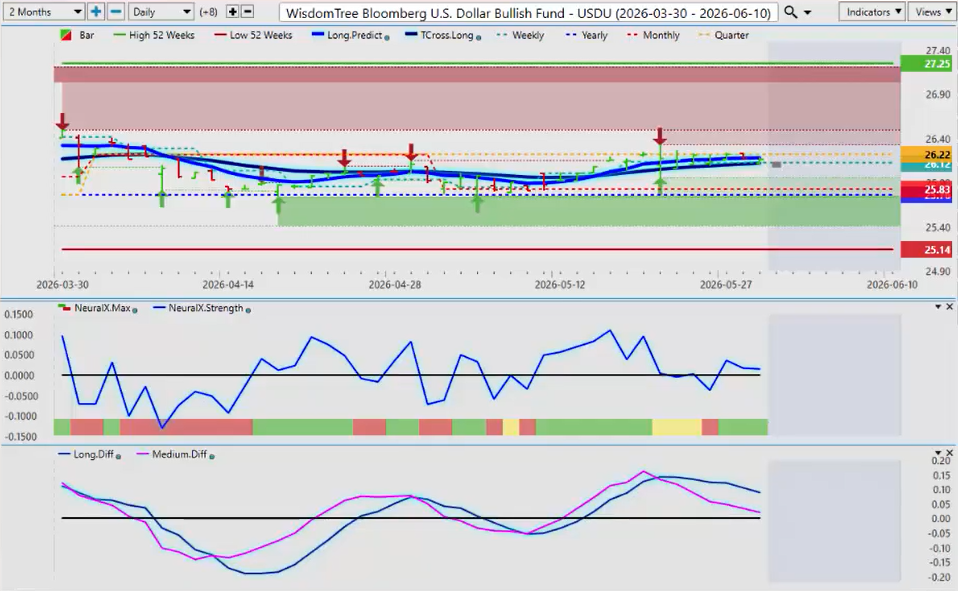
To get started this week we’ll begin where we always do with that very important US Dollar Index, but we’re going to measure it via the WisdomTree US Dollar Bull Fund. What we can assess is that we are pushing up against the quarterly opening price. We still remain negative on the quarter, but we’re holding firm above the yearly opening price. We can see that our 52-week range on this is 27.25 and 25.14, but we’re definitely getting a corrective move lower from the VP indicators.
In this particular week, in most cases, you will see dollar strength ahead of that non-farm payroll number. ADP will be out on Wednesday. We’ll see what that is, but that will dictate the next move, but in my respectful opinion only, what I’ve seen is considerable dollar buying in this particular week. So, if we see a big sell-off on the dollar on Monday, you can expect it to rise on Tuesday because again with the USDU, we’re taking a broader measurement of the US dollar against a basket of emerging market currencies, not just heavily tying it to the euro currency like the DXY.
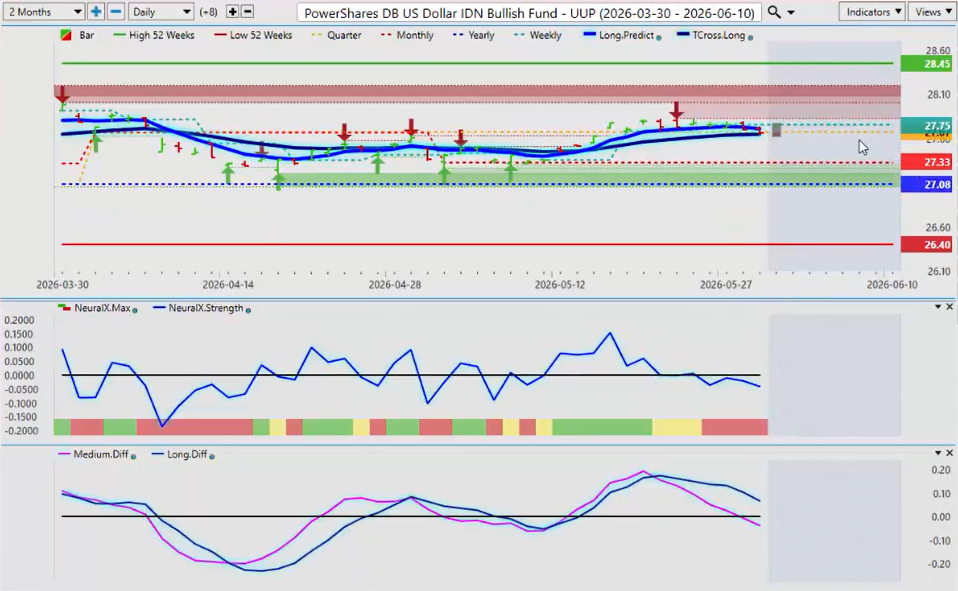
When we look at this right now, again, we’re holding basically just a hair below the quarterly opening on the bull fund and the UDN, the bear fund, is just sitting right on the calendar yearly opening price.
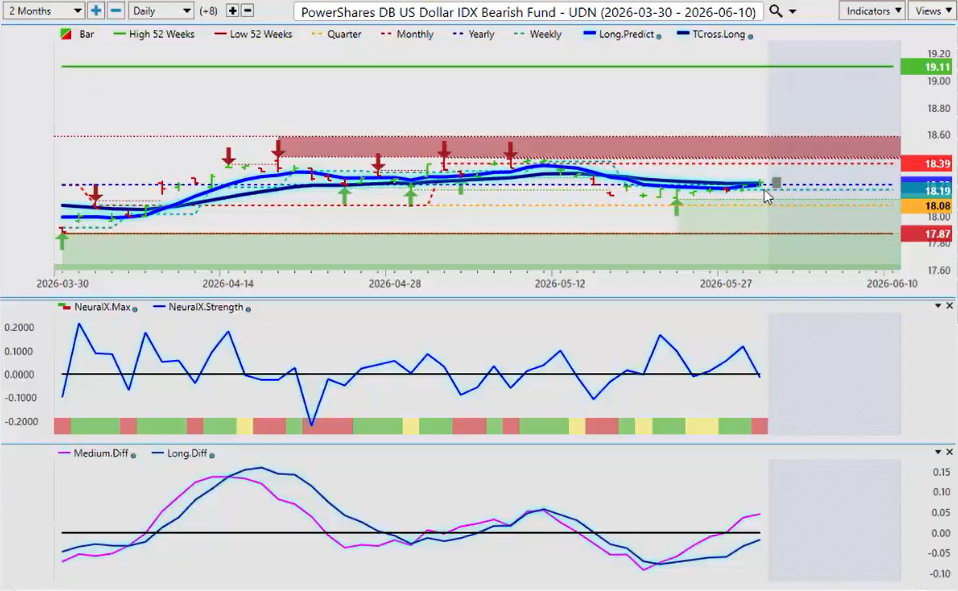
So, again, a mixed bag here. We can see that the dollar, we have a medium-term crossover taking place, but once again it’s very unlikely for the UDN to rise until after we get that payroll number on Friday.
Very often I see setups like this in the first week of the new month and then by Tuesday, Wednesday of that week we start seeing that dollar strength, but I don’t think you’re going to see any aggressive buying or selling on the dollar until we get some idea what that number is going to be.
Gold
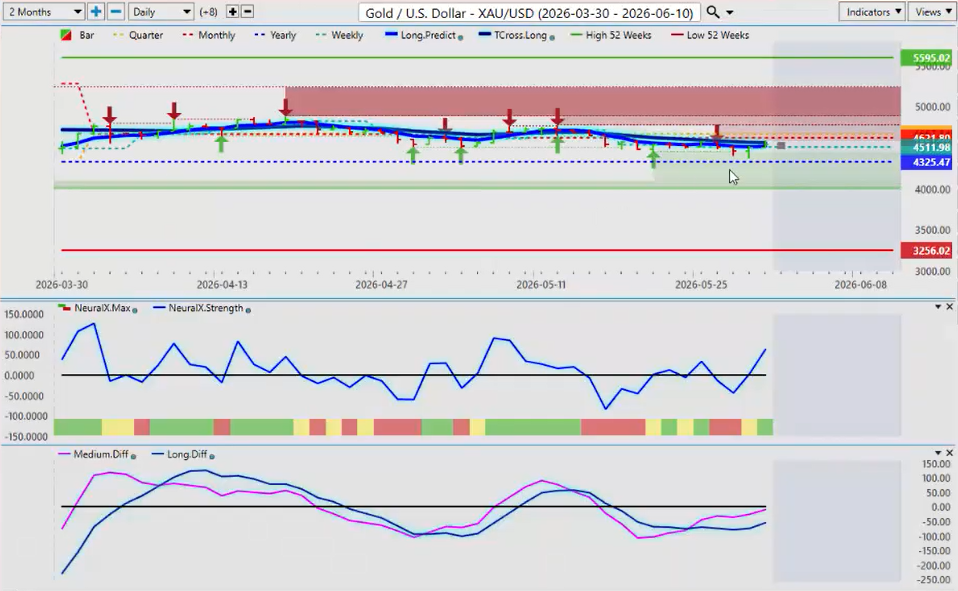
When we look at that from the perspective with Gold, gold remains firmly above its yearly opening price, but we are negative on the month. So, once again, if that payroll number is cooler, which I believe it will be, that will potentially take the pressure off a rate hike.
Now, again, in my respectful opinion only, there is no basis for a rate hike either on hold or a cut. Hikes would not help anything. They serve no purpose in this particular case other than the Fed wanting to do it, keeping those rates elevated.
When we look at Gold, as long as we can hold above 4325, I do anticipate that level will be tested this coming week. But I also believe it will hold. We have an MA diff cross to the upside and I believe that a medium-term crossover is imminent.
Again, we want to make sure we understand that 4325 is a very big level and that’s where the buyers and the bulls and the bears will continue to fight it out.
Equities | SPY, Russell, Qs
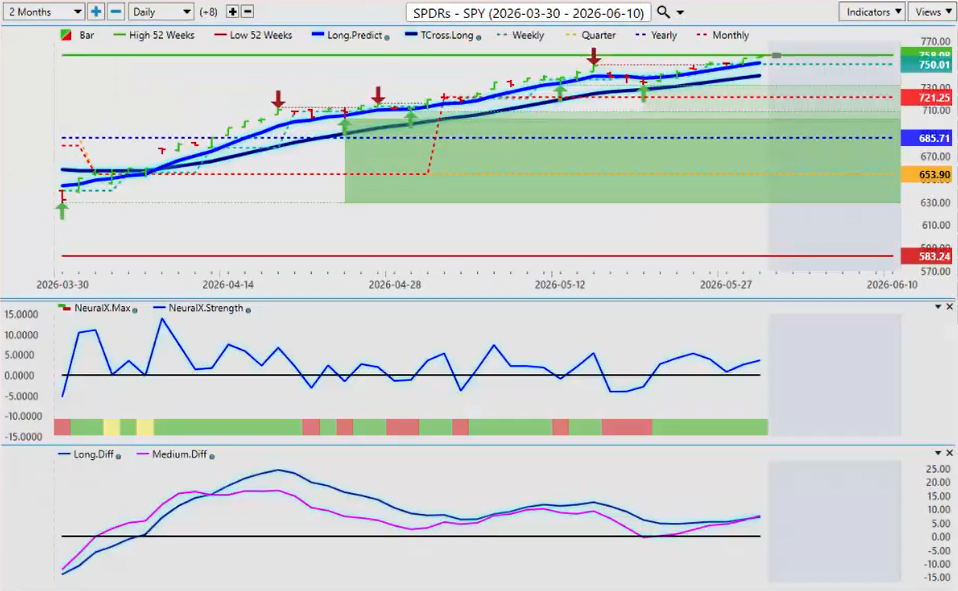
When we look at the equity markets via the SPY, the Russell, even the Qs and of course the European equity markets, right now the SPYs are setting another new 52-week high. Unbelievable here, guys, but it’s happening.
So, again, it will be very interesting to see if we can push through 758. But if you get a weaker payroll number and the potential of a Fed rate hike is off the table with a weaker payroll number, then again, that could easily push us into new highs.
But if you get a hot payroll number and the anticipation or even if the market believes that the Fed is going to have to hike, then that would let the wind out of the equities very quickly. So, it should be a very interesting week.
For now, this past week and going into the start of next week, bought via the VP indicators were above our T-cross long predicted, our predicted difference is above the zero line, we still remain net bullish.
Russell 2000 | IWM
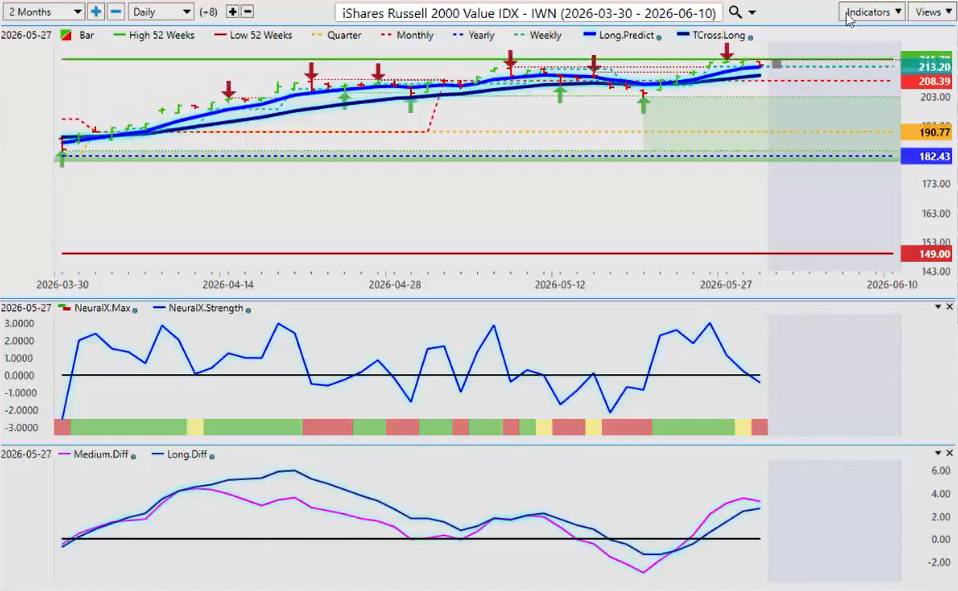
IWN, looking at the Russell, again, also setting a new 52-week high. That, I believe, was on Tuesday, Wednesday of last week, at 215.70. But very high risk here.
Now, what I’m looking at very closely in the next week is a warning sign and the neural index is pointing down, but the MA diff cross, the pink line represents the medium-term crossover.
Once again, if that crosses over that blue line right here, that would tell me we are very quickly coming back to the T-cross long at 210.22. I suspect that this will happen prior to the payroll number, but again, wait for that payroll number on Friday before taking any bigger positions here.
DAX
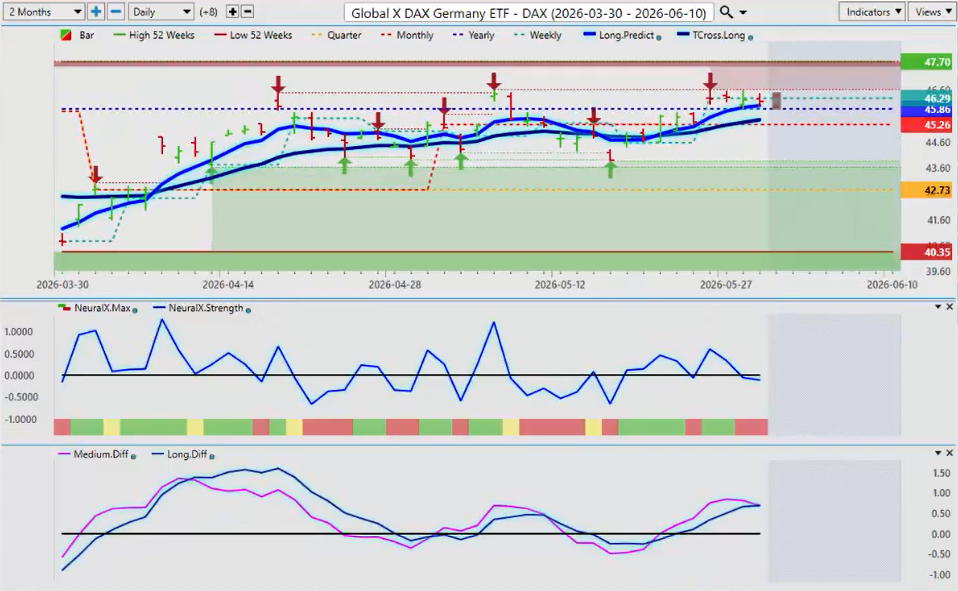
When we look at the global DAX, once again, I had talked about this last week, that if the euro advances, then the DAX is likely going to advance with it.
Right now, we’re holding above the yearly opening price. That’s coming in at 4586. Again, I believe that there’s a warning sign here that that MA diff cross is getting ready to occur.
If that’s the case, that would support the theory of dollar strength and potentially a weaker euro up until and including that payroll number on Friday. So, right now, I believe that the DAX will struggle up here because of this particular trading week we’re going into, which is a period of known US dollar strength.
Watch for a retracement next week back to 4546 and then we reassess from there once we’ve got that very important payroll number.
VIX | VIXY
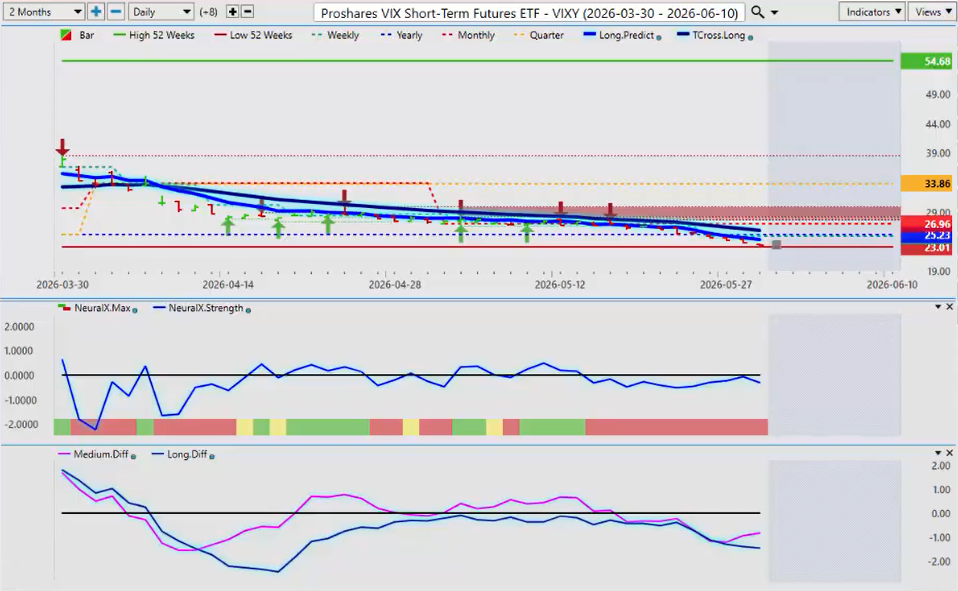
We also want to look at the VIX, the short-term VIX futures, the VIXY. Again, we’re setting a new 52-week low on Friday. Again, potentially a big warning sign here, guys, that the equities are getting ready to reverse to the downside.
Watch this 52-week low very, very closely at 23.01. If we start rising above that and get back above the yearly opening price at 25.23, then potentially you could have a very, very good sell on a number of the different indices.
My optimism on that remains guarded. Looking at the track record of these indexes, they just keep going higher. And shorting them, yeah, we can, but most of those shorts, we just saw people buying on dips. So, be careful with that.
Right now, again, another big warning sign. And remember, this particular ETF is 98% positively correlated to the dollar index. So, if this starts rising, then you will see the equities move lower, you will see the dollar moving higher, and potentially Gold moving lower.
Bitcoin
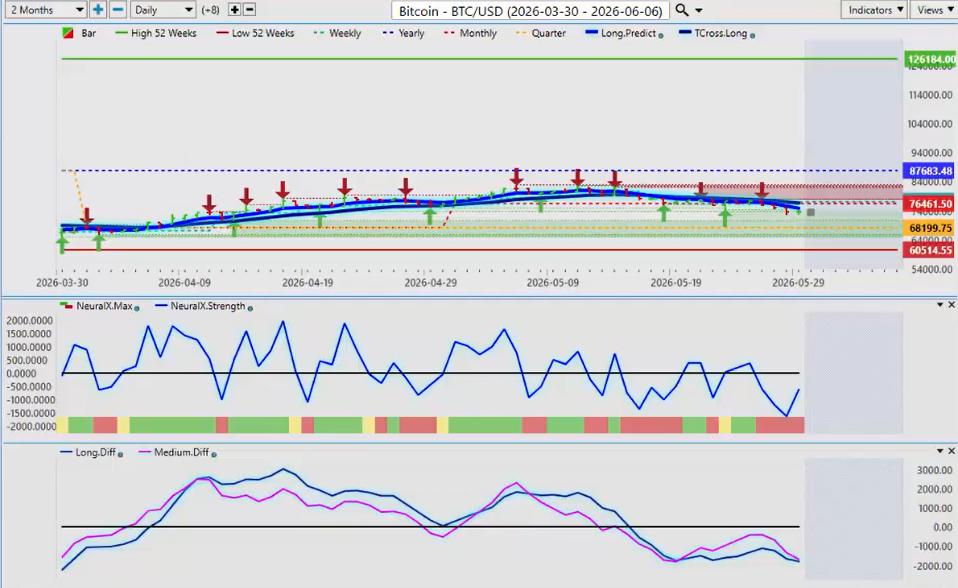
With Bitcoin, again, our 52-week low is back in sight here, guys. We have still not been positive on Bitcoin, I believe, for this entire calendar year.
That yearly opening price right out of the gate back in January showed we were trying to be positive there for maybe a month or so, and then we’ve tanked ever since. So, again, that 52-week low coming in at 60,514 potentially is back in sight for a potential target here.
Going forward, I would definitely be a buyer down in that particular area, as I would anticipate Bitcoin to strengthen at the end of the third quarter and into the start of the fourth quarter of 2026.
Then, in 2027, I expect Bitcoin to resume its 3-year cycle of 3 years up, 1 year down, 3 years up, 1 year down. This is a pattern that’s been going on for many, many years, guys. So, the closer we get to 2027 or the fourth quarter, the better longs look.
Oil | USO
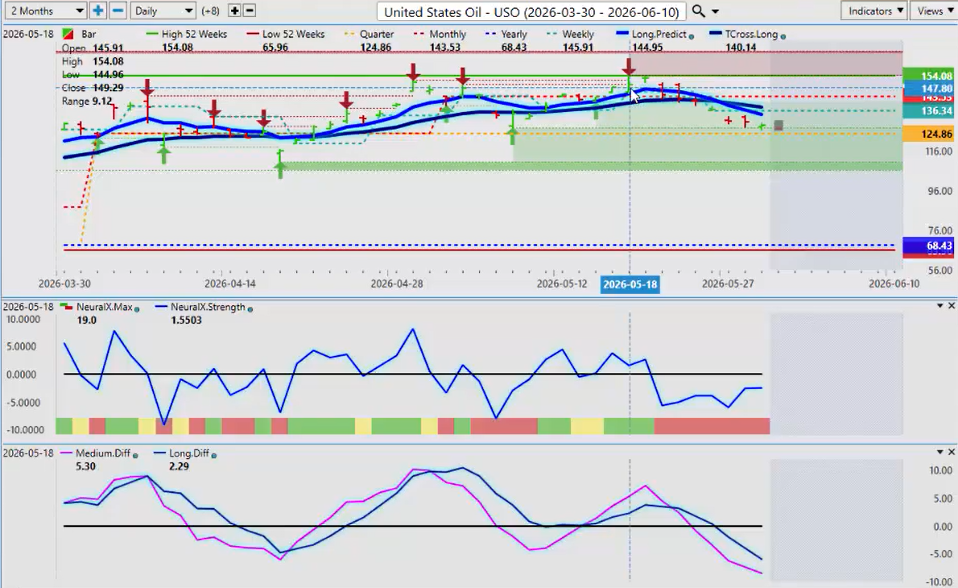
Oil, again, all over the map here, guys. And when oil is being influenced by the war, the last thing we want to do is chase it.
We have put in a 52-week high on the USO. That’s coming in at or about $154 a share. I still can’t believe we got to that number. That’s crazy, but we did.
We have made a new high, but now we’re starting, it looks like we’re pointing down. Again, that quarterly opening at 124.86.
I’m not really seeing an end to this war yet. So, I wouldn’t get overly excited about lower gas prices or lower oil prices. But obviously, looks like an easy short. In each dip, we have seen buyers come in, so be careful with this one to say the least.
Euro versus US Dollar ($EUR/USD)
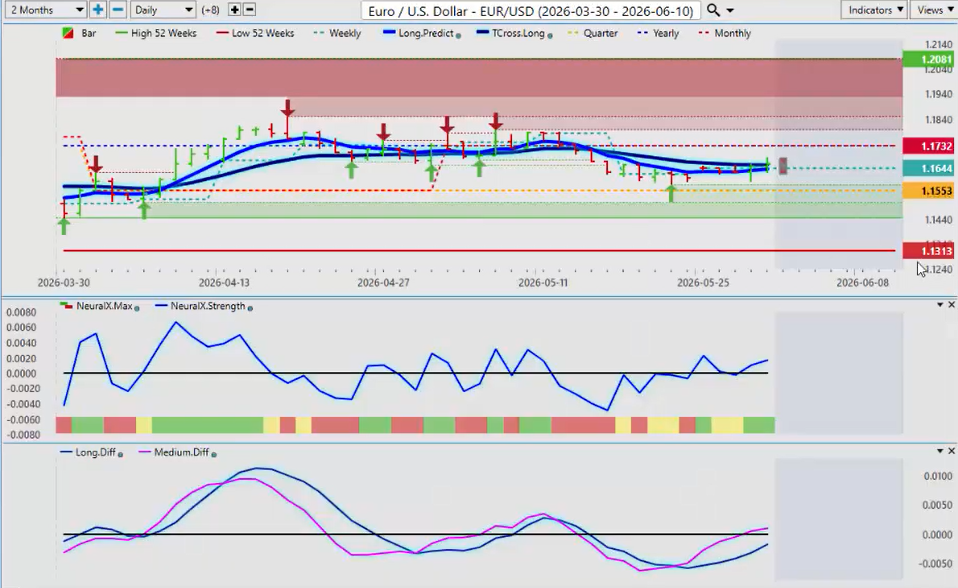
Most eyes will be on the EUR/USD currency pair. Our 52-week range sits at 113.13 on the downside and 120.81 on the upside. We’re closing out the week at 116.60, just a hair above that very important VantagePoint T-cross long.
Looking at the calendar yearly opening price at 117.32, it’s unlikely to start the week that we would go to that number. And if we do, in my respectful opinion, at least for a week, it would be a short.
The VP indicators are saying that the euro is going higher. I believe that to be true for one day, Monday. When it goes higher, then on Tuesday, we tank. I’ve seen this repeatedly over and over again, month over month.
The first hurdle is the monthly opening at 117.32, but the yearly opening is sitting at the exact same level. So, all resistance for next week is coming in at 117.32.
US Dollar versus Swiss Franc ($USD/CHF)
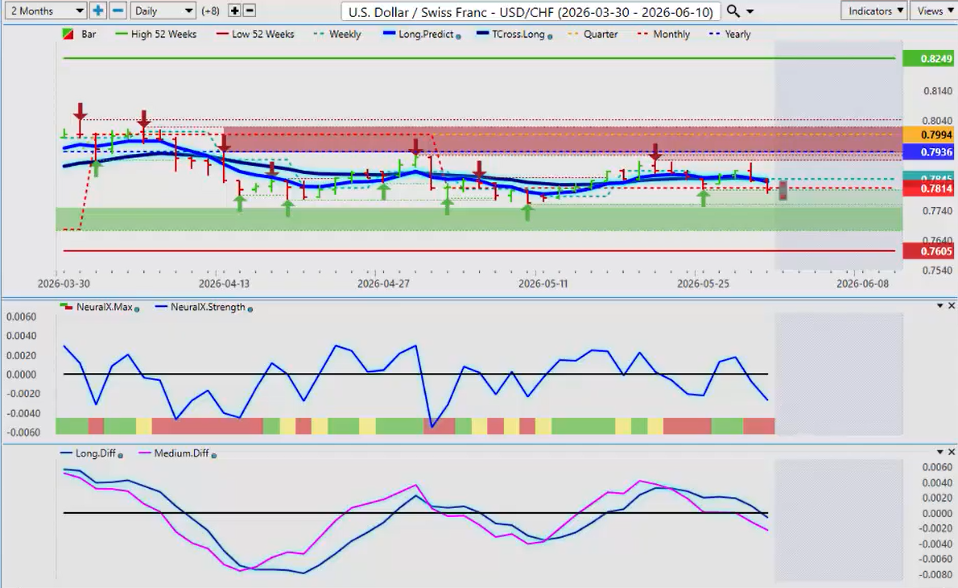
The USD/CHF is a carry trade, meaning holding dollars and selling Swiss francs, but again, we remain net negative on the year.
We’ve slipped below the yearly opening price. The 52-week range is 76.05 to 82.49. I believe this pair can advance higher next week on dollar strength.
If you’re buying USD/CHF, you’re being paid to hold that trade. If you’re selling it, you have to pay the broker. The US dollar remains the higher yielding currency, but these indicators are all pointing down.
Be careful of a snap whipsaw higher in a period of known dollar strength.
British Pound versus US Dollar ($GBP/USD)
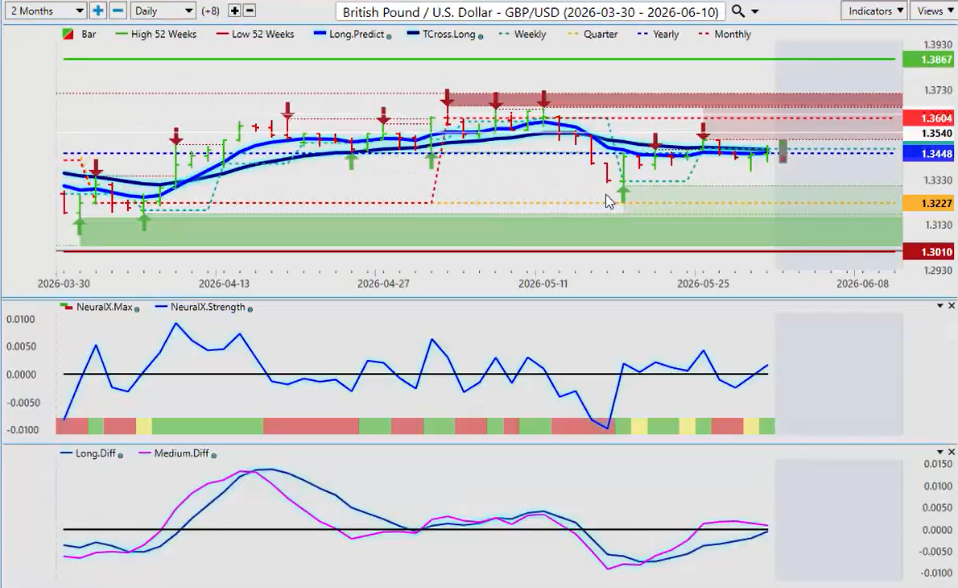
The GBP/USD falls into this same boat because these are all based around the US dollar.
The British pound is putting up a very strong fight right around that calendar yearly opening price at 134.48. Our upside here is coming in at the monthly opening at 136.04 and the 52-week high at 138.67.
We’re almost smack in the middle of this range with the low side at 130.10. But again, we remain net positive on the quarter above 132.27.
As long as we can hold above that second quarter opening price, we remain positive. It’ll be a very interesting week, but very dependent on payroll data.
US Dollar verus Japanese Yen ($USD/JPY)
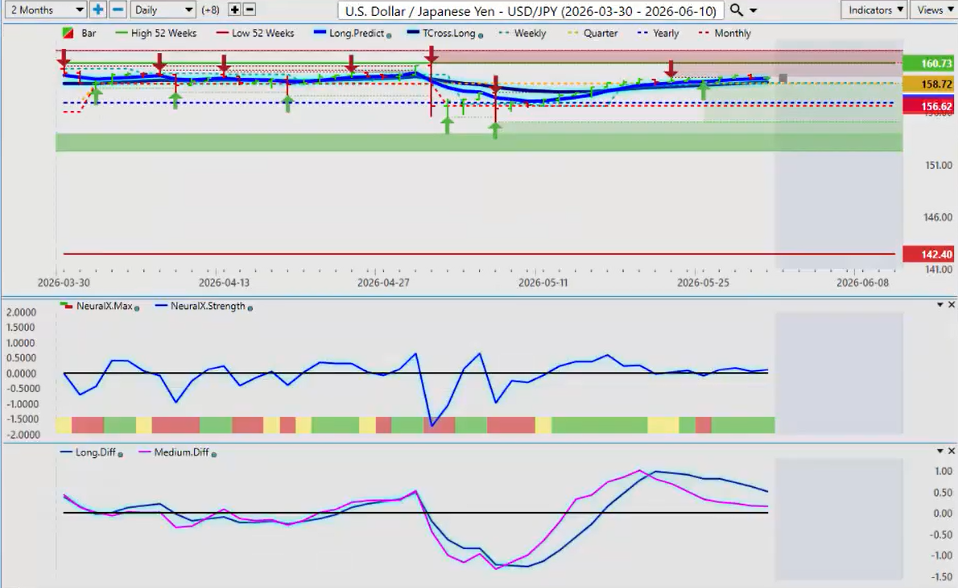
With the carry trade, this is the number one carry trade, guys, USD/JPY.
Personally, I am very reluctant to buy this pair at these extremely lofty levels. But we’re holding up here. I can’t argue with that, but it’s very difficult to buy something this high.
If you get a strong payroll number on Friday and the rhetoric starts back up about rate hikes out of the US, this pair will easily blow through 160. But if you don’t get that, we’re going to move lower.
For now, the VP indicators are pointing to this being a corrective move lower. It is not turning into a new trend. We remain above monthly and yearly opening prices at 156.88 and 158.72.
US Dollar versus Canadian Dollar ($USD/CAD)
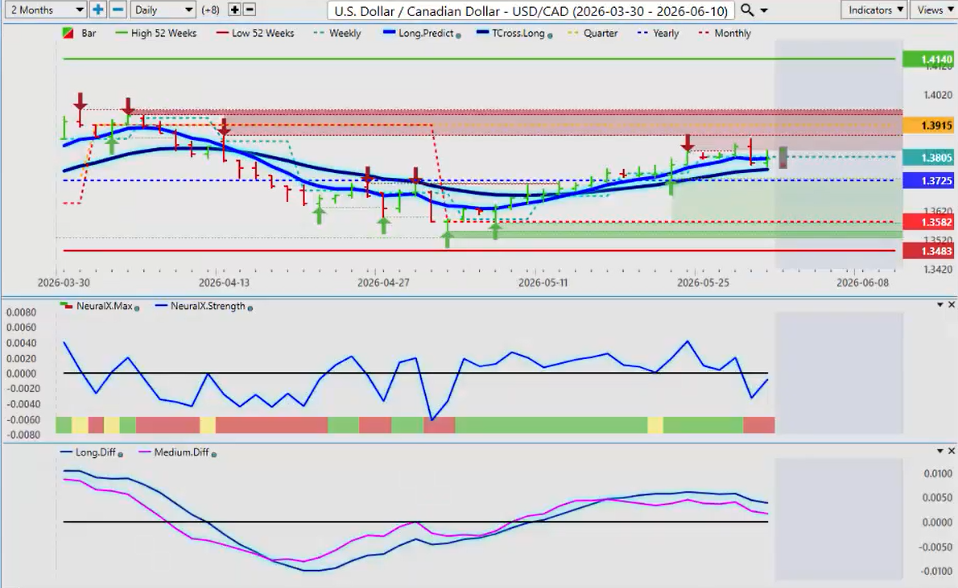
Canada officially, unofficially, moving into a recession under the latest liberal government. Looking for growth, and we’re actually not getting that.
We’re two quarters side by side of negative growth. That is a technical recession. If oil prices move lower, that’s going to be a pretty big hit for the Canadian dollar.
At 137.25, there’s a strong argument for longs. The Canadian dollar follows oil, but it also follows equities. If equities reverse higher, that could give the Canadian dollar a boost even in recession.
We’re forward-thinking, so we talk about fundamentals, intermarket correlations, and critical levels in our charts. Based on what I’ve discussed briefly here, it does favor the upside, the US dollar against the Canadian dollar.
Australian Dollar versus US Dollar ($AUD/USD)
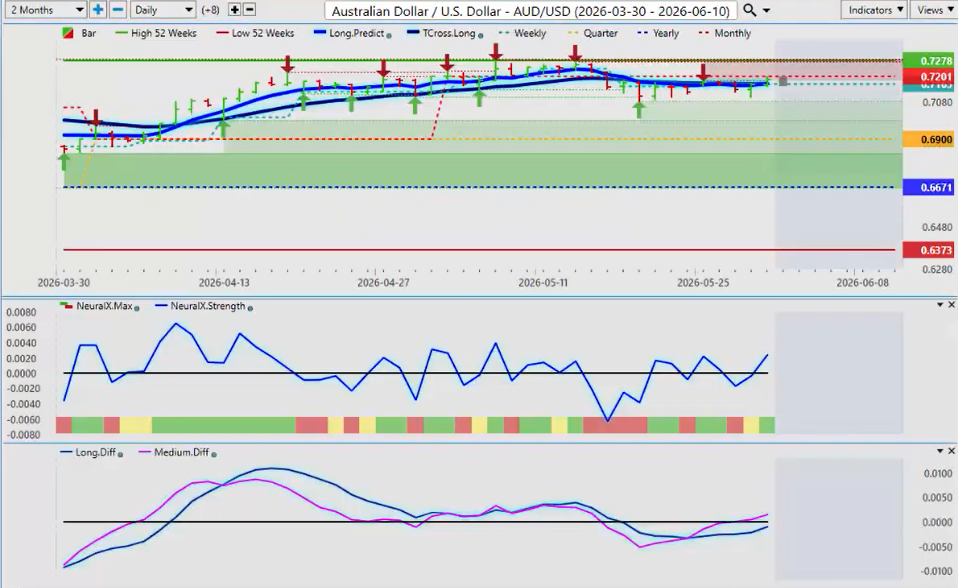
The AUD/USD and NZD/USD are two of the hotter currencies in the Forex market against the US dollar.
The Aussie has moved higher despite dollar strength. Quarterly at 69, yearly at 66.71, and 63.71 represents our 52-week high-low range. We are making new 52-week highs as recent as May 13th.
New Zealand Dollar versus US Dollar ($NZD/USD)
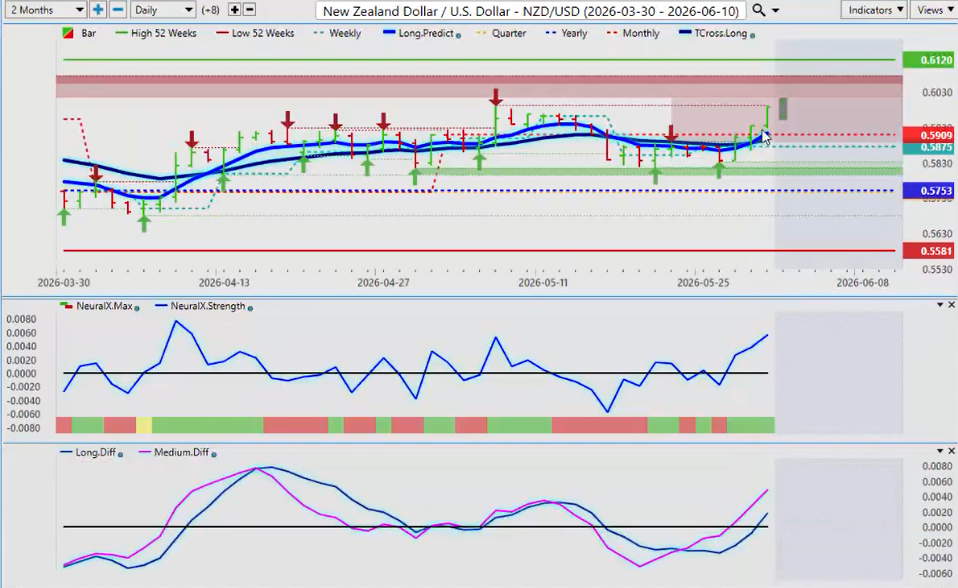
I believe both currencies will pull back, but these are also carry trade currencies now too. With Bank of New Zealand hiking, probably the RBA is going to hike. So, again, we still want to buy these currencies.
Even if we get a stronger dollar, buying the Aussie on a dip remains the preferred strategy. The Kiwi had a very good week, outperforming the Aussie. If we can get past verified resistance at 59.91, we can target the 52-week high at 61.20.
So, another choppy volatile week is coming with the US payroll numbers and all eyes on the Fed.
So, with that said, this is the VantagePoint AI Market Outlook for the week of June the 1st, 2026.


