


Welcome to the Artificial Intelligence Outlook for Forex trading.
VIDEO TRANSCRIPT
Hello, everyone and welcome back. My name is Greg Firman, and this is the VantagePoint AI Market Outlook for the week of July the 13th, 2022.
U.S. Dollar Index
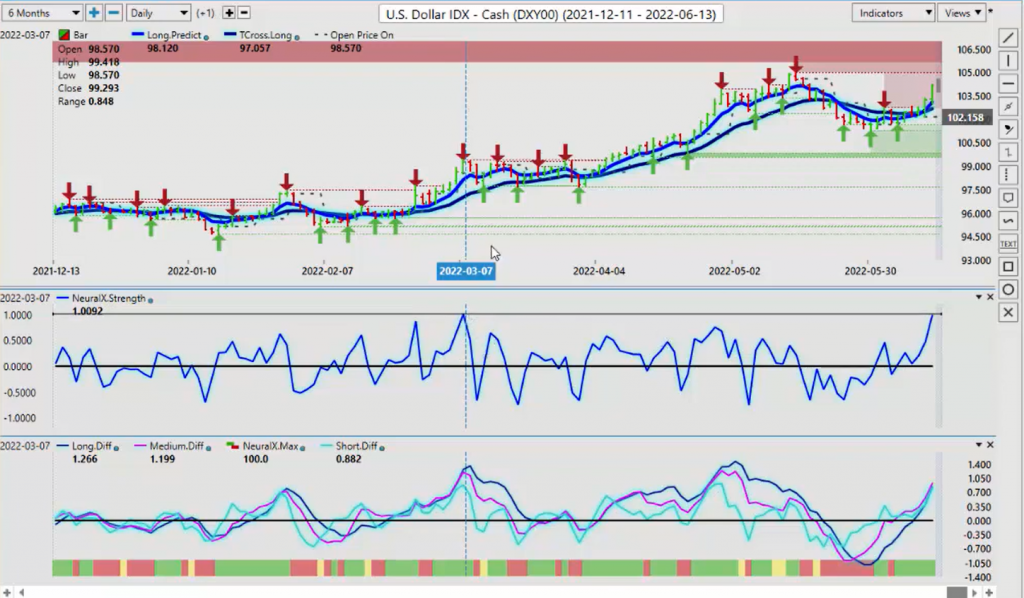
Now, to get started this week, we’re going to begin where we always do with that very important US Dollar Index that’s driving commodity prices, currencies, a number of different things, but we’re going to do things a little bit differently here. Now, the dollar has made a big push on Friday only, based around the CPI number that came out. Now, the first thing I’ll point out is the Neural Index Strength. This is the highest level I have seen the Neural Index Strength for many, many years. So if I put a line in here, into the Neural Index, what we will look at and say, okay, well, the last time the Neural Index reached this level was March of this particular year.
Now, if I go back several years, you can see that we have not been able to hit this. So this could be viewed as a form of over bought, or the fact that maybe the Dollar Index is overextended and the market’s overreacted to that CPI number in thin illiquid Friday trade. So right now, we have a target here. And that upside target would be 105. The question is, can the dollar advance up here? At first glance, this looks quite bullish. Well, let’s take a little closer look at this now, shall we? So what we’ll do is we’ll go to, in the VP Plus we can go to the monthly bars. So when I look at the monthly bars on this, the first thing I will take note here is once again, is the position of this. So if we look at the bar from June of 2021, these two bars are identical in nature. So we look at it. We’ve got a very bullish move right off the start.
And then from June 2021, basically right up until last month, we had some very strong bullish moves. But you’ll notice last month that we closed below the previous month. Now, in my respectful opinion only, that’s a huge warning sign here for me. So let’s go further with this. If we look at this over a 10-year period, then we start to see a very different structure to the dollar, don’t we? So the two bars that are identical in June of 2021 and June of 2022, but they’re in a very different location. This is at the bottom end of the overall range. This current bar for June 2022 is at the very, very top of the overall range. Now, I enjoy reading the VantagePoint blogs. There’s an excellent article on there this week that I couldn’t support anymore. And it talks about how Russia is actually winning these sanctions by pegging the ruble to gold and only accepting payments that way, not through the US dollar.
So once again, I believe that Putin has anticipated these sanctions. And now the ruble, while initially the ruble collapsed on the announcement of these sanctions, is fully recovered. It’s actually in the positive. Not only that, again, Putin is pegging that currency to gold. So the structure of the Dollar Index while maybe in the short to medium term looks very good for the dollar, the longer picture, longer term or medium to longer term picture is very, very much clouded. Now, most of the other countries, or a lot of the other countries, have raised interest rates. Basically, their currencies have sold off right afterwards. So this week the major event risk is, of course, the Fed. I believe the Fed has got this dead wrong, that they will not be… You have now, the crazies coming out of the woodwork, wanting a hundred basis point hikes.
That will send the US economy directly into recession. So I don’t understand the logic behind this. Yes, things are overheated, but this is all COVID-related. So again, I think that you’ve already got a couple of dissenters with the FOMC. So it will be interesting this coming week. And I believe the dollar will hold all of its gains until Wednesday or Thursday of this week. And then, we have to reassess this. So once again, before we take short-term positions, we should always look at the longer-term picture to have some idea where we are in the overall range. The dollar has not been able to close a month above these levels. And I can go back further and 10 years is far uglier than this, I will tell you that. The financial crisis of ’08, the dollar was heading into no man’s land. I think the index was somewhere down around the 70 level. They were talking about the dollar was going to cease to exist. That’s kind of silly, too.
But the thing is, we want to understand where we are. This is where seasonalities come into play that can be very interesting or tracking these types of money flows, because where the dollar rallied from in 2021 is very different from where it’s rallying in 2022. So that’s just a little tidbit there to remind everybody to always make sure you’re checking the bigger picture. So I believe the Dollar Index this week, based around these VantagePoint indicators, can get close to 105. But what we really want to look at for this particular month, where I’m going with this is we really need to see where the dollar closes the month of June and respecting the fact that there’s a known seasonality in gold that comes up around July, that’s another problem for the dollar.
But I believe they may have poked the wrong bear here, meaning the Russian bear and Putin has a game plan.
Gold
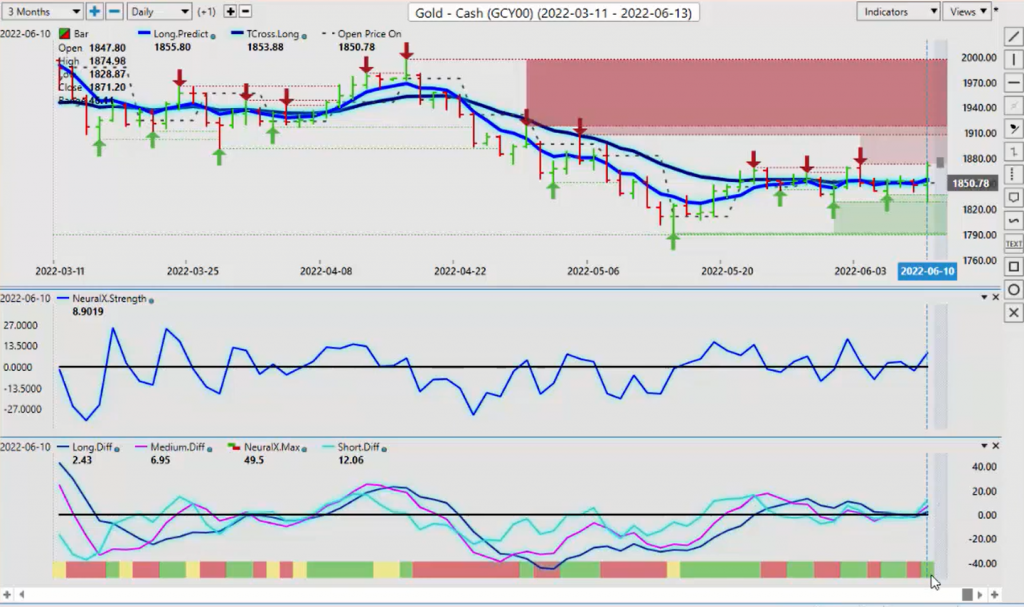
So this could have a direct positive effect on gold. I’m not saying it will. I’m saying I’m monitoring this, because as the Dollar Index went flying higher on Friday, so did gold. In my respectful opinion, over the 20 some odd years that I’ve been doing this, very seldomly do these two go up and down together for any length of time. So if we’re putting our money on something here, the Neural Index Strength on gold looks far better than it does on the Dollar Index. Clearly, the Dollar Index is grossly overextended.
It doesn’t mean it can’t go higher. But when we look at gold, it’s in a more of a breakout type of position. We have our predicted short, medium and long-term differences sitting above the zero line. Our Neural Index is green. We’re holding above our T-cross long at 1853. And we’re pressuring a verified resistance high. It’s 1873. Now, for gold to really get moving, in my opinion, we need to break above this level, 1910, 1918. If we break above this, this will confirm the price structure that I just mentioned on the Dollar Index, on a longer-term basis, because remember, theoretically, the dollar is backed by nothing, where now, the ruble is backed and pegged to actually gold. So I would really encourage everybody to look at the VantagePoint blog and have a quick read of that article, because I support what was written in that article 110%.
And, in fact, I thought it was a fantastic article that actually the media should be reporting on, not somebody blogging on VantagePoint. But I’m glad they did. So it educates us all that things are not always what they appear to be. And that’s the only point I’m making here. So right now, I believe towards the end of the month that gold can target this upper level based on what’s happening in the Russia and Ukraine, the very intricate chess game that Putin is playing here and fully anticipated, in my opinion, these sanctions that aren’t working, in my view, or maybe some people would say they are, but I don’t see it. I think that Putin’s getting everything he wants. So again, hopefully, we can do something to help the Ukraine. But I’m not convinced at this time that it’s going in the right direction.
So this opens the door potentially to more longs on gold.
We’ve got the FOMC. You can expect a pullback to the VantagePoint T-cross long. That level is coming in at 1853. The theory here, we’re long while above 1853. But if we cannot break through these verified zones, then there could be a move lower.
S&P 500 Index
Now, if we were take the intermarket correlation to this, and again, if we get dissenters, or in the FOMC press conference this Wednesday, if they start talking about, “We’re going to wait and see. We don’t know if we’re going to go with 50 basis points. Maybe it’s 25. Then maybe we’re going to pause.” Now, the second they hinted at that last month, the dollar immediately tanked. But even if they do keep hiking, that’s not likely going to help anybody in the US with mortgages, with lending. It will make things worse, in my respectful opinion, and potentially cause a recession.
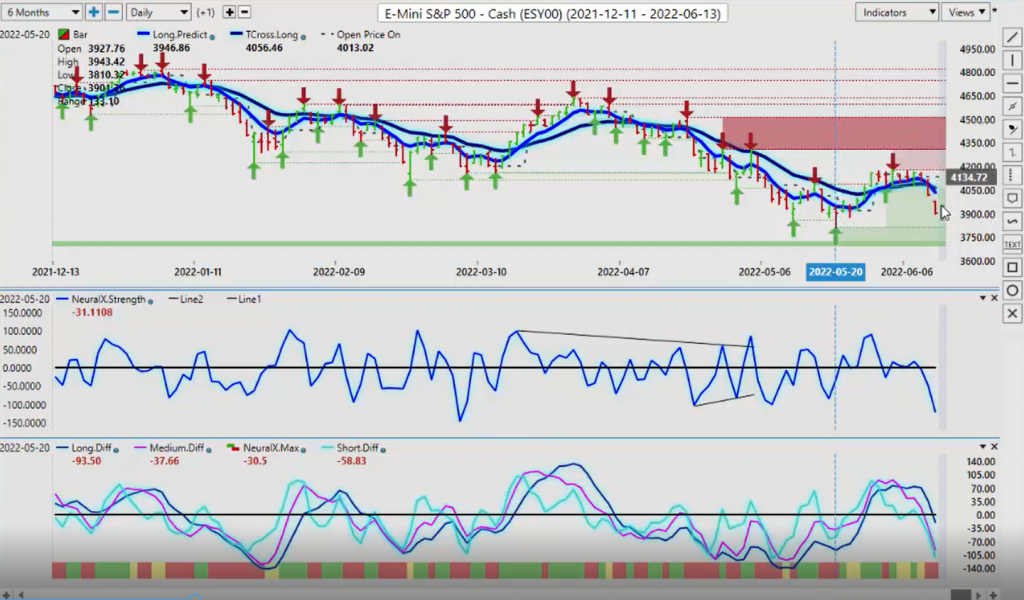
So the potential, just the potential for a turnaround in the S&P 500 is entirely possible after the Fed, possibly in a week, two weeks, or maybe even on Thursday or a Wednesday, if the Fed says the wrong word. So it’s a very event-driven week with that FOMC. We’ve got the Bank of England. But we still have a verified low coming in at 3810. So we’ll be watching this area very, very closely. Again, in my respectful opinion, if I look at that Neural Index Strength and I put a line on here, and you can see that I like to draw trend lines, too. That’s just me. I’m a big trend line guy. But there’s your low point. And that came again back, by looks of it, March the 7th of this year. And then we recovered off that when the Neural Index Strength had hit that particular level. So a few more days, maybe a week, we will definitely reassess. But absolutely, the VP software is correct in saying that this is going lower, at least in the short to medium term.
Crude Oil
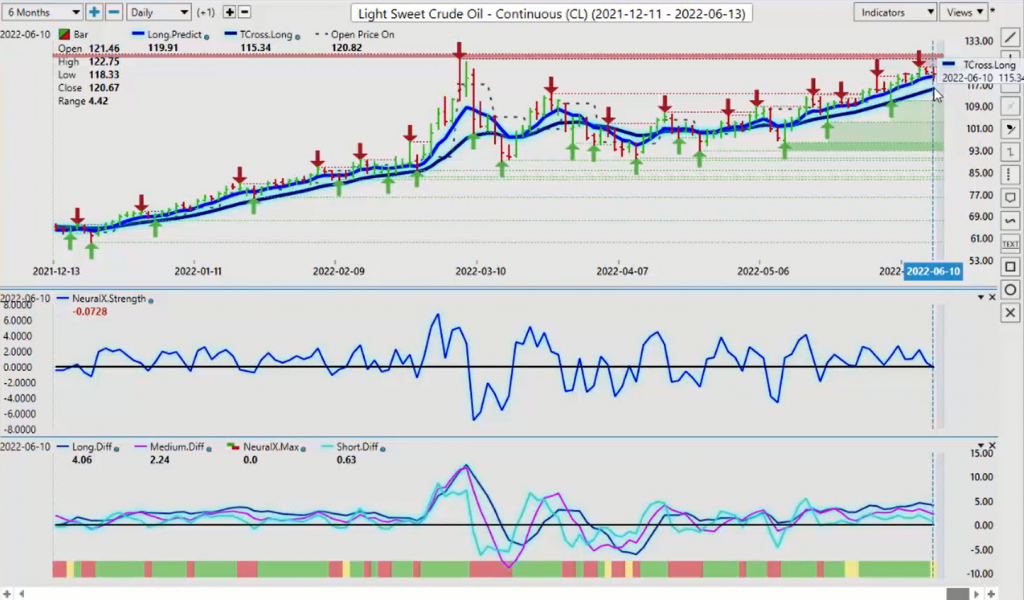
Now, with oil prices, again, I’m a little bit shocked here that the equities aren’t being held up more by oil prices. But once again, crazy prices at the pump in Canada. We are just getting killed up here, 2.20 a liter. So you guys apply, I think there’s four liters in a gallon. So we’re approaching the eight, nine bucks a gallon mark here, which is absolute insanity. So even years, and years, and years ago, when oil went over a hundred dollars a barrel, we were nowhere near this level in gas prices. So I think that the masses are getting very angry with this. But we’ve still got buyers coming in. But heavy verified resistance at the high of 126 at approximately the 12621 area. Again, you can see that date March the 7th, very similar to the equities there. So if oil can get above this, it is possible with hurricane season coming into play, summer driving.
But I don’t know how much summer driving we’re going to have this year, because again, with these prices, it’s really hurting everybody at the pump. So I don’t think people are looking at doing long summer driving trips like we used to do 4, 5, 6 years ago when oil prices were down. So right now, oil remains firm. And again, we want to focus on the T-cross long, 11534. But our long predicted, our immediate support for the week is 11991. Now, we should see some kind of pullback in an anticipation of a very hawkish Fed. But in my view, he wasn’t that hawkish in the last meeting. So I will be watching his comments very, very closely.
Bitcoin
Now, when we look at this, I like to talk about Bitcoin, because again, Bitcoin, remember, guys, I’ve mentioned this almost in almost every single weekly outlook, that it’s perfectly normal for gold going down at this particular time. We can see it last year. The seasonal pattern, two very strong seasonal patterns that I’ve played with Bitcoin over the years, one is in the mid-July. And another one that I really like is in September to November. So we’re approaching that. We’re only maybe less than a month off of this. So I expect further downside on Bitcoin and then a potential reversal higher. But we’ve got to get the tech sector, the NASDAQ and the S&P, moving higher to assist with that. But for now, I think we should expect further downside. I think VantagePoint’s done a very good job of calling this. We’ve got verified resistance now.
That high is coming in at 31,724. But if stocks turn around, guys, then you immediately want to look for an alternative trade. Bitcoin is the one you want to watch. It’s highly, highly correlated to the S&P and the NASDAQ. And if they turn around, Bitcoin will also. So right now, we’ve got a low in here at 28,136. I think we are currently breaching that, as it is trading over the weekend around the 27,000 mark. We’ve got the additional verified zone at 25,919. I think we want to watch this level very closely and then match it to a potential that if the dollar cannot advance, then, and it starts selling off like it did last month, then this is what would be the crack in the dam, and would potentially open up the door for longs on Bitcoin and the S&P 500, not to mention gold.
Euro versus U.S. Dollar
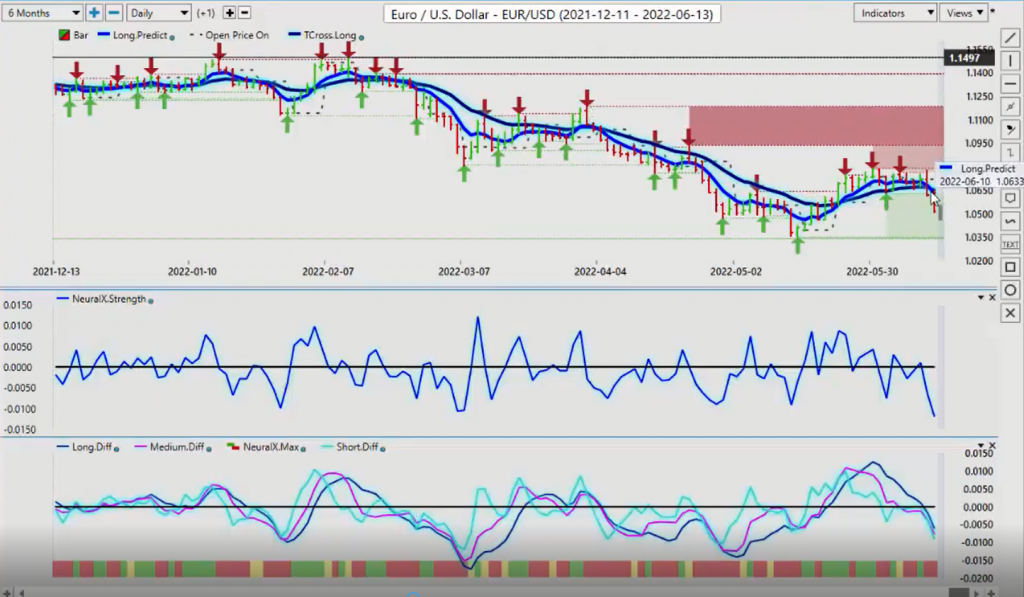
Now, as we look at some of the 4X pairs going into this week, once again, the Eurozone talking about hiking. The euro had a very good week up until about midday Thursday. And then we closed very bearish in the anticipation of a strong CPI number. We’ve got that number. But what very often happens is these types of erratic moves on a Friday and thin illiquid markets when the big banks aren’t in there, it tends to follow that up for part of the day on Monday. And then on Tuesday, it starts reversing. I believe the euro will remain under pressure to begin the week because of the FOMC. Then after the FOMC, that’s when we want to potentially look for longs here, because again, any type of dovish comments from, from J. Powell and the gang, that will immediately affect the Dollar Index, which indirectly immediately affects the euro US.
I’ve discussed this many times in this weekly outlook and in the VantagePoint Live training room and in the seminars we hold in Tampa, that the correlation between the euro US and the Dollar Index is a hundred percent inverse correlation, meaning one goes up, one goes down. They do not go up and down together, guys. And despite the talk of interest rates, the talk of doveish ECBs, you can load up all the information you want, but at the end of the day, if the Dollar Index cannot advance from a very difficult level, where it is right now, then that would breathe life into the euro. So for now, it’s absolutely moving lower.
To begin the week, our long predicted, our resistance is at 10633 and 10650. So I anticipate we could test this level early midweek. But if we get back above 10650, the T-cross long, by the end of the week, then that would tell us going into the end of the month, gold would be doing better. The euro would be doing better. The dollar would not be doing better. So we watch these levels very closely. And once again, I will point out that the Neural Index Strength has not been at these levels in the euro for a very, very long time. I would argue all the way back to here.
Now, that Neural Index Strength right there, you can see that hit. We’re still not down at that level yet. So again, this will be a very interesting week. But for now, there is still a slight, at least until we get to the FOMC, that there’s still a bearish undertone to the euro.
U.S. Dollar versus Swiss Franc

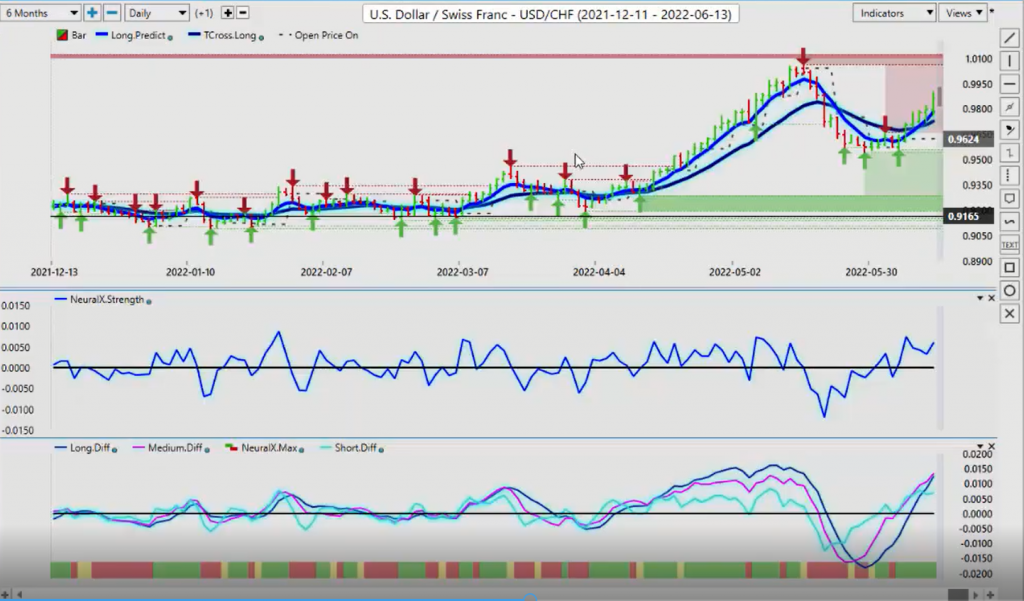
The US Swiss franc is advancing. But once again, it is not advancing the same way that the dollar-yen is. Now, this is another low-interest rate currency, meaning the Swiss franc at -.75. This is by definition, the carry trade. But as you can see, that last month, right around the May the 16th, the US Swiss franc ignored all dollar strength, ignored the FOMC, ignored all of that. And there was no real reason other than the fact that you still have safe haven flows going in here.
So to begin the week, there is a bullish tone. But again, this is a weekly outlook, not a daily outlook. So I can only advise you to be very cautious with loans on this pair after Wednesday. So until then, I believe that we could move back towards the parity level. But you can see that once again, I remember trading this pair for years, well above parity. Well, well, well above parity. But this pair has not been able to do that. It’s showing the depreciation, in my respectful opinion, of the US dollar. So we need to be cautious here. But I think in the near term, parity is a reality. The indicators from VantagePoint support that. But again, once we start getting towards that parity level, we want to be very cautious with longs, unless the Dollar Index can make a sustained break of the 105 level.
Once again, guys, what is 4X? 4X is, essentially, buying or selling US dollars. That’s essentially what it is. So the levels that I’ve shown you on the Dollar Index, and not to mention the fact, even by the CFTC data, this is a very crowded long trade on the dollar, extremely crowded. So we want to be cautious with that. But if that Fed hints that maybe a bunch of rate hikes are not that great of an idea, or they may be backing off their position a bit until the data, they see how the economy recovers, that would be a dollar killer, is what it would be. So be very, very cautious with that.
British Pound versus U.S. Dollar
The pound-dollar this week, once again, back down it goes. But we do have the Bank of England this week. I would anticipate that we could see a retest of 12156. This is a big level for the pound to hold. If we cannot hold this level and we go lower, that could open the door. I can’t believe we’re down here again after Brexit, but we are. And that low is 12252. You can see that verified zone there. So once again, this is a big hurdle. But 12150, it too is a big hurdle. When we look at what the pound has done, with Brexit and everything else, does anybody remember that week? That was a horrible couple of days for the pound, where it actually hit down into the 114 level. So if you think things can’t go lower, guys, always remember they can. Conventional overbought and oversold indicators can be very, very frustrating, especially when you’re using them in shorter timeframes.
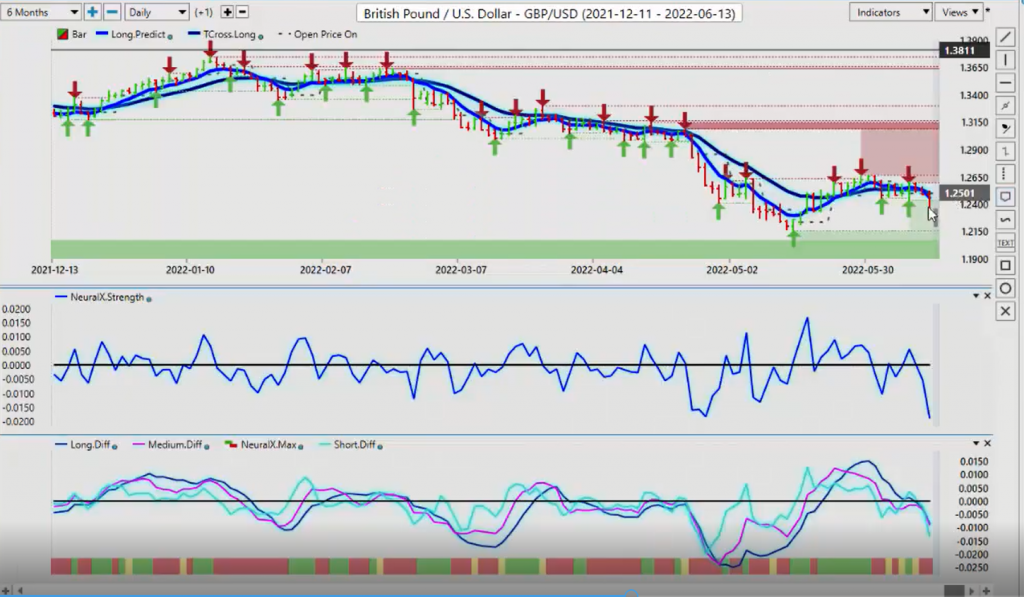
So for now, I believe at least up until Wednesday, the pound has got its eyes set on 12150. And there’s a strong possibility it will reach that. But I also believe that the pound has a strong possibility of recovering going into month end. So we will see how we manage this particular level this coming week and what we get from the Fed. But once again, we see throughout this presentation, like the Neural Index, you see it as red, green or yellow, which is caution. But inside of the Neural Index is a core value that I look for, because these levels are grossly, it tells me when the Neural Index is overextended. So it doesn’t mean it’s going to go higher, because it’s so low. But it does warn me that, “Hey, maybe shorts are not that great of an idea down here.” Once again, as I discussed in last week’s weekly outlook, be careful of these types of gaps.
The predicted high is 12353 on the pound-dollar. However, our first and favorite support is the long predicted. That is at 12458, the T-cross long at 125. So I would respectfully submit that with the volatility that we’re likely to see on Monday and this week, to predict it high would not be my best entry point. I would be more inclined to use the long predicted at 12458 at a very minimum. And if it doesn’t get up to that level then so be it. But I don’t want to get caught in a bear trap down here. As we get past the Fed and if the dollar cannot advance past that, then we look at this as a fire sale across the board here of potential places to sell US dollars. This would be one. Euro-US would be another. US-Swiss franc possibly, but again, we’re either buying or selling US dollars. That’s the decision that traders must make.
U.S. Dollar versus Japanese Yen
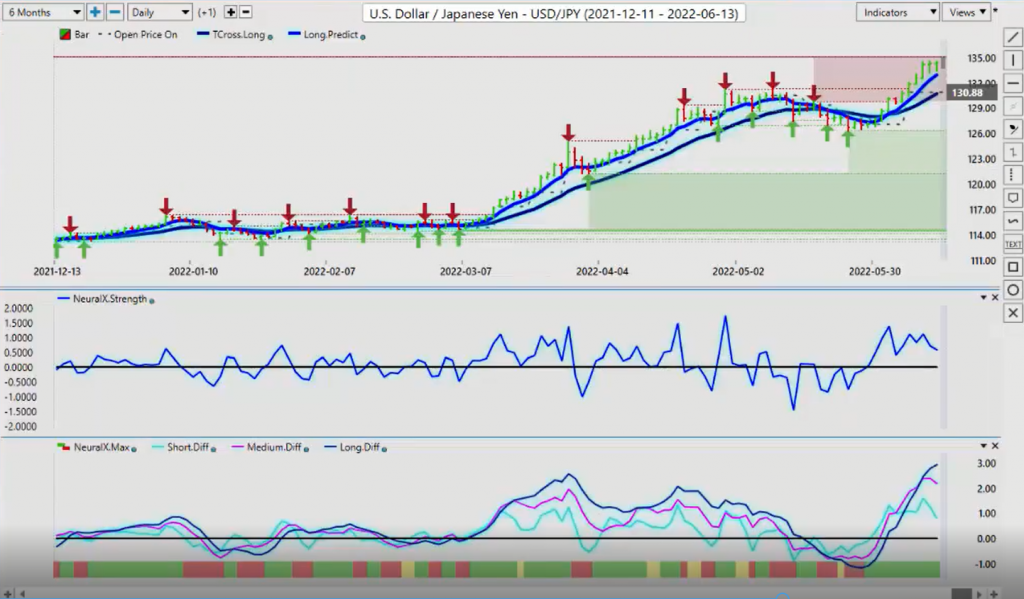
Now, the dollar-yen pair this past week, I kind of got a little bit of a chuckle out of this one, because you could see that something was really off with this pair right out of the get go. Somebody stepped right in and started buying this before the week really even started. And they’ve taken it all the way up. But now, we’re at a very tricky level here. I didn’t think we would get anywhere near this verified zone, but you’ve got a big level at 135. And I would imagine that there’s massive exotic barrier options up here that they’re going to try and run. So maybe a quick pop over 135. In my respectful opinion, we should be getting ready to brace for a pullback here. The concept here, which has absolutely nothing to do with Elliot wave, Fibonacci or any of that stuff, is strictly the predicted moving average.
The further we move away from it, the more likely it is we’re going to retrace to it. 13072, we are almost 500 pips from that particular level. That is one way that I gauge pullbacks, the distance between the market price and where basically fair value is at the long predicted or the T-cross long. We’re grossly above fair value here. Every time the Bank of Japan has intervened in a medium to longer term, like the Swiss franc, didn’t work, guys. And there was intervention all over the place with this pair. So again, I will monitor it. But we do have the medium term crossing the long term predicted difference saying this trend up here is not strong, is what it’s saying. And the short-term predicted differences pulling back. The Neural Index Strength is pointing down, not up. So again, we’re losing momentum. We’ve got three days where we’re all bunched up, just under that 135 level. So keep your eyes on that.
But if we go a quick spike above 135, but it doesn’t hold above 135, then be prepared for potential shorts here.
U.S. Dollar versus Canadian Dollar
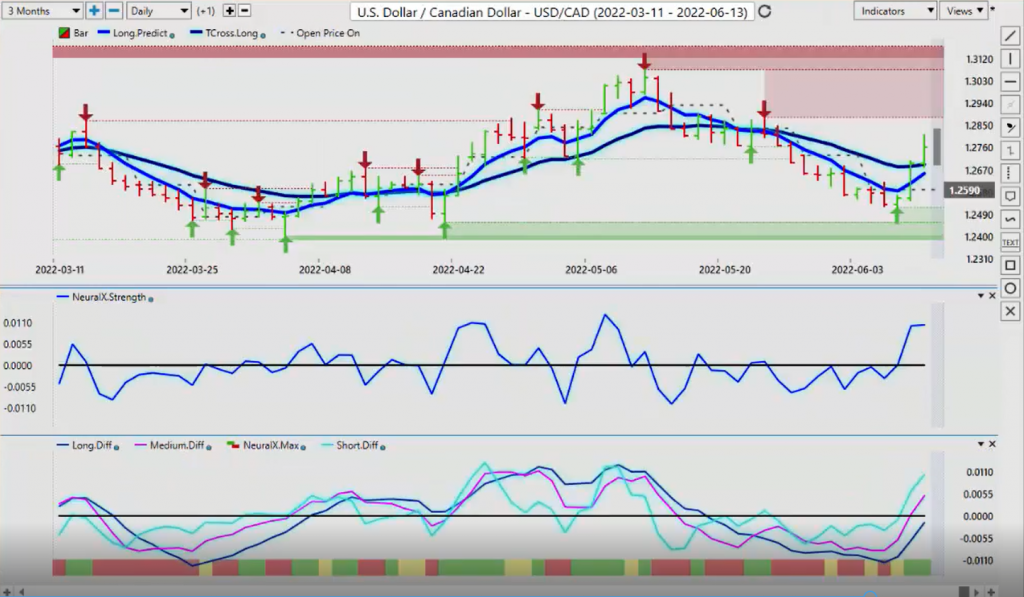
Now, with the US-Canadian pair, very strong data that’s come out of Canada, the unemployment numbers on Friday. But again, I believe that this CPI number was likely leaked, because people were buying dollars on Thursday and Friday before the CPI number came out. This number has been leaked previously. All kinds of data has been leaked in the past. But I have no evidence of that. I’m just saying I’ve seen this one before. So right now, we have very strong verified resistance at 12885 and even stronger resistance at 13076. I think it will be very difficult to breach the ladder up at the 13076 area. But the first level for a potential short would be around just under the 129 mark.
Now, my view here is that the Neural Index, despite the Neural Index Strength, excuse me, has had a big move. We’ve had a very strong move up on Friday. But the Neural Index Strength has gone completely sideways. Now, we see the Neural Index itself is green, saying up. But again, these two are saying two completely different things. And this is where I would look at this as a warning sign that potentially this is not what it appears to be. So our T-cross long is at 12691. If the US-Canadian pair advances to the upside hard on Friday, 90% of the time, guys, it reverses on Tuesday. We’ve worked at this at the seminars. We’ve worked on it in the VantagePoint Live training room. And I’ve discussed it on this presentation each week, that this pair is notorious for Tuesday reversals. So again, watch to see what the initial move here. I anticipate the initial move out of the gate will be to the upside.
But I think that the sellers are going to be camped out up here, because let’s face it, commodity prices are not going lower anytime soon. And the only thing that’s pushing this higher is the selloff in the S&P. So if the S&P 500, the inter market correlation here you want to watch is the S&P 500. If it recovers after the Fed and starts moving higher, US-Canada will immediately move lower. And the other pairs that will follow this, which I too believe are potentially a fire sale here, if the stocks turn around and gold remains firm, that supports the aussie and the kiwi.
Australian Dollar versus U.S. Dollar
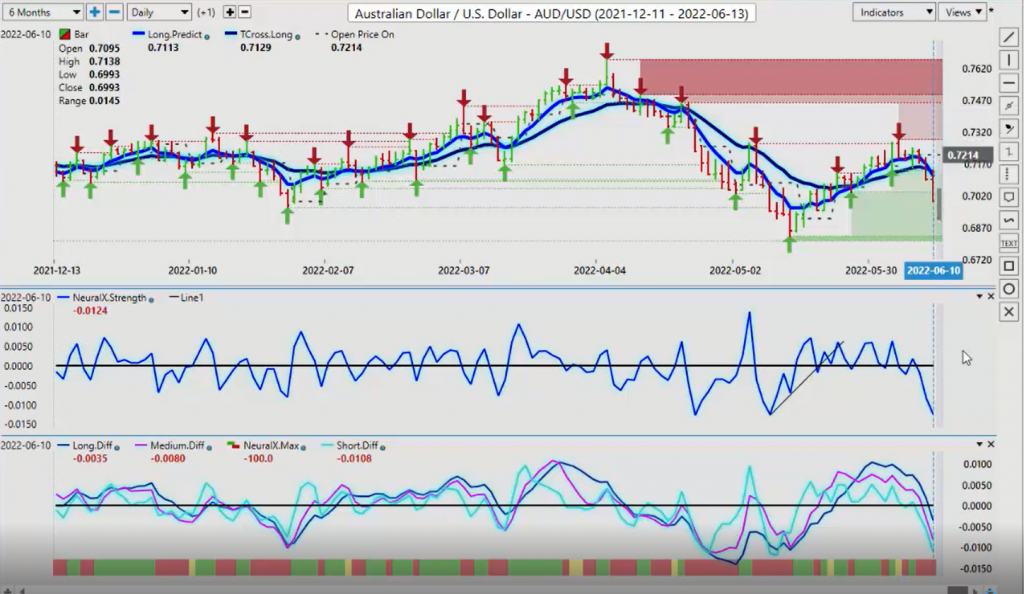
So once again, that Neural Index Strength is grossly over extended, in my view. So if I look at this over the last year or so, any time that we’ve hit this point in the Neural Index Strength, you can see that there has been a substantial bounce.
And the same thing could be said for the kiwi, when we look at it. It appears that it may have a little bit more downside here. But still, what we will be looking for is, again, if the dollar falls out of favor with the market, then aussie-US longs, New Zealand-US longs, that could be a very good place.
New Zealand Dollar versus U.S. Dollar
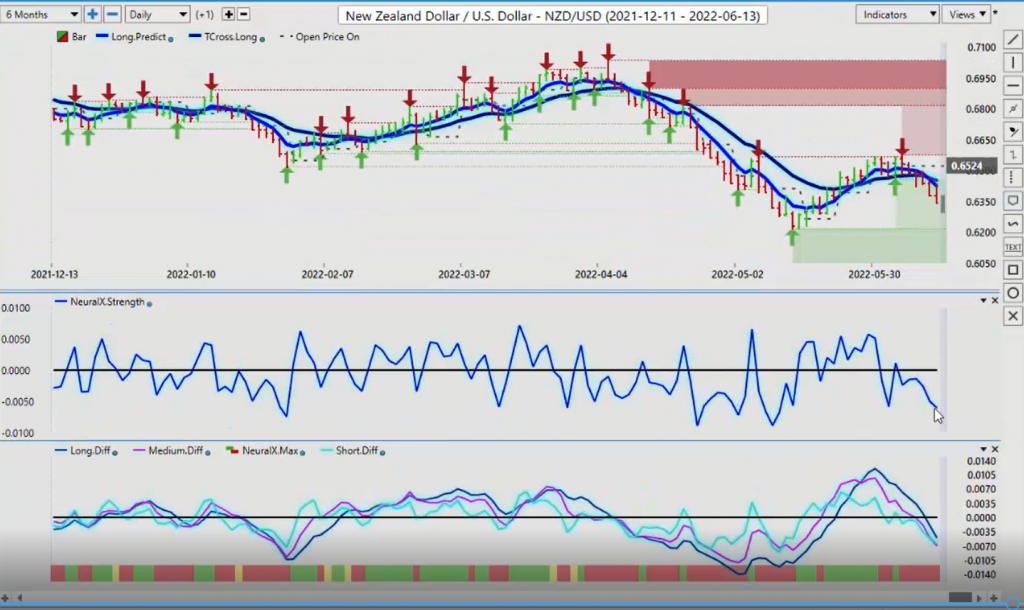
So we’ve got a verified support low, 6217. If we lose 6217, for any length of time, I would be shocked. The only time we have ever got down this low on this currency is during COVID. The initial spike in the dollar then the emergency rate cuts, that killed the dollar and sent it higher. So once again, you can see how interest rates play a big part of this. So we’ve got to be cautious next week, but with that, there is going to be opportunity. So with that said, this is the VantagePoint AI Market Outlook for the week of June the 13th, 2022

