Welcome to the Artificial Intelligence Outlook for Forex trading.
VIDEO TRANSCRIPT
VantagePoint AI Market Outlook — Week of June 15, 2026
US Dollar
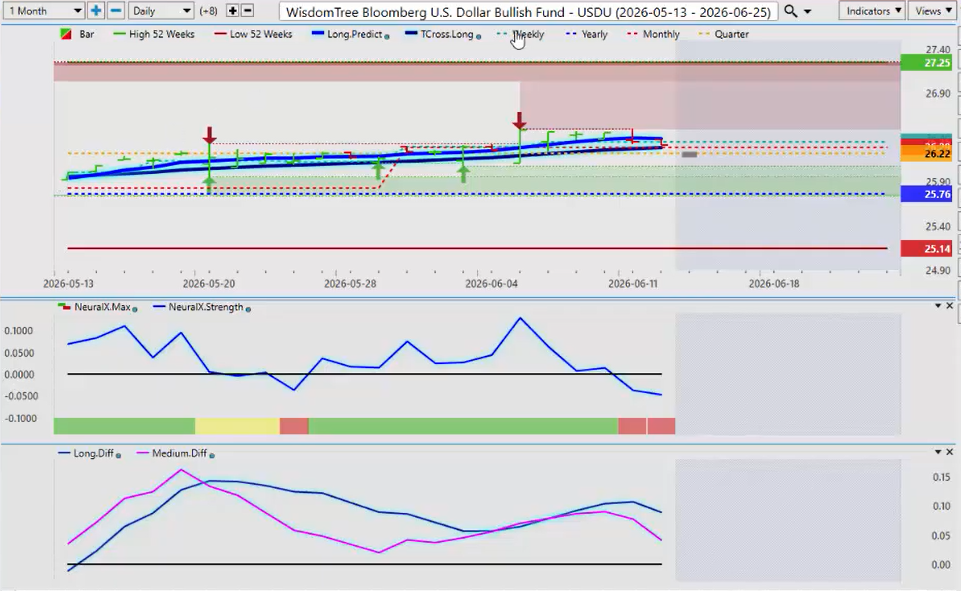
My name is Greg Firman and this is the Vantage Point AI market outlook for the week of June the 15th, 2026. Now to get started this week, we’ll begin where we always do with that very important US Dollar. Now looking at the Wisdom Tree USDU, a broader look at the US dollar and how it’s doing against a larger basket of currencies including the emerging markets. So, for now, the dollar remains on the TCross Long within its 52-week high and low, but the primary level we want to focus on is that calendar yearly opening at 2576.
So, going into next week’s trading, we can see the Neural Index is pointing down. We have an MA Diff Cross that has occurred. Now it is corrective in nature because we’re above that critical TCross level of 2628. Now if we lose this level next week then that would put pressure on the dollar and that would be perfectly normal at this time of the month.
So again, looking at those core indicators, we’re losing the dollar momentum and despite that data this week that was fairly warm is what I would say. The PPI number was better than the CPI number. But all eyes are going to focus on the Fed in the days and weeks ahead of whether they’re going to hike or whether they’re going to cut.
Gold
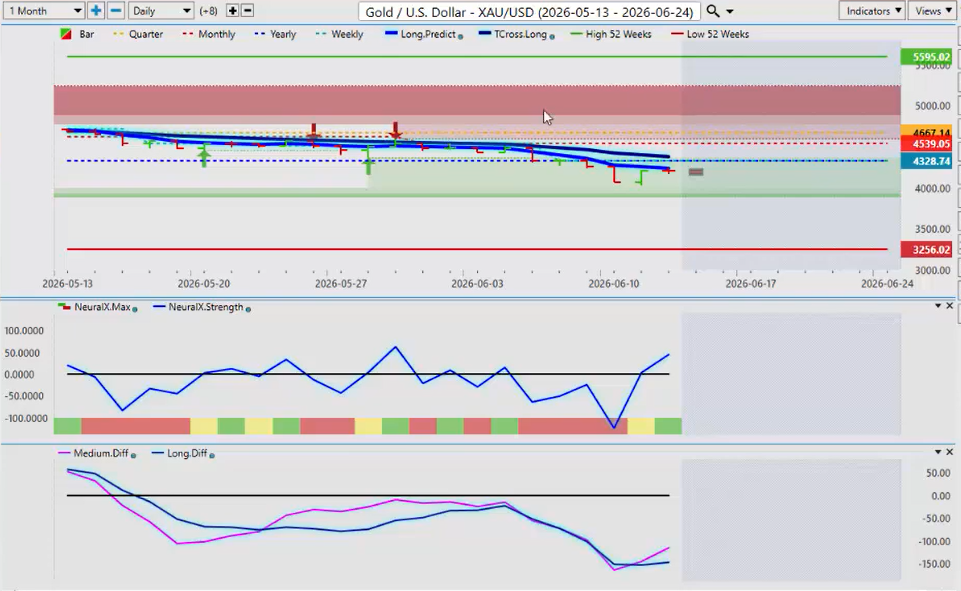
Now, all of this talk of hikes has put downward pressure on Gold, but now we can see an inverse signal going into next week’s trading because once again here, guys, this is an outlook, not a recap of something that’s already occurred in the previous or current trading week. So, going into next week’s trading, I believe gold will still rebound here and is the better play.
Now looking at it for Monday’s trading, the Neural Index is pointing up. We’ve got green on the Main Index and we have a very important MA Diff Cross which is telling us we’re going to get at least a correction higher back up to our TCross Long 4381. If we can push through that level next week, then gold will remain in a solid uptrend.
Now, again, we always want to be mindful of that calendar yearly opening price coming in at 4325, but also the 52-week high and low, 3256, 5595. So, I believe the market will see this as a bit of a fire sale down here, and they’re going to look to get long on this probably by Tuesday, Wednesday, next week.
S&P 500 (SPY)
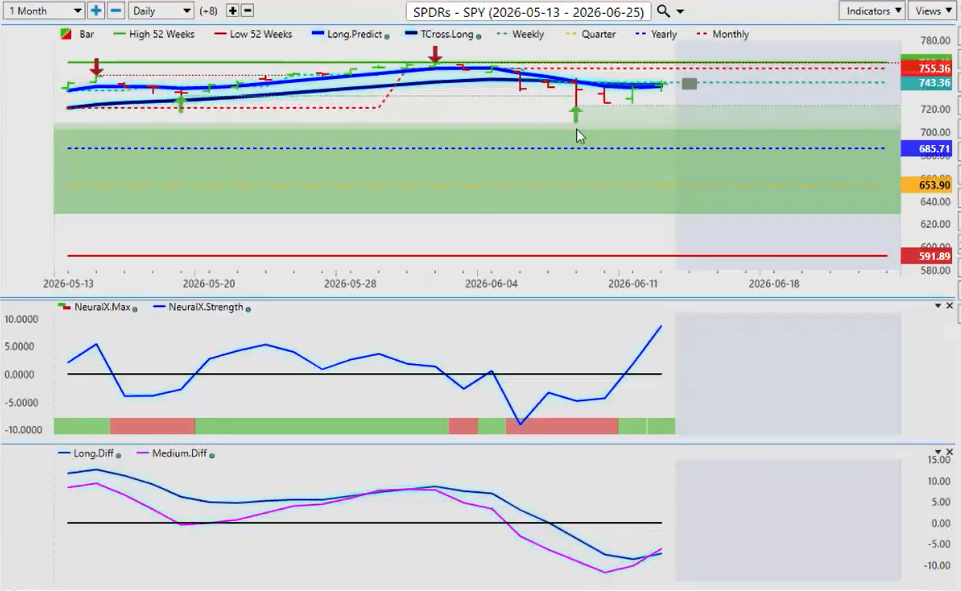
Now, when we look at our main equity markets, very important that we look at all of them here. Once again, that MA Diff Cross, the medium-term crossing the long-term Predicted Difference, a zero lag indicator, guys. And again, this is what we want, a very quick way to identify if the trending move lower on equities is real.
I don’t believe it is. So, as you can see, we remain positive on the SPY on the year above 685. And again, now we’re pressuring that TCross Long. We get a break of that area of 74167 and we extend higher.
Now, we did set a new 52-week high back here at the beginning of June. So, again, a corrective move lower and it looks like we’re getting ready potentially to move higher again.
NASDAQ 100 (QQQ)
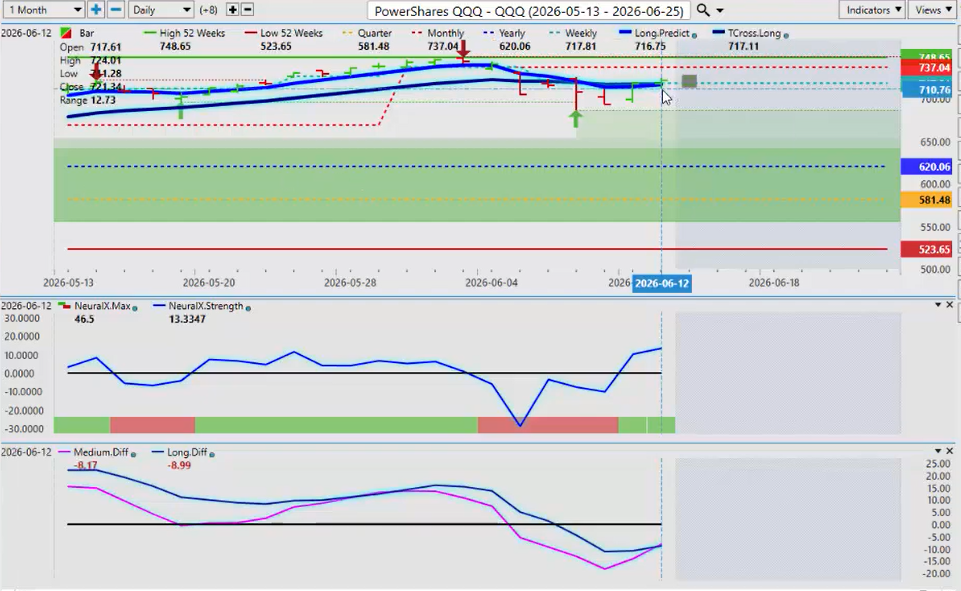
Now, we also want to make sure we’re looking at the QQQs. We can see that they’re very, very similar. We made that 52-week high here the day after the S&P 500 did on June the 3rd. We’ve had a move lower with all this talk of rate hikes, etc.
But the market is blowing it off again because most of your investors are not going to move into the bond market. They want to stay in the stock market. So the QQQs are looking pretty good. We’ve closed above the TCross Long at 717.
Keep an eye on that level, guys, next week. That’s the level we want to stay above. That’s fully supported by the Neural Index turning positive and the Neural Index strength. And again, we have an MA Diff Cross that is warning us of additional strength coming.
Russell 2000
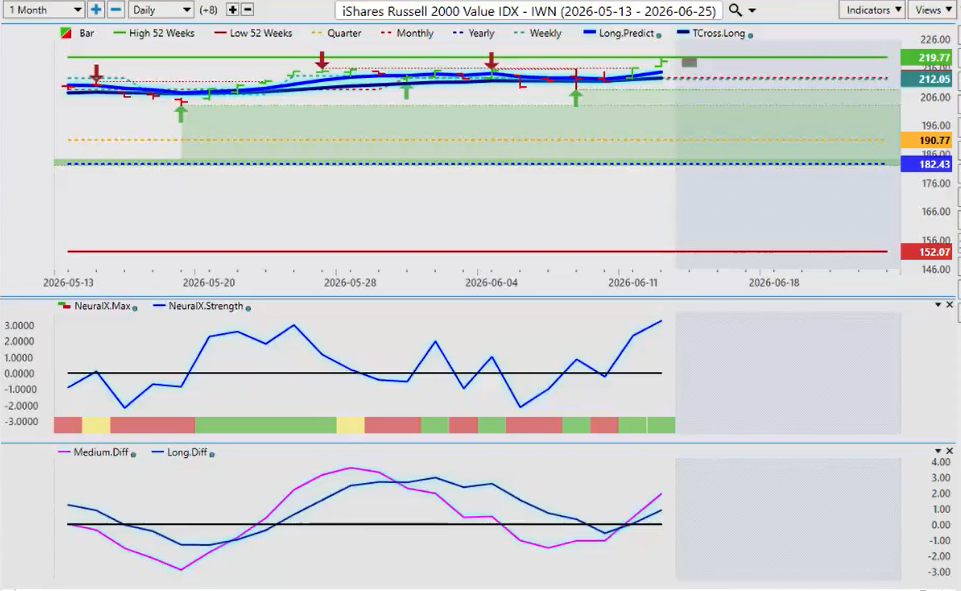
We also want to make sure we’re looking at the Russell 2000 here, doing a full broad scope of the main indices. The Russell actually, I would argue, is the stronger of the group and it’s really advanced, making another 52-week high, 21977.
Very strong push. Looks like it’s coming here. The Neural Index pushing up to the upside. MA Diff Cross here, both the medium and long-term Predicted Difference. That means we have a medium-term crossover, which is the pink line, and we also have a long-term crossover, which is the darker colored blue line.
And again, continuing to make 52-week highs. That’s what we look for.
DAX
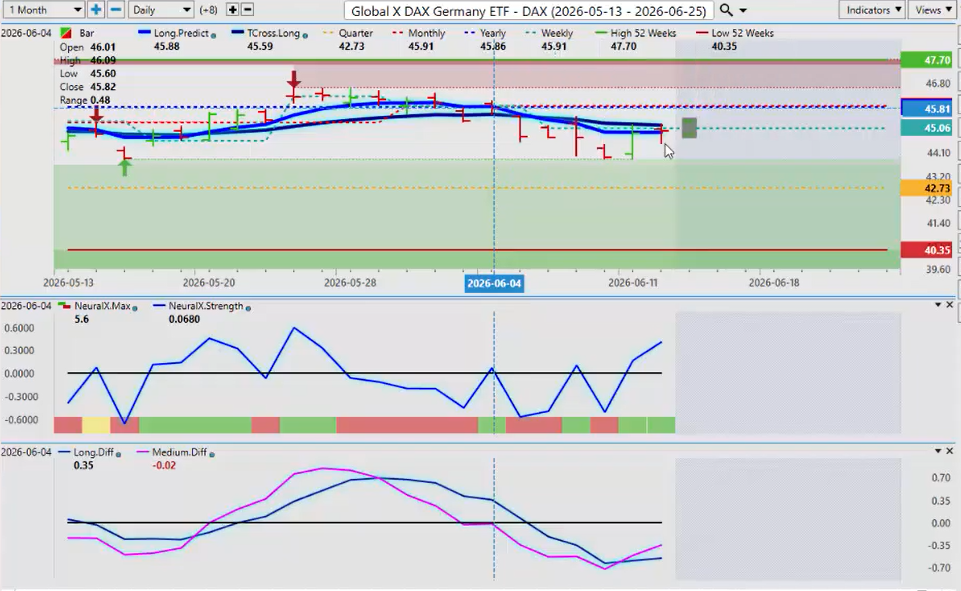
Now again, if we look at this on the German side of things, bit of downward pressure here with that rate hike from the ECB, but I believe the market was already baking that in and we’re getting ready to turn higher. Now, watch your Euro/U.S. currency pair. I’ll talk about that in a moment here, but keep a very close eye.
If the euro turns higher against the dollar, that will support buying the DAX next week. So again, that all-important MA Diff Cross is occurring right now. We’ve got a Neural Index that’s strong.
And always remember what I’ve talked about in previous weekly outlooks, that when the dollar goes down, just about everything else goes up. So that’s what we want to watch very closely. But again, that key level on the Global DAX is, of course, the TCross Long 4517. We just need to get above that and then we can retarget 4586.
VIX
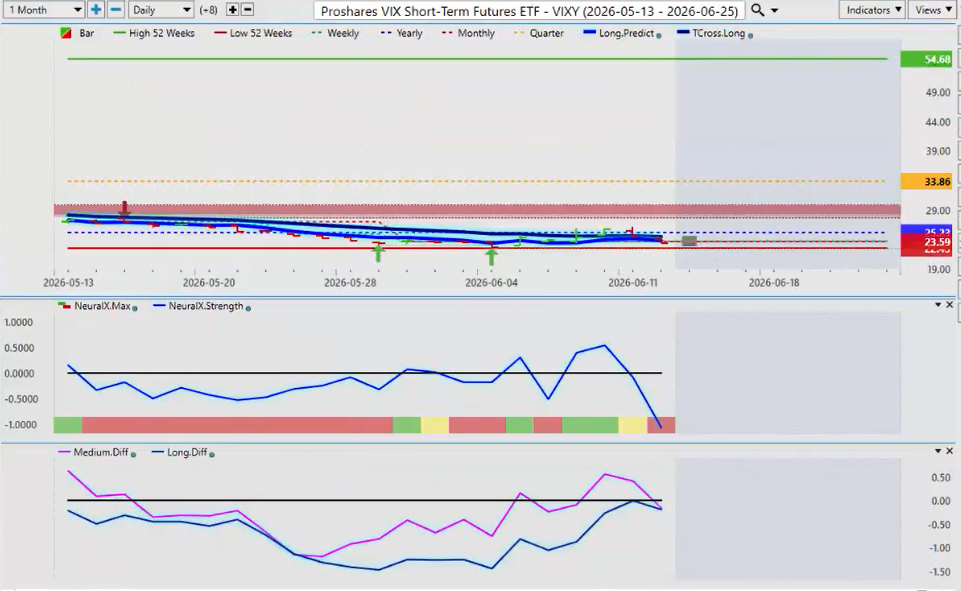
Now again, if that dollar can move lower, we want to look at the VIX because that will help confirm this. If the VIX is moving down, that would tell me that the dollar is going to follow the VIX. So using these intermarkets to determine what the core market we’re trading is going to do is extremely powerful, guys.
And that’s the basis of the VantagePoint software. So again, pushing for another 52-week low on the short-term VIX futures looks inevitable for next week, but again, we do have some support down here, that 52-week low that’s coming in at about 2245.
That’s the area. If we break down below that, you’re probably going to get some panic selling on the VIX from there.
Bitcoin
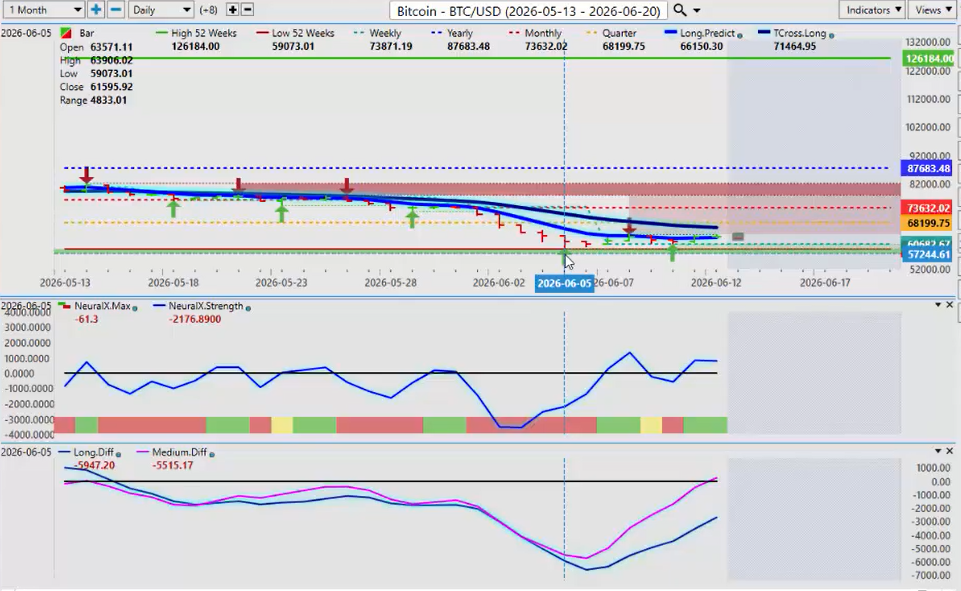
Now, looking into Bitcoin for next week, once again, 52-week low, that’s coming in at 59,73. So, the market may see this again as a type of fire sale where they’re saying, “Look, this is cheap. Let’s get long here.”
So I believe they very likely are going to do that. But I also anticipate further downside pressure on Bitcoin, at least until about August. So any move higher here would be corrective in nature unless we can get above the yearly opening price 87,683.
That is your critical number.
Crude Oil
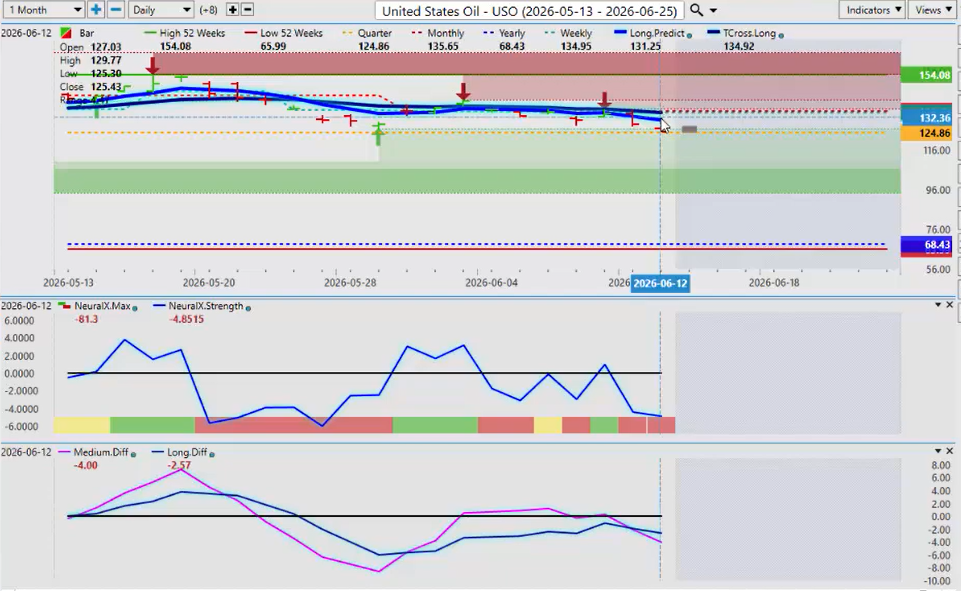
Now with Oil prices for next week, once again, a lot of rhetoric. There’s a deal between Iran and the U.S. There isn’t a deal. There is a deal. It just keeps flip-flopping back and forth. But Iran is not confirming a deal, not at least at the time this presentation is being done on Saturday evening at 5:00 p.m.
So, for now, oil could still rebound if there is no sign of a deal coming anytime soon. The indicators in VP are warning that there is more downside pressure. There’s your MA Diff Cross pointing down. Neural Index is also down.
We’ve broken down below our TCross Long, but that would be our retracement level, guys, 13492. But the indicators are suggesting we are going lower, probably by midweek.
Euro / U.S. Dollar (EUR/USD)
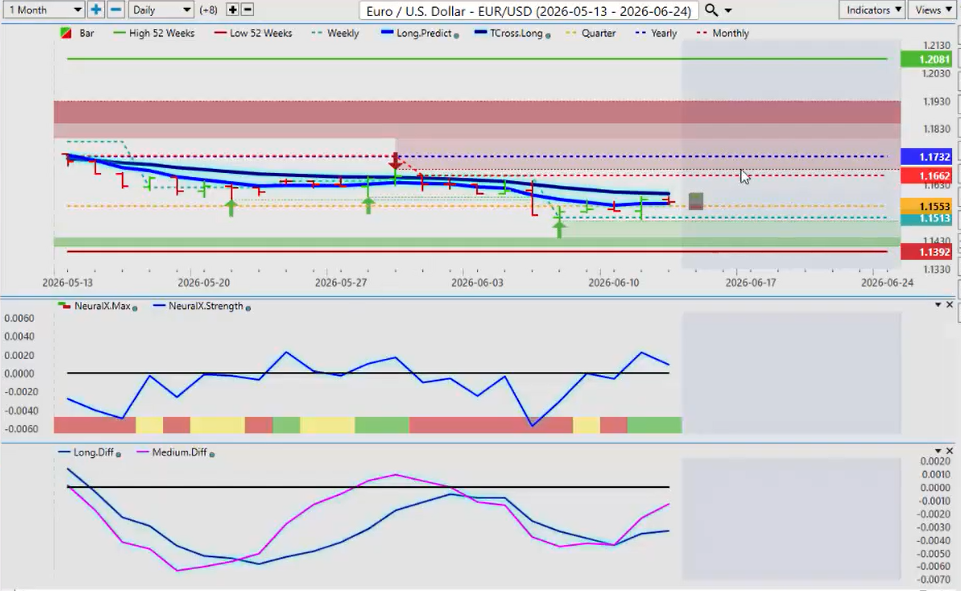
Now when we bring all of this together and we start working in some of our main FX pairs, all eyes will be on the Euro/U.S. Dollar currency next week. Now again, an MA Diff Cross from VP. This could be just corrective in nature because we remain negative on the year below 11732.
So again, that TCross Long 11598. We would have to clear that level, close above it for, in my respectful opinion, only two days in a row to take the pressure off the downside. And that’s possible now that the ECB has hiked, but the market has to digest whether they’re going to hike again and where is the Fed, the U.S. Fed, in all of this.
So we’ll see how this one shakes out. But again, the primary trend is down while below 11732.
British Pound / U.S. Dollar (GBP/USD)
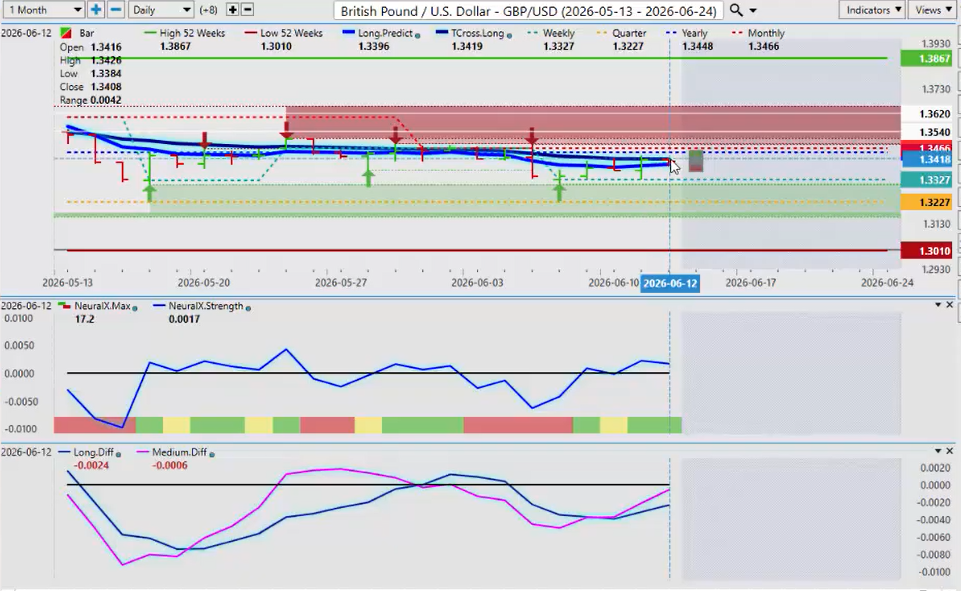
The British Pound is very highly correlated to the Euro/U.S. pair, sitting also right on the TCross Long, but very close to the calendar yearly opening coming in at 13448. So again, for the savvy trader who knows his levels, one could put buy stops above the current monthly opening price of 13466, the yearly opening price at 13448.
So that’s where all of our resistance is. If we can clear it, then we can extend higher. So in my respectful opinion, only a buy stop just above 13470 would be a reasonable play for next week.
Then if we can’t hold above the weekly opening price, then we know that there is going to be more downside. But the VP software is saying there is going to be some upside pressure here.
U.S. Dollar / Swiss Franc (USD/CHF)
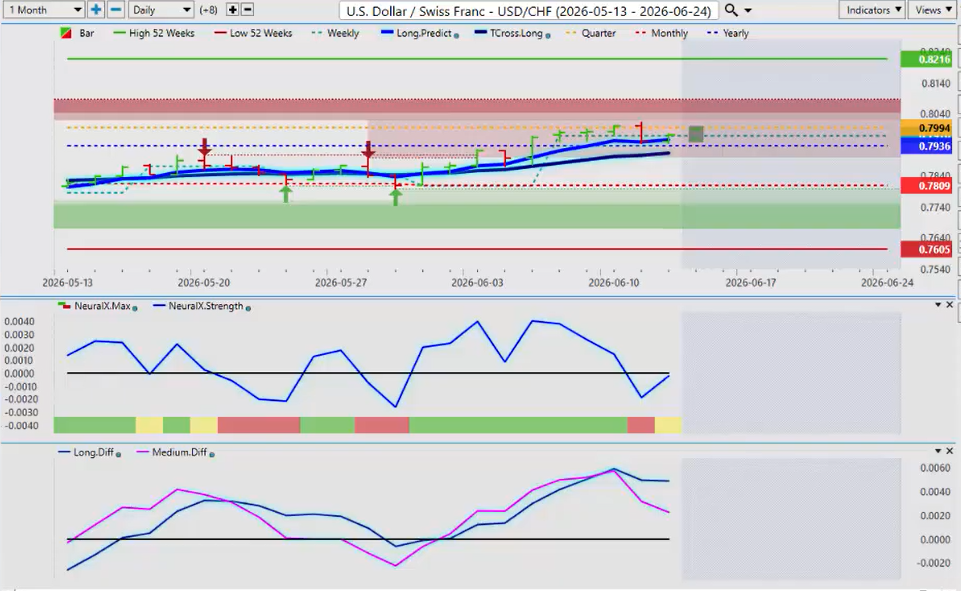
Again, U.S. Dollar/Swiss Franc, a carry trade currency. Once again, we’re barely holding above the yearly opening price. The dollar comes under pressure, this one would go down also.
But shorting the dollar against a cheap funding currency like the yen or the Swiss Franc is not always the best play. It’s a costly play because of the carry trade. You’re going to have to pay interest to the broker. But if you get on the long side of this trade, then the broker has to pay you.
So, just a little side note there. But again, I think the dollar is likely to lose ground also against the Swiss Franc and, of course, the Japanese yen.
Japanese Yen (USD/JPY)
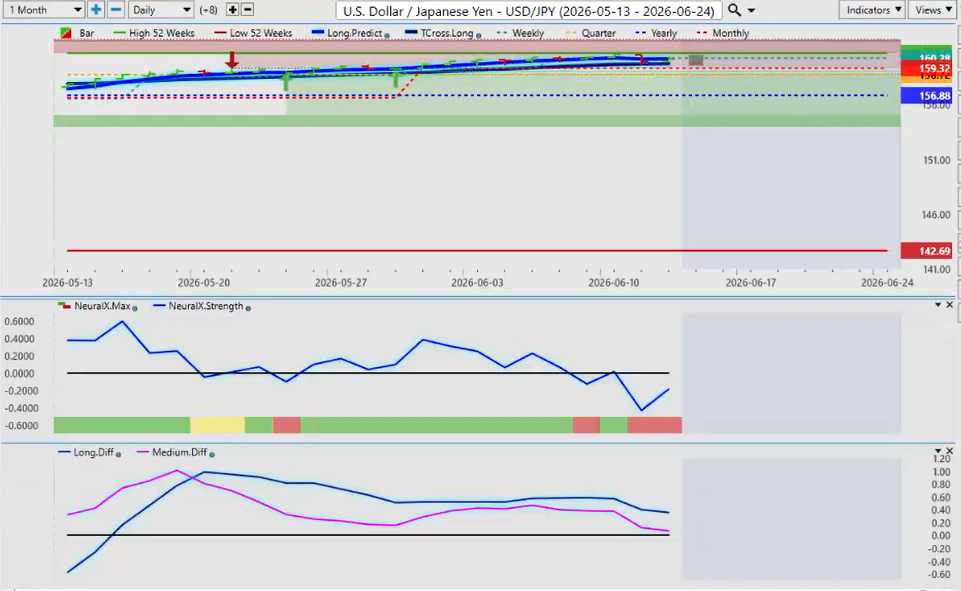
A lot of talk and chatter, guys, of intervention from the Bank of Japan, but they have made such a mess of this that I don’t think the market is listening to them anymore. They’re going to need to hike rates. The Fed is going to need to cut.
That’s the only thing that is going to bail them out of this because the market again wants to stay long to get paid that swap or that dividend every day, times three on Wednesday. So for now it is very toppy up here again, closing out the week once again above 160.
Hard to believe, but again there will always be sellers coming out around a 52-week high, but they’re not going to want to hold that short for very long, in my respectful opinion.
U.S. Dollar / Canadian Dollar (USD/CAD)
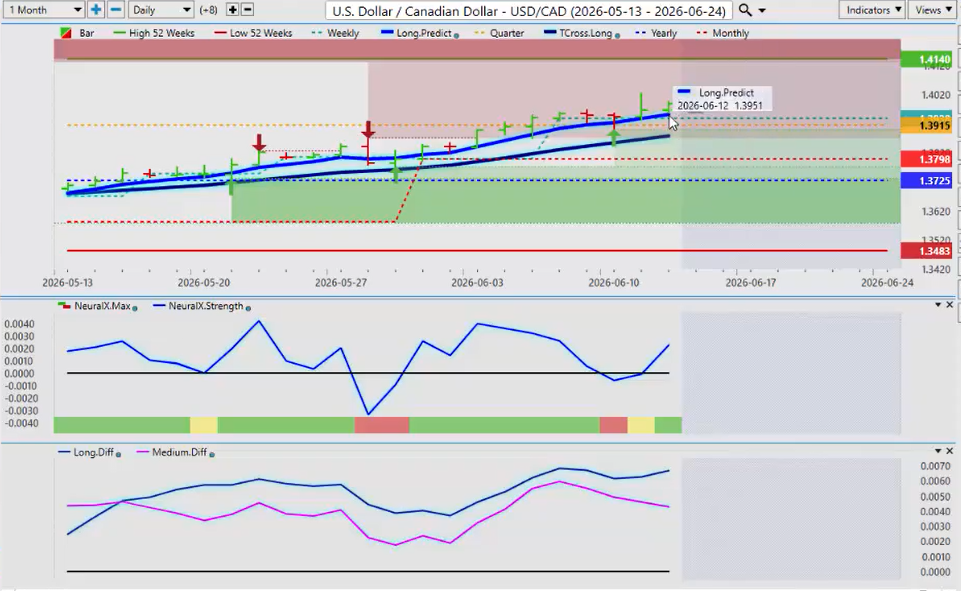
Now the U.S. Dollar/Canadian Dollar pair remains under heavy buying pressure here, with Canada moving into a recession. And it’s not a technical recession, guys. There is no such thing. It’s a recession.
So I know the Bank of Canada is trying to provide lip service for this and say, well, technically. Well, no, guys. It’s not. Either you are or you’re not in a recession. There is no technical aspect to that.
So you’ve got back-to-back negative growth in the quarter and that is showing up in the exchange rate. The market is buying the U.S. dollar against the Canadian dollar. We’ve got problems with the COSMA deal potentially not going through or the U.S. pulling out of it.
So that would not be good for the Canadian dollar. So we’ll monitor it and see what happens. But for now, yes, there is still upside pressure here, potentially back up to our 52-week high at 14140.
The VP indicators, while they indirectly do support an additional move up on this, the Canadian dollar is a very high correlation to equity. So keep an eye on your stock markets. If we get back into a risk-off scenario, the dollar starts losing ground, then even the Canadian dollar might be able to make some gains against the U.S. dollar. But my optimism on that currently is heavily guarded.
Australian Dollar (AUD/USD)
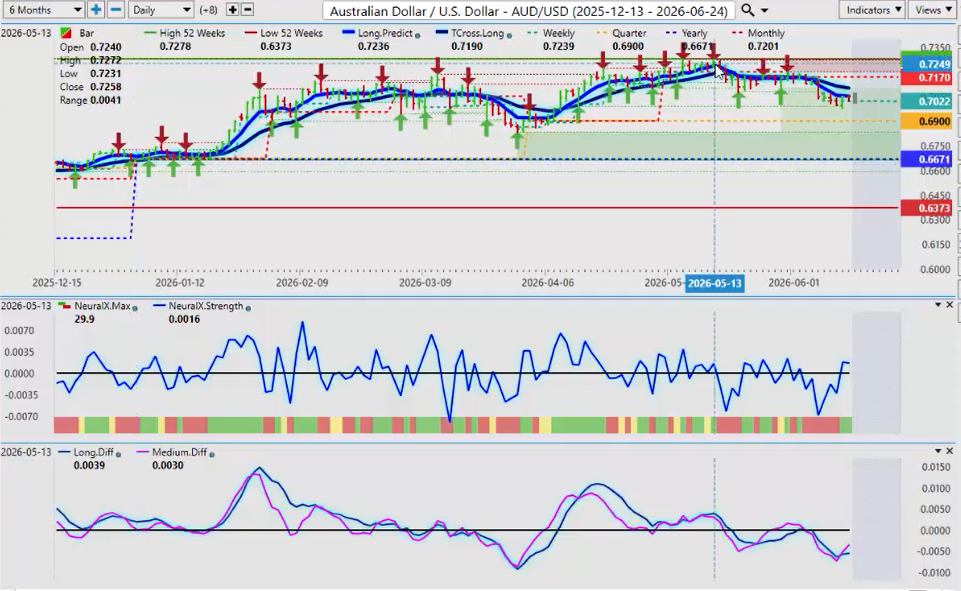
Now, the Australian Dollar and the Kiwi, these are still high-yielding currencies. The Aussie has been one of the top currencies in 2026 when we look at this going back to the beginning of the year. So again, we can’t just randomly say something is in a downtrend or it’s bearish when a chart that looks like this in the calendar year.
The Aussie is doing very well. It’s pulling back. If we see gold rebound, we see the equity markets rebound, the Aussie will naturally move higher with that.
So again, at the very least next week, the VP software with our MA Diff Cross, our Neural Index, the primary trend above the quarterly opening and above the yearly opening price, fully supported here. A retest back up towards the 52-week high 7278 is very likely in the days and weeks ahead.
New Zealand Dollar (NZD/USD)
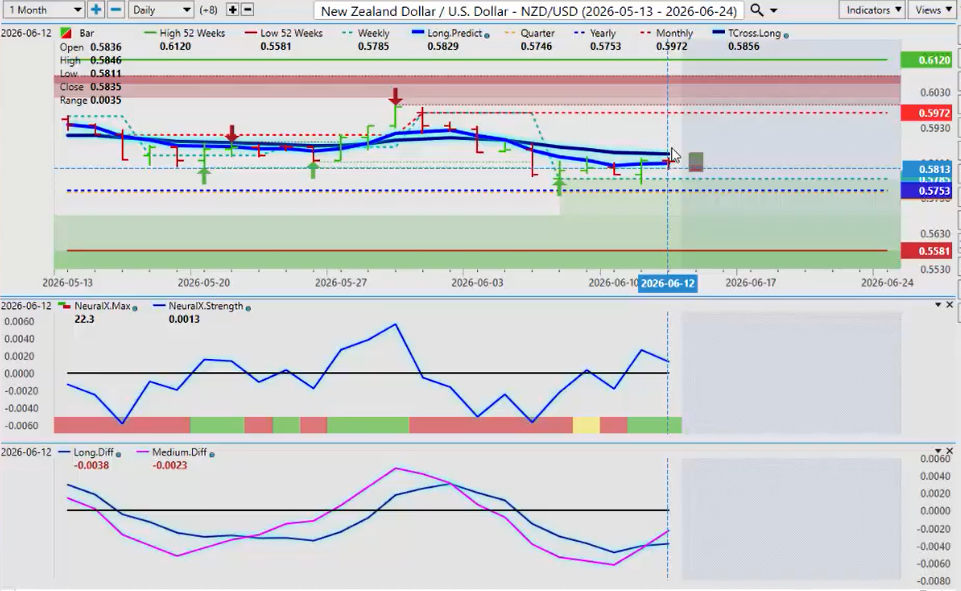
And the same thing would apply to the New Zealand Dollar. The Kiwi, I would argue, is a little bit stronger, maybe a little bit better value. 5753, the current yearly opening price. That’s a critical level, guys.
As long as we’re holding above that, we’ve got a long trade. So again, once again, the MA Diff Cross warning that we are going higher. And yes, the way I would read this, or we would read this using our VP software, is we would say it is corrective in nature and up until we pass the TCross Long at 5856.
So once again, the savvy trader that knows his level, or his or her level, I should say, excuse me, you can put a buy stop above 5856 and when the market pushes through that area, then you will have a long waiting there for it. So again, just another powerful way to use the VantagePoint software.
So with that said, this is the VantagePoint AI Market Outlook for the week of June the 15th, 2026.