


Welcome to the Artificial Intelligence Outlook for Forex trading.
VIDEO TRANSCRIPT
US Dollar
VantagePoint A.I. Market Outlook
Okay, hello everyone. Welcome back. My name is Greg Firman, and this is the VantagePoint A.I. Market Outlook for the week of June 22, 2026.
Now, to get started this week, the first thing I’m going to do is identify what VP indicators we’re using in this particular outlook. I am using the 52-week lookback. I use bars, not candles. Candlestick patterns, in my respectful opinion only, do not predict market movements.
I’m using the long-term difference, the medium-term difference, the Neural Index and the Neural Index Strength, the Point-in-Time Indicator from VP to identify the monthly, yearly, weekly, and quarterly opening, the Triple Cross, but in this presentation I am only using the VantagePoint TCross Long, the main predicted moving average, and of course our Verified Zone.
UUP / USDU (U.S. Dollar Bull Fund)
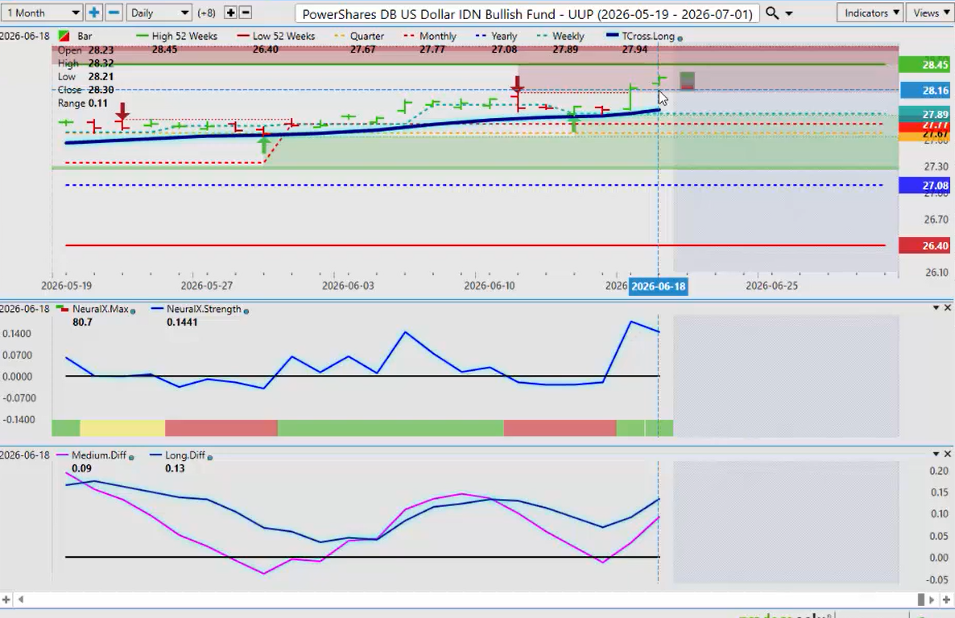
So with that said, let’s get started. What I want to do is point out how to use the medium-term crossover and identify when it can potentially be producing a false signal based on market conditions. So when we look at the dollar bull fund, UUP, we can see right here we had an MA Diff Cross, the pink line over the blue line. What that is doing is measuring the strength of the medium-term trend versus the long-term trend.
This is telling us that the longer-term, or the medium-term trend, is losing momentum. We then have a retracement back to the critical VantagePoint TCross Long. But at this particular time, we also get a medium-term crossover to the downside. Again, the benefit of using the software in this particular fashion will avoid that false signal and say, “No, I need to close below that VantagePoint TCross Long a minimum of two days in a row.”
So when that pink line crosses the zero line, we can assess, by clicking on F7 in the software, that we get a crossover, the blue line crossing over the black line. But again, if we’re not using it with the VantagePoint TCross Long, you have the possibility of creating that false signal. So we always want to make sure we’re looking at this correctly. We don’t want to trade solely off the medium-term crossover because, again, we have to see the positioning.
We see it again here with the U.S. Dollar Bull Fund, the WisdomTree USDU, excuse me. This is a very powerful way of measuring U.S. dollar strength and weakness. So once again, we’re getting very, very different signals here. We have a medium-term crossover that is taking place, but we have a rising Neural Index Strength crossing above the zero line.
Again, we are not crossing below that TCross Long. Now again, simplicity is irrefutable here. Without a whole bunch of things on my chart, moving average crossovers, oscillators, all these different things, we want simplicity. So, in order for me to start aggressively selling the U.S. dollar, I need to close below this TCross Long a minimum of two days in a row for it to confirm that there isn’t a false signal like the medium-term crossover here.
Now again, the medium-term crossover was absolutely correct here, but it was corrective in nature. It wasn’t a new sell signal, or in the alternative, it was a very short-term sell signal. In order to continue trading that crossover, I would need to close and stay below the TCross Long.
UDN (U.S. Dollar Bear Fund)
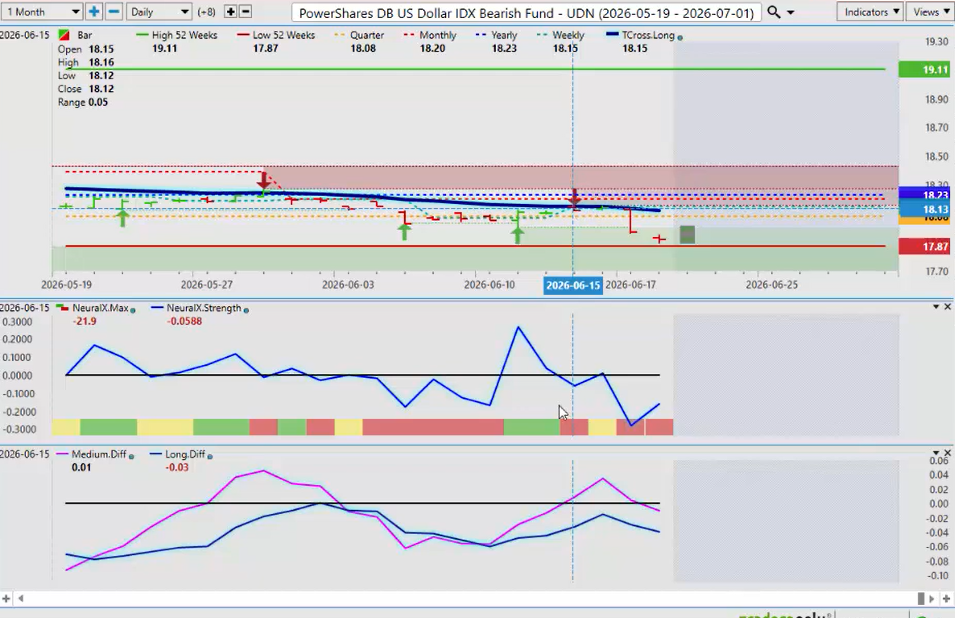
The UDN, the Dollar Bear Fund, we see it inversely here. We have an MA Diff Cross right there warning us that we are going to go higher, but the TCross Long is telling us very clearly the primary trend is down. So again, if I’m coming back up to this TCross Long, then at this particular junction I can assess and say, “Okay, well wait a minute, I’m not closing above this.”
This is corrective. This signal potentially could be wrong. So when we look at that, I can identify the TCross Long with a very specific level, which is 18.15. But again, this is when we click on our F7, that medium-term crossover.
Again, we often see a number of different false signals occurring here. But again, it’s a false signal on a trend reversal. This is not a trend reversal. That’s the big difference here. So once again, we want to make sure we’re looking at this correctly.
Gold
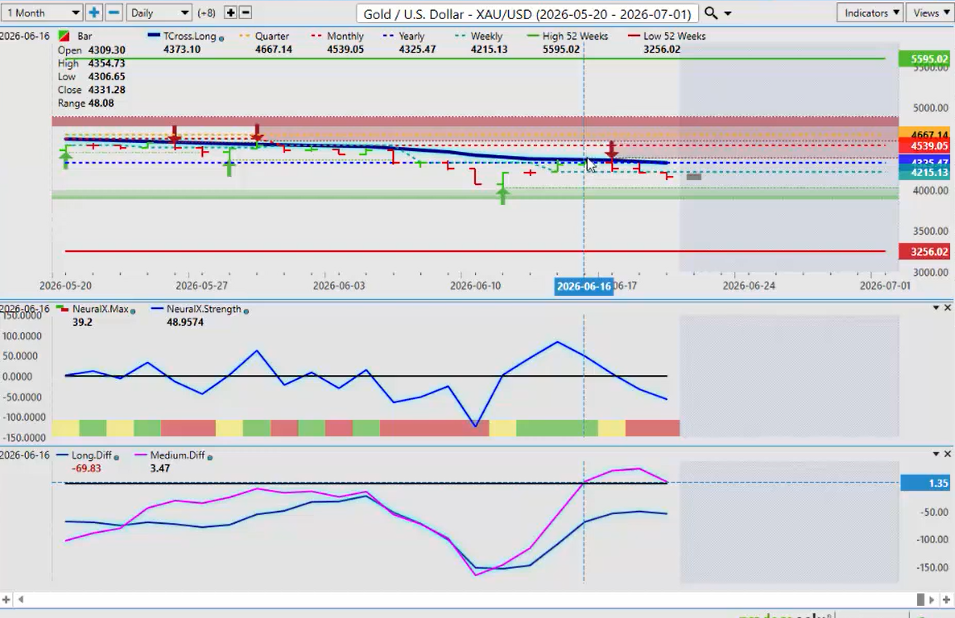
If we look at Gold back here, in the last month we have not been able to clear this TCross Long. We’ve had a corrective move on the MA Diff Cross, but we didn’t clear the TCross Long. Again, simplicity is your best friend. There is one predicted moving average on this screen, and it’s a longer-term predicted moving average, the TCross Long.
So again, I need to stay above this. As much as I want Gold to go higher, VantagePoint is saying that is not going to happen at this current time. So again, we’ve got crossovers to the downside. There’s another crossover with the MA Diff warning me, “Okay, I should stop selling this because I’m probably going to retrace higher.”
A medium-term crossover has occurred right there. As you can see, we could not clear the TCross Long in order for me to buy this. So the corrective move higher is right, but I want to end it there and exit any long trade at this particular point until such time as I can close above this single line in the sand.
Again, simplicity is your best friend in these market conditions. So when I come up to this and I hit that, and a medium-term crossover occurs, we can see that it’s not positioned properly in relationship to the TCross Long. I am not going to take that buy signal. I’m going to wait, and I’m going to exit my corrective long trade.
So again, these are the things we want to look at. And once again, the Neural Index Strength is not in agreement with that medium-term crossover. I want both of them in agreement. If they’re not in agreement, then that’s a red flag.
Equity Markets
When we look at the equity markets, once again, this is properly positioned. We have an MA Diff Cross down here that has occurred. Then we have an actual medium-term crossover, the F7 on your keypad, but it’s correctly positioned here. We’re holding above the TCross Long. We’ve had a retracement. We are now Monday morning at 8:39 a.m. We’re coming into market opening.
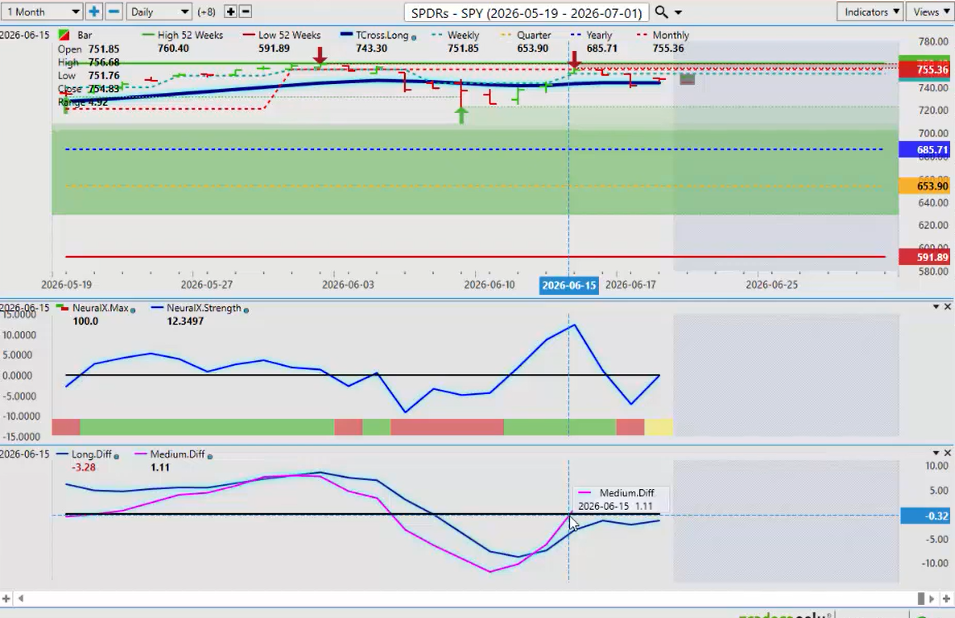
So it’s more likely than not we’re going to have a positive open here today because we’ve had our retracement back to our TCross Long and we should move up from here. We can identify a pinpoint level, 744.06. So right now, for the coming week, what I would like to see is the blue line also crossing the zero line to say, “Okay, I’ve got a medium-term crossover and a long-term crossover and my price is closing above the TCross Long.”
I’m also above the yearly opening. I’m above the quarterly opening. All of these are in check here. Yes, fundamentals could shift it to the downside midweek, but for now we can assess it looks relatively good for the open today.
Russell 2000
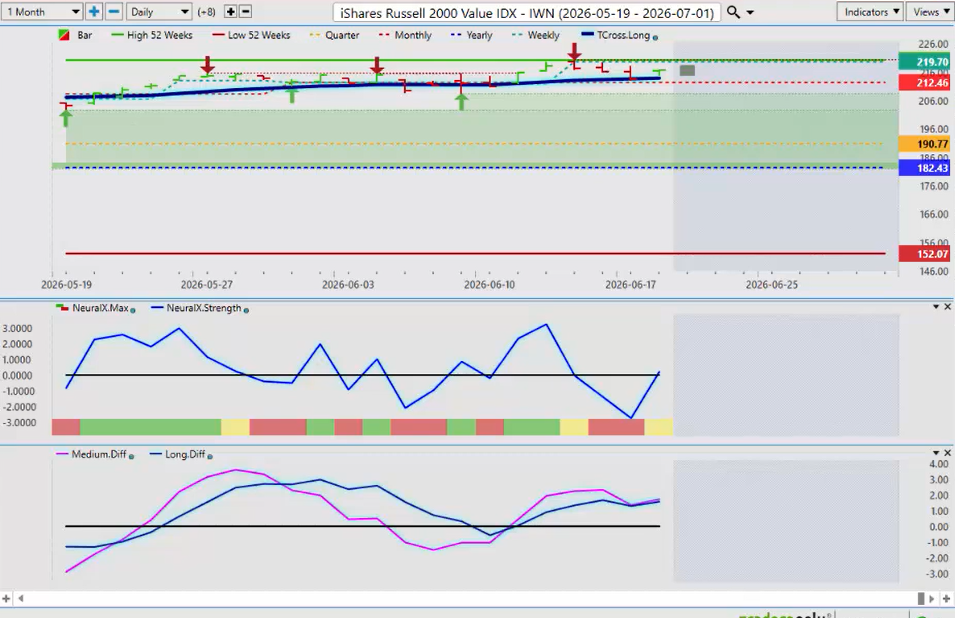
The Russell 2000, same deal here. We’ve got an MA Diff Cross that occurred right back here, which was absolutely correct, warning us that we’ve got a little bit of downward pressure, but we are not consistently closing below that TCross Long. So I am not going to sell based on the medium-term crossover. That would be a mistake until I get a clean break of that TCross Long, which you can see we didn’t. We tried, but it kept closing right on this blue line.
Again, using the Neural Index Strength with this methodology and with the TCross Long is a very powerful setup. It will do two things for you. It’ll tell you when to enter and when not to enter. It will give you a very specific level to enter the market in, right on that TCross Long.
So if I’m unable to close below this, I have a medium-term crossover to the downside, but then ultimately, as the market starts moving higher, the MA Diff Cross occurs right on the zero line. As you can see, that’s perfectly positioned on the TCross Long. I’m sitting above the TCross Long, not below it.
So again, a very powerful, simplistic methodology that consistently produces good trades. And again, without the false signals. This is the main thing I want to point out today.
German DAX
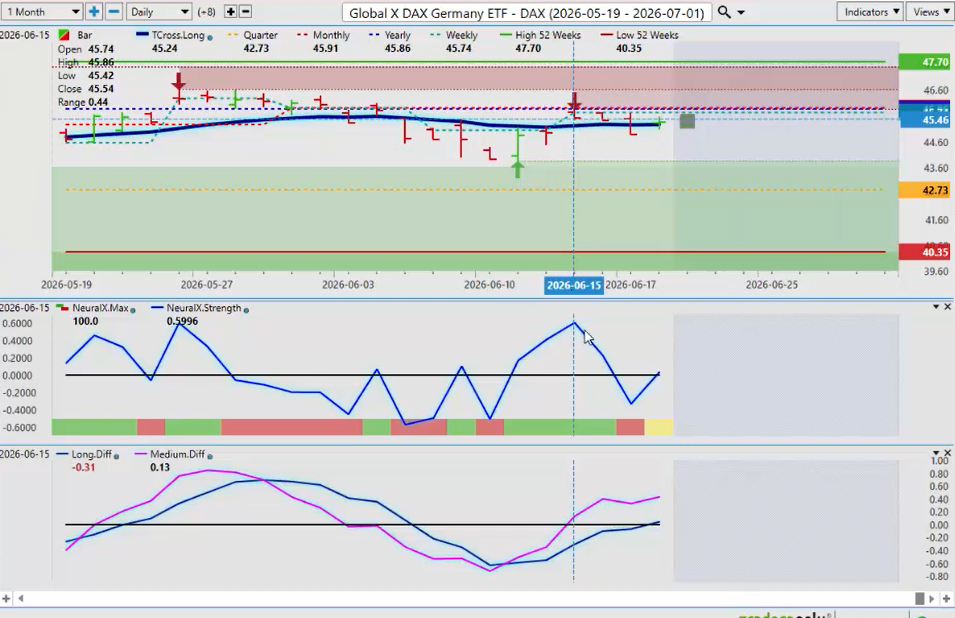
The German DAX. Once again, we’ve got an MA Diff Cross here that’s coming back up, but I’m not going to bite on a long trade until I can close above that TCross Long. You can see it’s very choppy in here. But the MA Diff Cross in this particular case, and the medium-term crossover which is occurring, they’re both positioned properly.
I don’t want to use the medium-term crossover by itself without confirming where the price structure is in relationship to the monthly opening, the quarterly opening, and the yearly opening. In the case of the DAX, you can see the Global X ETF is pausing and hitting that very important calendar yearly opening price. We can’t clear it.
So if I see that Neural Index Strength starting to move lower, that’s a warning sign. Okay, I’m going to correct back to the TCross Long and then I can reassess from here. But right now, looking at the position of this, then it would favor the upside this week for the DAX, providing we can hold above the TCross Long at 45.28.
QQQ
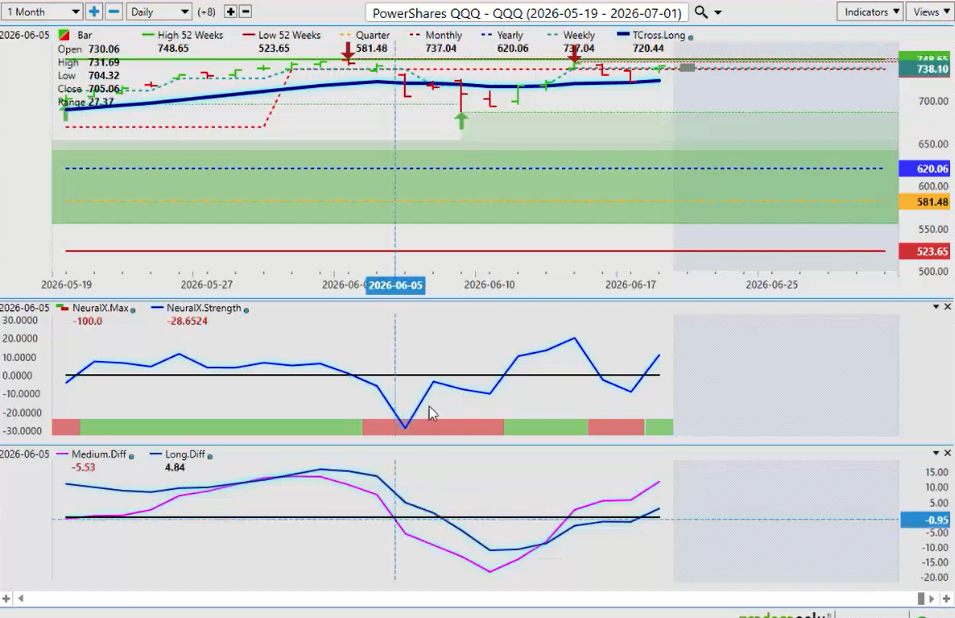
The QQQ, very similar here. You can see that we’ve crossed over a medium-term crossover right here, but the Neural Index Strength is not in agreement with that medium-term crossover at all. We do have a couple of down days here, but we’re just not able to stay down. The primary trend on the QQQ, with the calendar yearly opening price 620.66, is up. We are above the quarterly opening. We’re above our 52-week low.
So again, when the medium-term crossover occurs right here, then you’re getting a better confirmation that there’s more upside potential. We still have a retracement back, but exactly to the TCross Long at 721.26, and then that’s your buying opportunity. In this particular case, the Neural Index prediction from Friday is saying we’re going up, or excuse me, that’s from last week, our last update on Thursday night.
But it’s saying that we are likely going to go higher here today. So again, right now the positioning is we’ve got a medium-term crossover to the upside, a long-term crossover to the upside, and the market is closing above the TCross Long. This is how we put everything together.
If I just click on F7 and showed you a medium-term crossover, it may or may not be correct depending on its positioning against that TCross Long.
VIX Futures
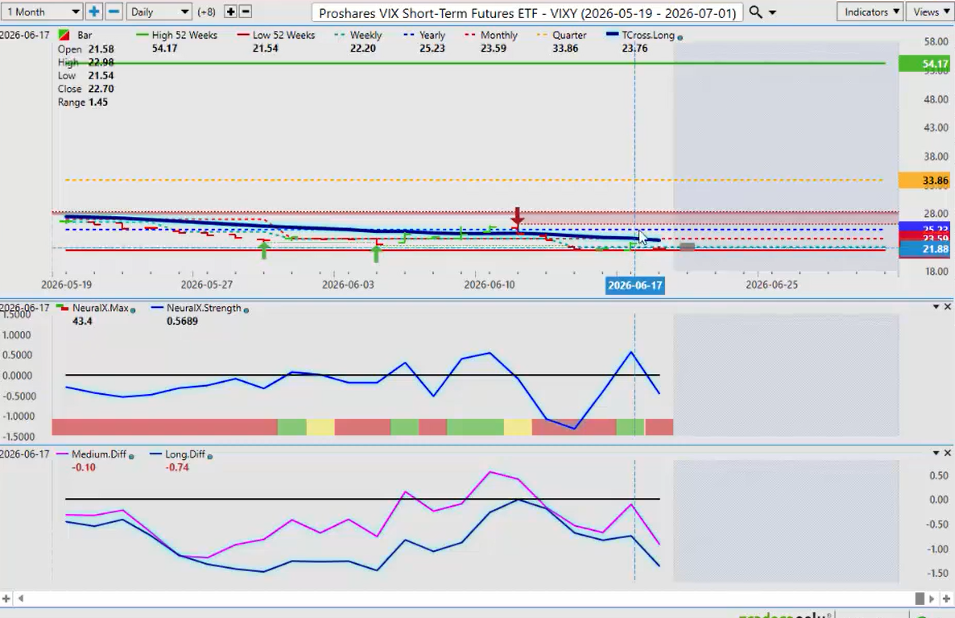
The VIX, again, the short-term VIX Futures. We’re below the yearly opening price. We’re below the TCross Long and again we’re trying to get a medium-term crossover, but it failed on the zero line. But as long as we’re below the yearly opening and the TCross Long, we have a short trade here. This is what most traders miss.
So again, there’s many different methodologies that can be used with VP, but some clarification around the blue line crossing the black line of the medium-term crossover needs to be clarified because, in most cases, in these presentations, I very rarely show it. I show different alternative methodologies to use, much like what we do at the VP Summits, which we’ll be doing again in July. We can show these different methodologies for you to digest and see if this is something that can work for you.
So for now, the VIX Futures, short-term VIX Futures, remain pressured to the downside.
Bitcoin
Now, when we look at Bitcoin, once again we have a medium-term crossover which has occurred back here. The medium-term crossover actually is correct, but it’s not a new signal. It’s a corrective signal against the TCross Long, with that level coming in at 66,155. There is no new trend here to the upside, at least not at that particular junction.
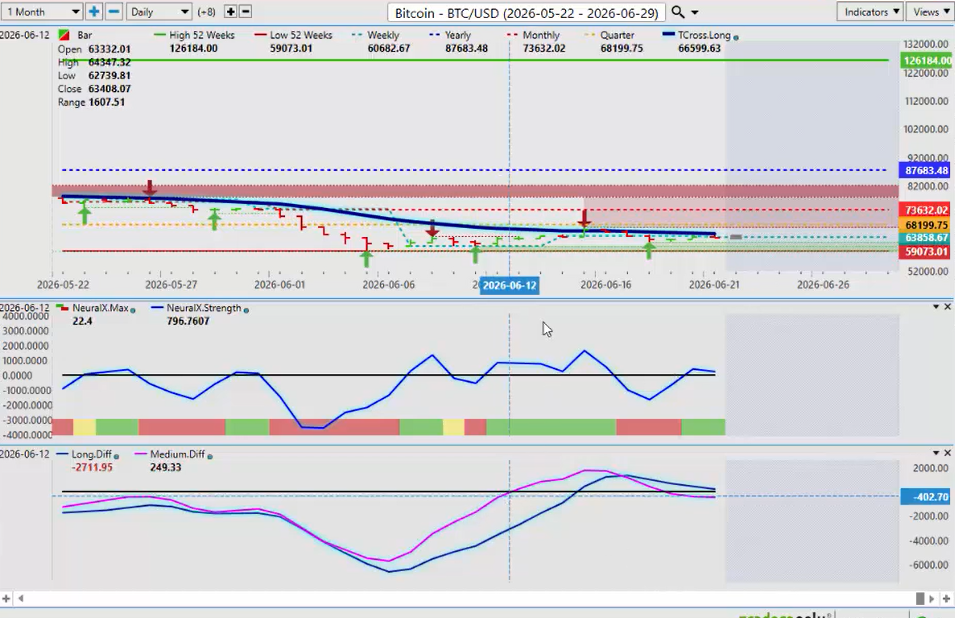
So again, the trader goes long right at that point, not realizing that it’s a corrective signal. It’s not a new signal until we break free and clear on the upside of that TCross Long. Then you can see multiple failures coming in here. Again, we’re just not able to get above this particular area.
When we do, we still have some pretty significant obstacles up here. The TCross Long, the monthly opening, and the yearly opening. Again, we’ve recently set a new 52-week low. That doesn’t mean we can’t go lower, guys. It doesn’t mean that at all. It just means this downtrend is in place.
So again, I believe that Bitcoin will break free and clear of 87,000 closer to August and September because that’s the stronger months. Actually, September and October, excuse me, are the stronger months for Bitcoin, not June, July, and August. But for now, we have a medium-term crossover to the downside, and we’re below the TCross Long.
This would suggest that a short trade this week is reasonable, but I have an exact area of 65,095 to know that that’s the area of interest that I need to stay below if I’m going to short this. Most traders will not short something when it’s this low, even though it is the primary trend.
Crude Oil
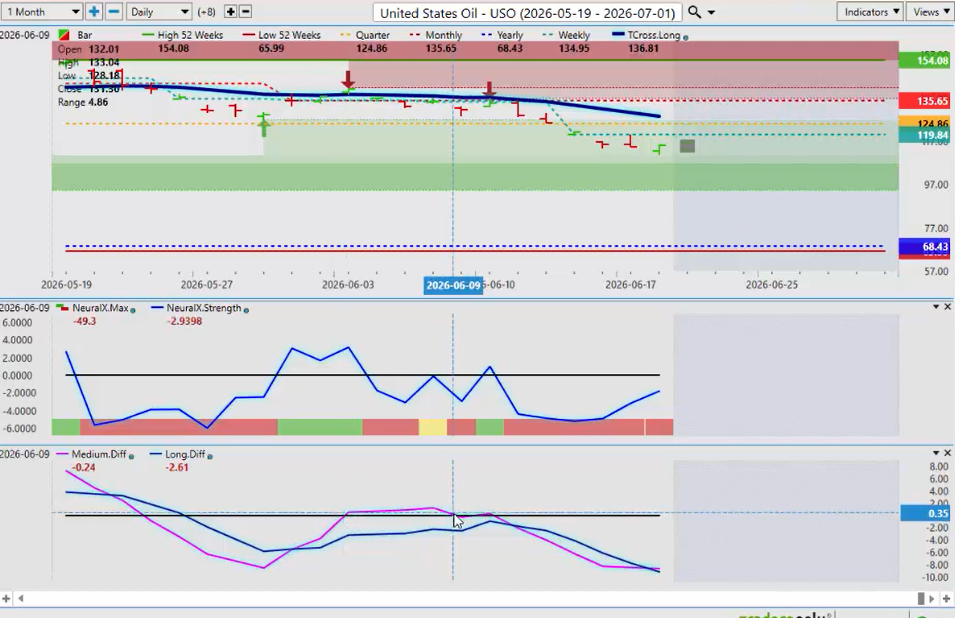
When we look at Crude Oil, we can see all kinds of false signals coming off this medium-term crossover here. We crossed above and closed above the VantagePoint TCross Long, but only for one day. As I had stated at the beginning of this presentation, I want two days minimum for a trend shift. I got it right there.
As you can see, the medium-term crossover stubbornly wants to keep saying buy, but it’s actually not a buy. It’s a sell because we’re below that TCross Long. As you can see, ultimately this gave a very strong warning sign. The TCross Long identifying this critical level told us, “Nope, do not buy up here.”
The only way we’re buying is a two-day close above that and then I’ll consider buying on the third day. Am I creating lag? No. I’m creating confirmation bias that, okay, my conditions are met. But either way, the primary trend on oil is still up.
So for this particular week, our Neural Index is rising. That could mean a retracement back to the TCross Long at 128. You can see down here we’re getting a warning sign of that. The pink line over the blue line. The medium-term strength to the downside is weakening.
It’s warning us that potentially we’re coming back to that level. But we have a very specific level that we can target on the upside and exit longs should it rise up to that. We know we want to exit at that particular level coming in at 128.13.
Euro versus US Dollar ($EUR/USD)
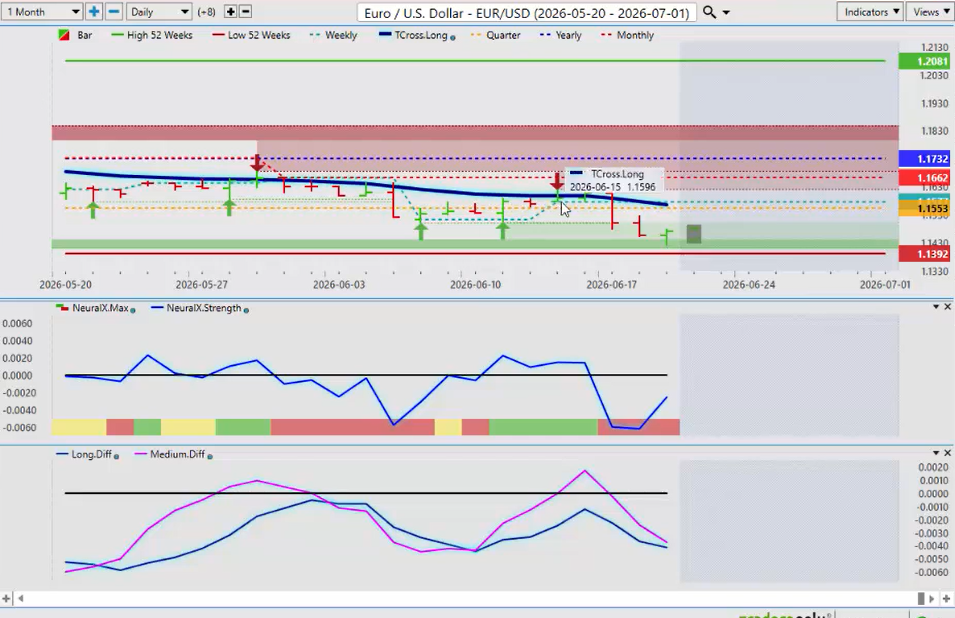
Now a quick review this week of some of our main forex pairs with EUR/USD. Once again, as we can see here, we’re getting a medium-term crossover that occurred right there on June 15th, and the primary trend is down. We’re below the yearly opening. We’re below the monthly opening, and we are still holding below the VantagePoint TCross Long.
We closed above it one day. As you can see, there’s that medium-term crossover again. But this was corrective in nature. A medium-term crossover is only a new trend to the upside when a medium-term crossover occurs while the market is above that particular level and it’s able to hold above that level.
As you can see, we were not able to do that. Then ultimately, we’re pressured back to the downside. So for now, we’re at a 52-week low. We’ve set a new 52-week low, 1.1392. I believe we will get buyers coming in here because this is a week of known U.S. dollar weakness, not U.S. dollar strength.
But again, that would still be corrective in nature. So our corrective point would be 1.1566 because there’s no confusion in this, guys. There aren’t 50 different indicators, crossovers, oscillators, accumulation distributions, none of this stuff on here. It’s simplicity.
You have to have a starting point in any of your trading and investing before you can make that next step. And that’s where the VP Summits come in, where new technology is showcased and it’s very powerful stuff. But for now, right now, that Neural Index is warning that this euro could be getting ready to retrace higher, and we are still getting some hawkish rhetoric out of the ECB.
British Pound versus US Dollar ($GBP/USD)
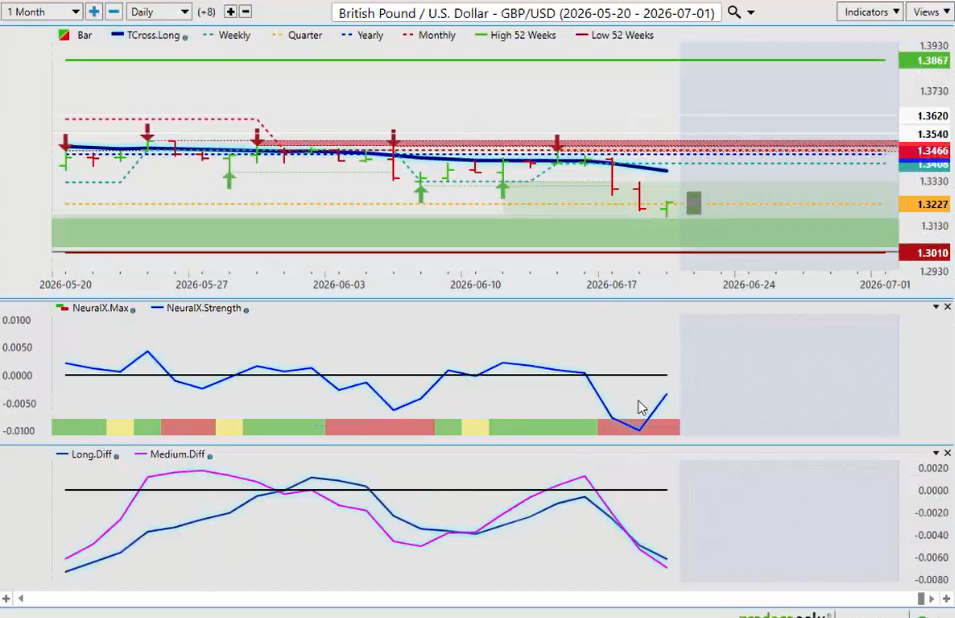
Now again, when we look at the GBP/USD, we see something very similar. We see a crossover occurred there, but then immediately another crossover to the downside. The one to the downside was the correct move, guys, not the one to the upside. That was a false signal because, again, we’re below the yearly opening price. We’re not consistently staying above the TCross Long.
Ultimately, the pound dollar falls. But again, the Neural Index Strength is warning us that, look, we actually may be putting a bottom in here. It’s possible, right? So when we look at our retracement points, it’s back to the TCross Long, 1.3374. That is a potential target for us this week.
US Dollar versus Swiss Franc ($USD/CHF)
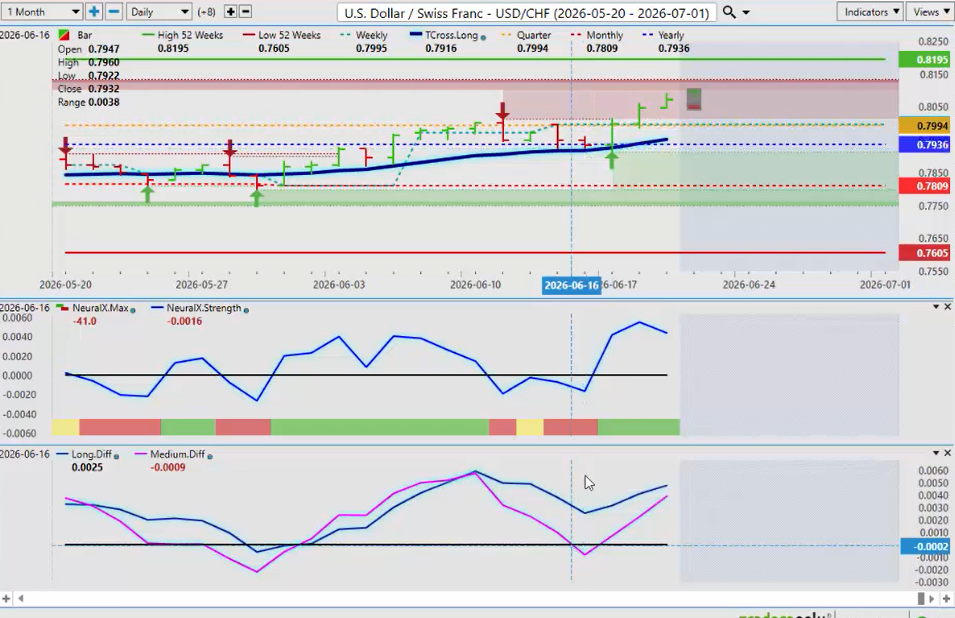
The USD/CHF, again, this one’s very interesting when you can see right there. Once again, we’re coming lower, but the positioning of that medium-term crossover is not in the correct location when it’s pinned against the TCross Long. This is the most simplistic way to use the VP software when you’re getting started because, again, there is nothing to be confused about here.
We are not closing below that TCross Long at 0.7916. I am not going to bite on a short on this. And when it crossed back up to the upside, that one I am more than willing to bite on this. We did this trade last week in the VantagePoint live training room and said, “Okay, that’s the perfect trading setup. You’ve got the yearly opening price and the TCross Long at the exact same location.”
I believe somebody did ask me in the live room and said, “Well, we have a medium-term crossover to the downside.” My view was that’s a false signal, that this is the correct signal right there because I’m utilizing the Neural Index Strength. I’m utilizing the TCross Long, the 52-week lookback. Everything is in place.
Again, we’re starting to move towards that 52-week high of 0.8195. I don’t know if we’ll get there or not, but I have targets in place in case we do.
US Dollar versus Japanese Yen ($USD/JPY)
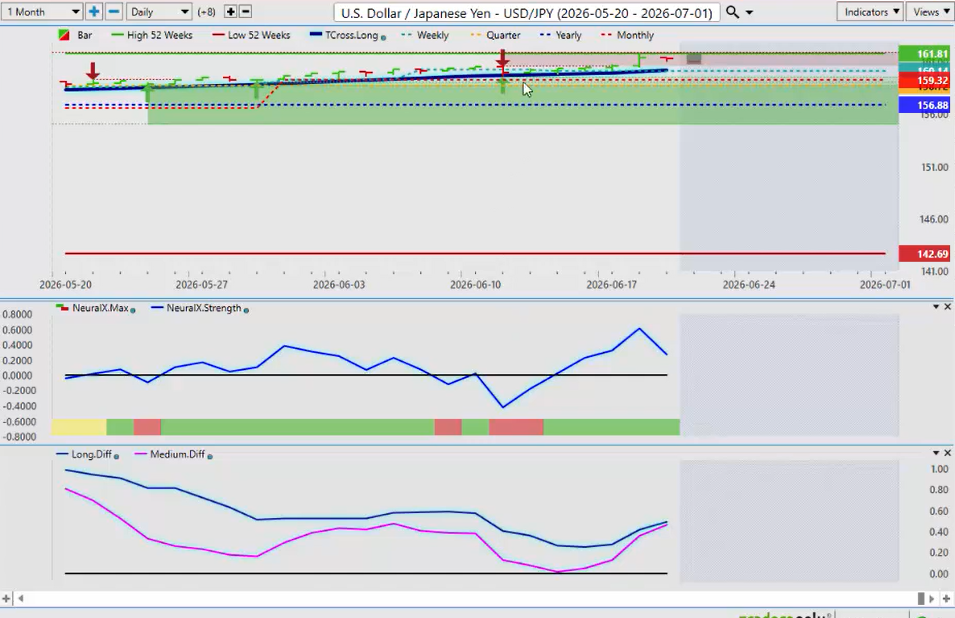
Now with the USD/JPY, very quickly on this one. Again, intervention here, guys, and it did not help the yen. The Bank of Japan has created this mess and they’re going to have to deal with it. The carry trade after Kevin Warsh last week is in full bloom here. There’s nothing they can do to stop it.
I believe that the Bank of Japan will try and intervene again, but I don’t think they can fix this mess that they created. So for now, I’m watching my TCross Long very, very closely. That level is coming in at 160.23.
That is your core level to keep an eye on this coming week.
US Dollar versus Canadian Dollar ($USD/CAD)
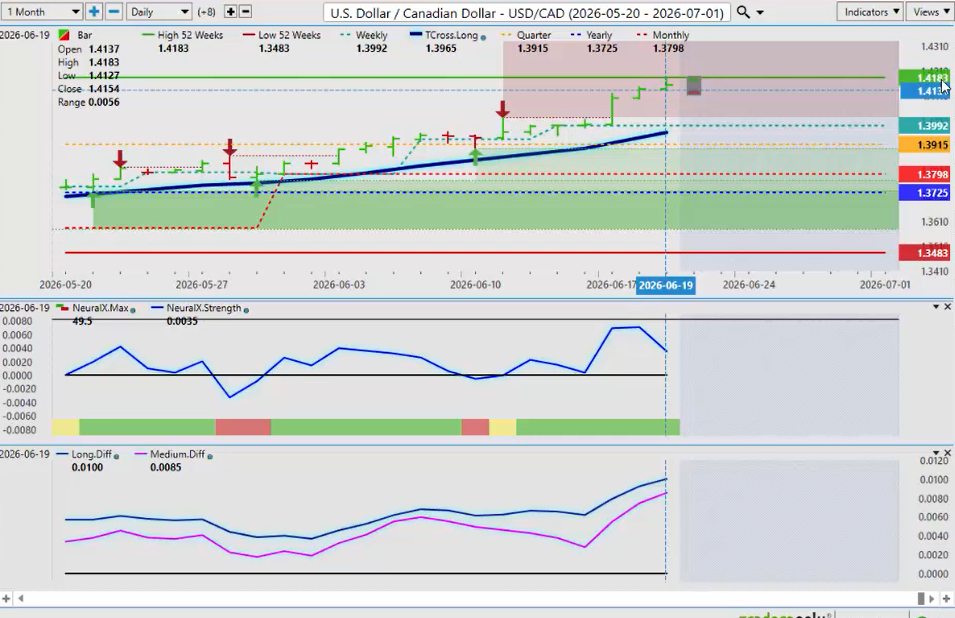
Now with the USD/CAD pair, once again we are up to a 52-week high, 1.4183. The Canadian economy is not doing well at all. Again, you have a lot of political arguments here in Canada on the left and the right side of this, and this is not a left-right issue, guys. The currency is telling you how poorly the Canadian economy is actually doing.
If this exchange rate was down around 1.20 or 1.25, then it would demonstrate the Canadian economy is rolling along pretty good. But at 1.4183, it’s saying, “Look, there’s a problem here.” So again, $100 and $150 oil prices couldn’t strengthen the Canadian dollar.
So I don’t know that a long trade is viable up here, but again, most traders are not comfortable buying this high. But at the current time, I have very little to support shorts other than that 52-week high at 1.4183 and some potential dollar weakness coming.
The further we move away from the TCross Long, 1.3965, the more likely it is we’re going to retrace back to this area. The Neural Index is giving us a warning sign of this. So keep a very close eye on that Neural Index Strength because if it crosses over that zero line, that’s what I’m looking for.
We may have a short-term trade to the downside.
Australian Dollar versus US Dollar ($AUD/USD)
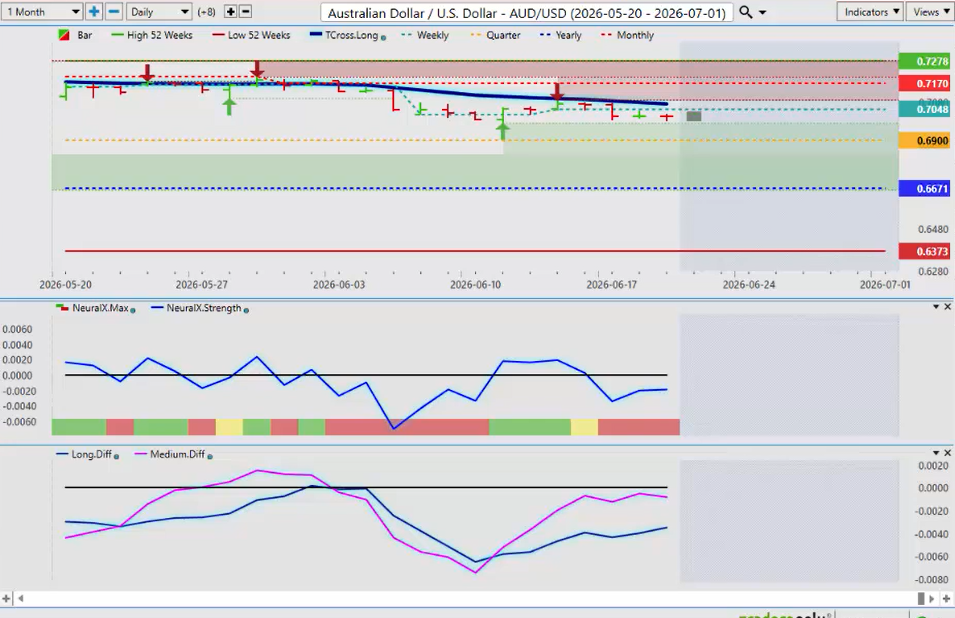
Now the AUD/USD and the Kiwi, these are carry trades, guys. Meaning you may be looking outwardly at AUD/CHF, AUD/JPY. But AUD/USD against the U.S. dollar is not a carry trade, just to be clear. I was asked that question.
Again, the U.S. has higher interest rates. They’re very close between Australia and the U.S. It still favors the U.S., though. So again, when we look at that medium-term strength coming up to the zero line, the VantagePoint TCross Long, this is a very simplistic strategy, guys.
There’s only one. This is objective. A moving average crossover will always be subjective, but it’s also very powerful if it’s used in the correct format. So right now, the MA Diff Cross is a very powerful tool, guys, and it comes right back up and guides us to the point where we would exit and then potentially consider shorts.
But again, I believe the Aussie currency has substantial upside into the year end. It’s going to have some bumps in the road for the next month or two until we get past September. But either way, as long as we’re above 0.6671, longs are favored.
Even though we’re below that very important TCross Long.
New Zealand Dollar versus US Dollar ($NZD/USD) (Kiwi)
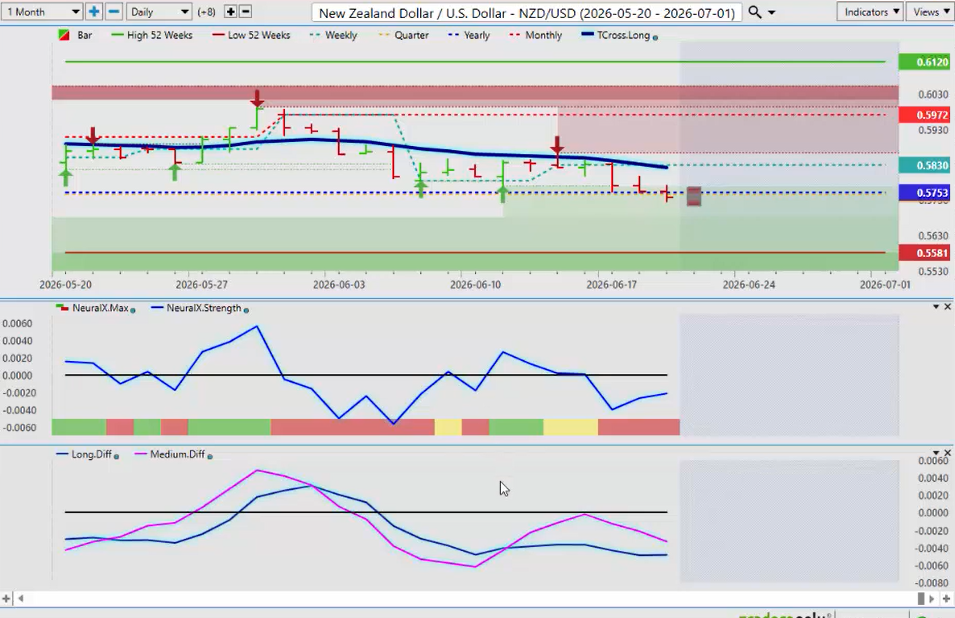
The NZD/USD, the Kiwi, falls into the same boat here, guys. You can see that we came up to try and get a medium-term crossover over the zero line, but luckily in this case it didn’t go over it. So we didn’t have to worry about that.
But the MA Diff Cross here guides us right to that point of the TCross Long. It hits that level. If you’re buying, you exit at that point and then you look to re-enter.
Now again, 0.5753, the calendar yearly opening price. This is potentially a make-or-break week for the Kiwi. So that is the level you want to watch very, very closely with this particular pair.
So once again, this presentation is to help clarify some questions I received, provide alternative strategies to use with the VP software, and better understand how the market reacts to these very powerful tools.
So with that said, this is the VantagePoint A.I. Market Outlook for the week of June 22, 2026.


