


VantagePoint AI Market Outlook for the Week of March 30, 2020
VIDEO TRANSCRIPT
Hello everyone, and welcome back. My name is Greg Firman and this is the VantagePoint AI Market Outlook for the week of March the 30th, 2020.
U.S Dollar Index
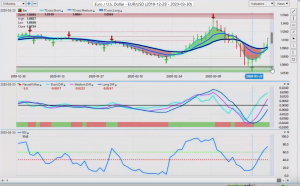
Now to get started we are going to begin where we always do at that very important U.S. dollar index, a driving factor in the financial markets. Now what we can see here, from this past week, is, again, the dollar making a strong rally up on a risk-off environment with the coronavirus and all the other factors, the global easing that’s happening right now. But it was just too much for the VantagePoint software. When we look at this, we’ve got our medium-term crossing our longterm predicted difference, one of the most powerful indicators in the VantagePoint system. We can see that there is virtually no lag whatsoever when we’re measuring the medium-term trend against the longer-term trend.
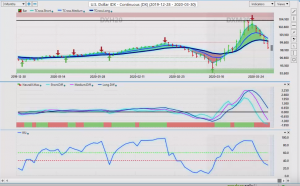
So after we can see we’ve had a very strong move up in the dollar. Once the medium-term crossed the longterm predicted difference and the orders started stacking up, the dollars started moving lower. We then had basically a falling RSI. We were losing momentum in the market and now we’ve come down and closed below that key vantage point level at 99.84. Now if we’re going to continue to move lower on the dollar index, number one we must stay below 99.84 and secondly we would also look to hold below the vantage point predicted moving average. That coming in at 100.25. As long as we can hold below those two particular levels, the dollar will remain under pressure likely against the euro, the pound and some of the other currencies. But we want to make sure we’re looking at this. We can see how the market comes back up almost on a daily basis, kisses that blue line, that predicted moving average with the correlation of 31 other markets and then fails.
The early trigger here is, again, we’re measuring that medium-term crossover against the longer-term crossover. And as that trend weakens on its way up, that’s when we want to look to pull the trigger on these particular shorts.
S&P 500
Now when we look at the S&P 500, the S&P 500 has tried desperately to recover. My concern here is once again, we’re failing into this critical vantage point level around this 2,600 mark. So for next week, what we need to see is the market pushing through that 2,600 mark and staying, closing above that particular level. Now again, when we bring in our predicted moving average, things are looking much better here. We can see that we have what I’ll call a two-day rule, where we broke above that predicted moving average, right there. That led to a very powerful move the next two days.
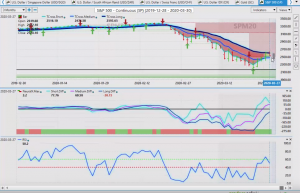
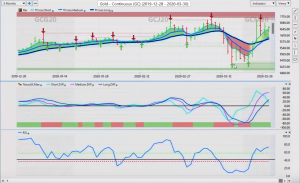
So while everybody else was talking about selling the S&P 500, in the VantagePoint live training room, we were actually looking at potentially buying it. But again, we look for the market to close above that blue line, that predicted moving average. The second day it closes, that gives us a confirmation that we’re likely getting ready for a bigger move and then we break through this verified zone. Now again, in order for this to remain, the pressure to remain to the upside here, we must hold above 24.74 going into next week’s trading. Now with gold next week, gold continues to advance, but once again we’re getting all tangled up in these Vantagepoint verified resistance zones. We’re unable to push through. Now if the dollar can recover this by, I would suspect, the latter part of this coming week. We know the dollar is strong in the first week of the new month, but there’s a lot of interference in the market.
We’ll be watching to see if the dollar can advance because again, this is an outlook, not a recap. We’re not talking about things that have already happened in this particular presentation. This is an outlook for next week’s trading.
Gold
So if gold does push lower, we would still look to buy this on a dip down towards this 15.89 mark. Now again, if we look at that blue line on its own, 16.11 is a strong pivot area. I would anticipate the market will come down and test this by probably Tuesday or Wednesday of next week. We then want to see if we can hold above it. If we cannot hold above 16.11 guys and 15.89 then we move lower. Now at this particular time, if those stocks can turn around, we can see that the orders are stacking up somewhat here on oil contracts and we know that there’s a seasonality around oil.
Crude Oil
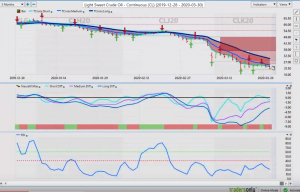
Usually that’s not till May, June, July and then into August with summer driving. So there’s still hope that oil will recover and move higher, but it doesn’t appear to be just yet. Now again, when we look at that blue line on its own, price is starting to push up against this. This is starting to look somewhat bullish. Now in order for us to buy this, we want it to break above 23.82 and hold above 23.82. If we can do that, then we should see oil start… The pressure come off the downside. And we could, in the weeks and months ahead, start returning back to the $35-36 a barrel mark. Now coming into our main Forex payers here. Now again, the leading indicator here, where you would see I’ve drawn a black line across here. The medium term crossing the longterm predicted difference gives us basically a very early warning sign that the euro was about ready to reverse. When the medium term crossed the longterm predicted difference in this green line, which is the vantage point neural index, confirmed that, we can see that the euro started to rise.
Euro/USD (EUR/USD)
Now again, when we come back and look at a quicker entry point into this, when we look at our blue line here, our predicted moving average. Once we closed above this blue line, you can see that the euro started to advance. Now my optimism on an extended in the euro remains heavily guarded at this time. In my respectful opinion, it’s more corrective in nature. But again, we have to measure the events that are coming into the market, these fundamental events. Central banks, the coronavirus, all of these things are affecting trade. We cannot ignore that guys. We must take that into consideration in any type of trading. But for now, the euro remains firm while above 109.58. Now we can see that on Friday we came down, kissed that number to the exact level, at 109.58 and then took a very strong bounce off of their closing, up at that 111.35. A very, very good move.

U.S. Dollar/Swiss Franc (USD/CHF)
And again, these are strategies that we work on every week in the VantagePoint live training room. Now with U.S. Swiss Franc, again, the counterpart to the euro, the inverse correlation. We can see as the Euro started to move higher, the U.S. Swiss Franc immediately turned lower. Now again, we’ve got their orders piling up around this area, but then there were no more long orders. The second the long orders started to dry up, we can see again the usual suspect, the medium-term crossing the long term predicted difference crossing to the downside this time. The neural index in complete support that led to a fairly substantial move lower this past week. Now again the dollar, usually we see demand for U.S. dollars in the first week of the new month. That doesn’t necessarily mean we’re going to get it this month, coming into the month of April. But it’s more likely than not. So right now we would be looking for the same thing that puts us into a trade, would be the same thing that would take us out. The medium-term crossing the longterm back to the upside.
British Pound/U.S. Dollar (GBP/USD)
Now looking at pound dollar next week, pound dollar of very substantial recovery. Once again, we were working on this trade live in the VantagePoint live training room. We talked about this, I explained this in detail this past Wednesday in the room saying,” Look, we’ve got a base-forming down here around the 114 level. But then the medium-term cross the longterm predicted difference, but we’re not pulling the trigger until we have that support of that very important neural index. This is one of the best possible ways you can use the neural index is with the medium-term crossing the longterm predicted difference, either with the trend or against the trend. Guys, that works both ways.” Okay, so right now the pound dollar is still advancing, but again, this is still in a very shaky ground here. As I said in last week’s presentation,” That the Brexit is still a factor with the pound because the UK does not have the support of the European union. They’re standing on their own.”
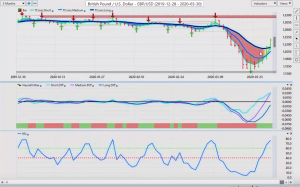
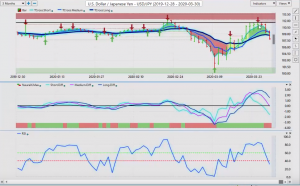
What it does, in my respectful opinion only, is it makes the British pound one of the most volatile currencies in the Forex market at the current time. So that’s just a bit of free advice. Take it with a grain of salt. But it is something you want to remember in your day to day trading. Now as we look at the dollar-yen, the dollar-yen, again, back under pressure with U.S. Swiss Franc, but this is how we do it guys. What we do is we look at these verified zones or you can draw a line on your software and say,” Look, we’ve got a quadruple top up here.” When we look at this from an order flow perspective, there is no long orders going in up at this level. Price starts to weaken, but again, a go to indicator, the medium term crossing the longterm predicted difference, that medium-term trend weakening against the longterm uptrend here. Right? When that goes off, but it was when the neural index was in agreement that this thing started really breaking down.
U.S. Dollar/Japanese Yen (USD/JPY)
Closing the week, again, down in this 107 area, 107.86. But again, this trade setup is extremely powerful. It has nothing to do with accumulation distribution, overbought, oversold, any of these types of older conventional indicators. When we’re measuring two different trends against each other, that’s when we can really see something. When we bring in the neural index going from a long period of being positive to negative, that’s what we’re looking for guys, to really catch some of these bigger moves. When everybody else is going long, we would look to potentially go short or vice versa. So next week with the dollar yen, this is again, can be a leading indicator for the S&P 500. As I was saying at the beginning of the presentation, the S&P is not out of the woods by a long shot here, guys. If we can get back up above 2,600 on the S&P, close above it for several days in a row, that should take the downside pressure off of the dollar yen.
U.S. Dollar/Canadian Dollar (USD/CAD)
Now as we look at our three main commodity currencies, the U.S. CAD, the Aussie and the New Zealand, the U S CAD is regained some of its composure after this vicious beating it took the other week. All the way up into the 147 level. Now, once again, we’ve got two bars to the left, two bars to the right that are lower than that highest point and we can see that essentially the Canadian dollars started to strengthen. So if we draw a line in here too and we say,” Look, we’ve got order flow traders that are refusing to buy basically anywhere near this 145.80 mark.” The medium-term again is giving us a warning sign. But when we look at this closer, we click on our F8 and we bring this in, again, bringing in that single predicted moving average and using it as a pivot area.
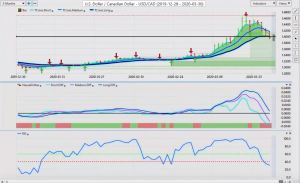
The second we close below that and the neural index stayed red, that was a very powerful trigger to start shorting this thing. We had multiple retracements, daily, back to the blue line, only for it to fail again. Now on a sidebar note here guys, Canada is in big trouble, they’re in lockdown also. You’ve got another 50 basis point cut on Friday, a surprise cut from the bank of Canada. I don’t believe that that will support the Canadian dollar. And always remember the high correlation the Canadian dollar has to oil and oil is still in trouble. Now, if oil breaks the levels that I talked about, you want to add further potential shorts put to this particular pair. Because that would indirectly mean that the stock market is rising also. The Canadian dollar likes it when the stock market’s going up and the Canadian dollar loves it when oil prices are going up, but it doesn’t like it very much at all when they’re not.
Aussie/U.S. Dollar (AUD/USD)
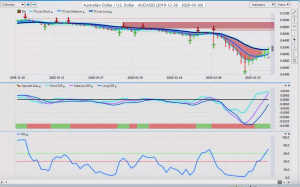
So keep that in mind, again in your day to day trading. When we look at Aussie U.S. And New Zealand U.S., basically here guys, we’re at a make or break position here. We’ve closed on Friday, but remember Friday is usually not a true price. But just the same, we’ve closed above 61.30 in an impressive rally. But when we look at where this rally started guys, again, the medium term crossing the longterm predicted difference on this particular bar, which goes back to March the 19th. We can see that when the neural index turned green a couple of days later, the bulk of the rally that gives us the safety net we need to look at getting long. And again when that neural index turned and the RSI broke above 50 and again broke above the 50 and the 60 level, it accelerated. But we must, we must hold above 61.30. The alternate level that we will look at is bringing in our long predicted on its own and that’s 60.17. Those are the two levels that you really want to watch guys.
New Zealand/U.S. Dollar (NZD/USD)
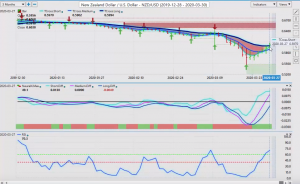
Same as New Zealand. You can see the Aussie and the New Zealand is virtually the same trade. We’ve closed above 59.94 but just barely. We need to stay above this level. If we do, then that means both the Aussie U.S. and the New Zealand U.S. are likely going to move higher next week. But again, my optimism remains heavily guarded because of that known period of dollar strength. However, if the S &P 500 can go up with the dollar index, that will actually help the Aussie and the New Zealand and the CAD. So you can see how we group all three of those currencies, potentially are very much the same trade. So with that said, this is the VantagePoint AI market outlook for the week of March the 30th.


