VantagePoint AI Market Outlook for the Week of May 25, 2020
VIDEO TRANSCRIPT
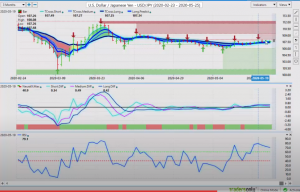
U.S Dollar Index
Hello everyone, and welcome back. My name is Greg [Ferman 00:00:02], and this is the VantagePoint AI Market Outlook for the week of May the 25th, 2020. Now, to get started this week, we’re going to begin where we always do with that very important U.S. Dollar Index. Now, what we can assess looking at the VantagePoint software is the market is moving. This particular market, I should say, is moving sideways between the VantagePoint verified support and verified resistance levels. Now, that support is coming in at approximately the 99 13 area, and the immediate resistance, looking at the verified zone, is at 100.60. The market unable to break through the bottom or through the top. When we look at our current signal going in to start the week, we can assess that the dollar is very slowly starting to turn back up yet again, our neural index turning green, and we have an arising RSI.
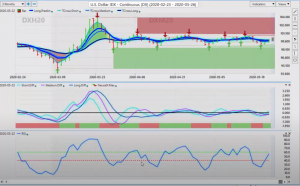
Now, what that rising RSI is telling us is that there is momentum building to the upside. Now, in my respectful opinion, we are likely to see a trending move in the dollar prior to July 1st, but I don’t think there’s enough news out there yet to really drive dollar demand or have dollar demand dry up. So, we’re likely to continue on this. This Critical VantagePoint resistance, however, currently is 99 83. We would look to close above this level and stay above that level. Now, we have closed above that on Friday, but just by the spread. So again, not an overly strong dollar. When we look at our key VantagePoint pivot level, we can see that we’ve closed above our long predicted 99 67, but that’s only one day, and that is on a Friday.
Gold
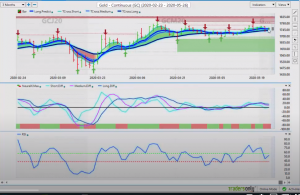
What we will look for is the medium-term crossing the longterm predicted difference back to the upside to give us that buy signal. Now, if that transpires, then gold would be a little bit softer potentially, but again, in most cases, the dollar is not strong until basically the very end of the month or the first week of the new month. So, I anticipate gold is likely to hold around this seventies, 1738 mark. But again, we do have that medium term crossing the longterm predicted difference with the neural index, warning us that dollar strength is pending here and that gold is a little bit soft here. So again, be very cautious with that. I would look at the key pivot area, which is what we normally would do here at 17 38. And again, the additional pivot, which is again, the long predicted, the blue line by itself, where the correlation of 31 other markets is attached to that blue line, that’s the level we want to watch that is now coming in at 17 51. We must get back up above that for goal to continue higher.
S&P 500 Index
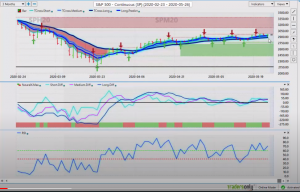
Now, with the S&P 500 this past week, once again, very, very formidable resistance up at this high, at this verified resistance. That’s coming in at or about the 29 80, 29 75 mark and we’re just not able to break through here. Our MA diff is moving sideways, as is the market here. So, basically what that’s telling us is that we don’t have a lot of buyers above 29 50, but we also don’t have a lot of sellers down at this most recent low at 27 77. So, right now we would continue to play the range on the S&P 500 with a slight downward bias. Looking at the neural index, the position of the RSI is actually warning that we could be seeing more strength than the S&P 500, but again, very high correlation to that dollar index.
Crude Oil
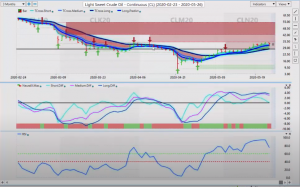
When we look at oil going into next week, oil, once again, unable to penetrate through the VantagePoint verified resistance zones. That’s coming in at or about 34 78. If oil is going to advance, it must break through this particular area. So, right now looking at the indicators from VantagePoint is warning us that oil is likely getting ready to move lower. We can see our predicted differences starting to turn down. Our neural index, after multiple days being green, has gone from green to red, meaning down, and our RSI has peaked and is pointing straight down. So, shorts to begin the week in light sweet crude oil, a very, very reasonable play.
Bitcoin
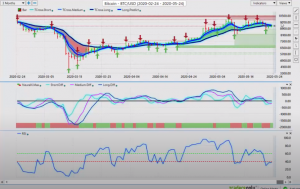
Now, once again, as I’ve discussed in the past that I like to add Bitcoin to the weekly outlook, because I do feel there is an investment here. Regardless of what some of the market pundits are saying, bitcoin has been a fantastic investment in 2019, and even in 2020 it’s, once again, one of the top investments. I believe it’s up approximately 20% on the year. So, very, very nice move up here, but we’re struggling again. I’ll put this 10,000 mark, that seems to be the barrier for Bitcoin. Looking at the indicators right now, it’s warning us this key pivot area, the long-predicted and T cross long stacking up between 93 09 and 92 13. If we can break back up above those two key pivot areas, Bitcoin looks very good yet again for longs, but again, in my respectful opinion, that is probably not going to be until the end of the first week of the new month before we see a bigger move back up in Bitcoin.
Euro versus U.S. Dollar
Now with our main Forex pairs, once again, some very, very good two-way action with the currencies. The Euro having a very good week, as suggested in last week’s Forex weekly outlook, which is, again, this is not a recap of something that’s already happened, this is an actual market outlook for the next trading week. When this video is being produced, the markets are closed. So again, this is not something where we’re just recapping something, we’re actually forecasting. So, in last week’s presentation, I had stated that the Euro is likely to move higher based around the time of the month, and we would see profit-taking on Thursday. The verified resistance zone here in the VantagePoint software 110 17 was clearly too much for the buyers to try and keep pushing the Euro higher. It failed, it’s starting to move lower, but we’ve got some pretty good support down here. The long-predicted is at 109 10, the T cross long 108 81.
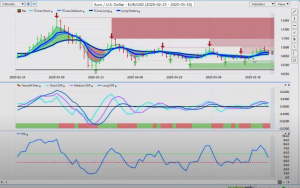
Watch those two particular levels because in most cases, guys, the Euro loses most of its steam in the first week of the new month, and before it does that, there’s usually one big final push to the upside before it actually sells off in the first week of the new month. So, for now, we remain deadlocked in this particular range, 107 75 on the downside and 110 17 on the upside. We continue to play that particular range until we can’t do it anymore. Right now, the neural index is pointing lower, but again, we must break through 108 81 and close below that level to confirm the Euro [pair 00:07:21] is actually going lower.
U.S. Dollar versus Swiss Franc
Now, when we look at US Swiss Franc going into next week’s trade, once again, challenging that VantagePoint level, our T cross long 97 24, we’ve got our long predicted at 97 16. These are critical intraday or daily pivot areas that the market often comes back to. Our signal here is a little mixed, but also pointing to some further U.S Dollar strength. But again, be very cautious on Monday and Tuesday trading, particularly this coming week, because again, we’ve got a U.S. holiday, so Tuesday’s the new Monday guys, so be careful around that. But for now, again, this is a key level, 97 24. We need to close above that level at least two days in a row if we’re even to think about going long with this particular pair.
British Pound versus U.S. Dollar

Now, as we look at the pound dollar, once again, if we’re anticipating one final bout of dollar weakness, then we would anticipate that to start the week, probably on Tuesday, because again, the U.S. markets are out on Monday, a final push to the downside potentially on Tuesday. I think that that would be a very good buying opportunity for the remainder of the week. The low point there, we’re coming in at about 120 74. I would anticipate a slight move below 120 74, and then a complete reversal, probably by Wednesday. So, keep an eye on that. The retracement point 122 70 and 122 12. The primary indicators here from VantagePoint, very, very mixed on this one. The neural index is down, the RSI is down, but our medium term crossing our longterm predicted difference is still warning us that we could see a reversal on this pair. And I would anticipate that, like I said, probably by, I would say around late day Tuesday or early Wednesday trade.
U.S. Dollar versus Japanese Yen
Now, with the dollar yen going into next week, a very, very frustrating pair, to say the least, here. We continue for months to move sideways here, making very, very small gains to the downside, but always moving back up. So, we’re moving back towards this verified resistance. That’s coming in at the 108 08 area. Short, while below this particular area, guys, the indicators from VantagePoint once again incredibly mixed here, but that’s the benefit of having some of the core indicators at your disposal because they don’t all say the same thing and we don’t really want them to, but if we can get the neural index on board with this particular signal, the pink line crossing over the blue line, that would potentially lead to a move back towards that 105 80, 106 area. So, we’ll watch for that, but again, we would have to see the market break through, break free and clear of 108 08 if the upside has any chance whatsoever.
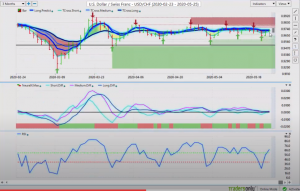
U.S. Dollar versus Canadian Dollar
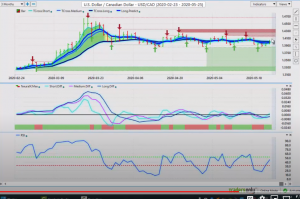
Now, as we look at the U.S. CAD going into next week, also a very mixed signal. Our predicted differences are stacked on top of each other, but we’ve got a rising RSI. So again, by the latter part of the week, I would anticipate the U.S. Canadian pair making further gains to the upside, but to begin the week, U.S. Canada is always a reversal trade from Monday to Tuesday. This week, it’ll be from Tuesday to Wednesday because of the U.S. holiday, so be careful of that pair, but right now we have very strong buyers coming in down around 138 70, but we also have a considerable amount of order flow traders that are shorting this up at the high of 141 40. So, for now, we continue to play that range, utilizing the VantagePoint-predicted high and low of the day, and making sure we’re taking profit until this particular range breaks.
Australian Dollar versus U.S. Dollar
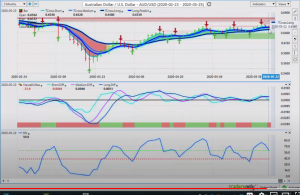
The same thing would apply with U.S. Aussie’s made some gains here. Now, the key inner market correlation, guys, that you want to know and know very well is that the Aussie US. and the New Zealand U.S. are both following the S&P 500. So, the S &P down, Aussie down, New Zealand down, CAD down, for that matter. So, keep a close eye on the S&P this week. If the S&P cannot hold those levels, then the Aussie U.S. is not going to hold these levels either. A breakdown below 65 39 and 64 80 will trigger probably panic selling to some degree, but we are going sideways here for the last month or so. So, we’ll continue to monitor this with a slight bias to the downside going forward.
New Zealand Dollar versus U.S. Dollar
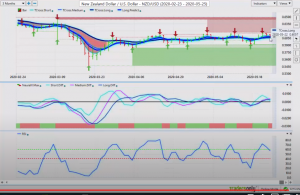
The same would apply to New Zealand U.S. You can see that we failed exactly on the VantagePoint verified resistance zone, that coming in at 61 57, but we do have strong key pivot support, 60 82, excuse me, and 60 57. These are the two critical support levels. If we lose those levels, that means the stock market’s moving lower, and this pair is likely going to follow. So with that said, this is the VantagePoint AI Market Outlook for the week of May the 25th, 2020.