


VantagePoint AI Market Outlook for the Week of May 4, 2020
VIDEO TRANSCRIPT
Hello everyone and welcome back. My name is Greg Firman and this is the VantagePoint AI Market Outlook for the week of May 4th 2020.
U.S Dollar Index
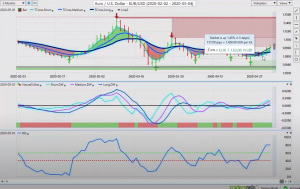
Now to get started this week, we’re going to begin where we always do with that very important US dollar index. Now in last week’s weekly outlook, I had talked more specifically about cycles in the US dollar, that the dollar is usually weak going into just towards the end of the month, but then in the first week of the new month, the dollar is often very strong until after the nonfarm payroll number, which of course is this coming Friday. So looking back at that, we can see that the dollar mysteriously started to lose ground after Monday’s trading and we dropped 1.5%. now on a single contract basis, that would be about $1,535. Just shorting the dollar at the beginning of the week based on last week’s weekly outlook.
U.S. Dollar Index
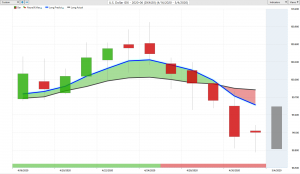
Now our current position on the dollar is that, again in the first week of the new month, prior to the payroll number, the dollar is usually strong. We’re on a very strong also in a strong verified support level coming in down around that low, around 98.51. What I would anticipate will happen here is the dollar will be further weak on Monday to start trading, but on Tuesday by around mid day mysteriously again, the dollar will start to turn around off of these two major support levels. Now we can also assess that this move lower last week was triggered by the medium term crossing the longterm predicted difference in conjunction with the neural index. When these two indicators go off side by side, they are very seldomly wrong. If we click on our F8, one of my favorite strategies too, is using the blue line by itself. We can see that we closed below the blue line on the 27th, and that triggered basically four days of the dollar index moving lower. And you can see we continued on a daily basis to use that key intraday pivot. So to start the week, that same pivot is back in play here at 99.57. We’ll look for the market to move back up above 99.57, and if we close above that level, guys, that’s the trigger to start with your long trades.
Gold
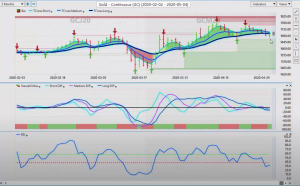
Now gold, not surprisingly, is coming under a little bit of pressure also with the dollar. I would anticipate that gold too would be a little soft next week, but towards the end of the week we could see gold turning around because obviously guys, we’re going to have a very, very bad payroll number on Friday. But with the global economy shutdown, that shouldn’t come as a big shock. Now what I will say is that in this particular case, we have the medium term crossing the longterm predicted difference. The neural index is turning green and we do have a fairly significant level of former support, now turned resistance, at 1705. So keep an eye on 1705 very closely. You’ll also make sure that you want to watch this key pivot level at 1725. My optimism gold strengthening this week remains heavily guarded because I’m anticipating US dollar strength.
Comex Gold
S&P 500
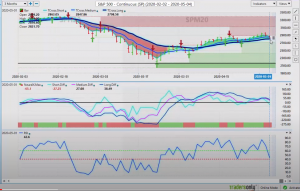
Now with the equity markets, they’ve had a very good recovery now globally. It looks like a lot of the countries are going to start reopening, I’m hoping maybe Canada even too, because we do need to get things moving here. So right now it’s possible the S&P 500 could continue to fuel off the global economies starting to turn back up, so we’ll see. But right now to begin the week, 27.98. That’s the key level. Over the last several years, at least in my respectful opinion, what I’ve noticed with the vantage point indicators is that there’s been a high positive correlation between the S&P 500 and the dollar index, not the euro. So if the dollar turns around, that could put a second leg up on the equity market, so we’ll watch that level very closely. I would also strongly advise to keep an eye on that blue line by itself. As you can see, we’re closing below that on Friday, so what we would look for is a further sell off on Monday on the US dollar and on the S&P 500 only to see them both turnaround potentially by midday on Tuesday.
S&P 500 Index
Crude Oil
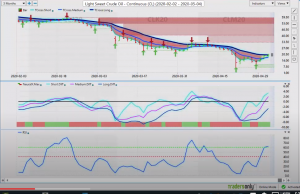
Now, oil, some of the market pundits are saying that there’s officially a bottom in oil now. I am absolutely not in that camp. When I look at this right now, you can see here that, again, we cannot get over this $20 a barrel. This previous week I can’t believe that I saw the June contracts at $6 a barrel. That’s unbelievable. But remember, guys, nobody wants to take delivery on the future side. There’s nowhere to store this stuff. There’s just so much of it. Now, if the global economy starts moving and they start loosening the restrictions, that could help oil. But again, my optimism on longs on oil remains heavily, heavily guarded.
Crude Oil
Euro/USD (EUR/USD)
Now as we move into some of our Forex pairs, I’ll do just a quick little review on some of the pairs here based around last week’s suggestion that the dollar would weaken. Now again, I’m suggesting that this coming week, the dollar regains that composure. If we look at last week’s trading, discussing what we talked about, because again, this is not a recap, this is an outlook. It’s forward moving. So we can see from last week, the entire week, the euro has moved to 157 pips on a single contract, $1,426. But as you can also see now, we’re up against a very strong resistance area. When we look at the high point here and we’re not closing above that, the high 110.17, I would strongly advise to be very, very cautious with longs on this pair next week because statistically speaking, again, the dollar is usually strong in this coming week. There’s real money demand, which usually dries up after, not before, the nonfarm payrolls. So we want to remember that guys, right? And keep an eye on this, but for now the indicators are still positive, but I suspect we will see a failure between the current level and the highest 111.46.
Euro/US Dollar
U.S. Dollar/Swiss Franc (USD/CHF)
Now, the same thing would apply to the US Swiss Franc. When we look at the US Swiss Franc going into next week. But first of all, a very quick review when we talked about places of value, again to sell US dollars last week, US Swiss Franc, 152 pips, $1,578 on a single contract basis. But again, we’re coming into a strong support level this week. We would look for actual longs here between the low point here, which is 95.93 and this additional support at 94.98. That would be the buy zone for us guys. But first, I’m not even convinced at this particular stage that we’re going to see a move much below the 95.80 mark. So keep an eye out for longs. Right now, the predicted RSI has paused and you’ve seen a little reverse check mark here, it’s starting to turn back up again a little bit, so I’m somewhat optimistic. But I don’t think we should look for longs until we have that neural index going from green to red.
U.S. Dollar/ Swiss Franc
British Pound/U.S. Dollar (GBP/USD)
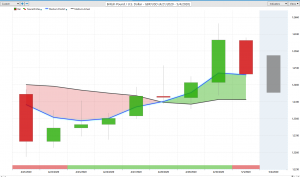
Now the pound dollar, same thing here, and we’ll bore you guys with it, but I think it is worth a discussion because this is something we talked about before it actually happened in last week’s weekly outlook. So when I look at this, at the Monday we come down and then the rest of the week we basically just go hire 196 pips, excuse me, $1,572 on just that single contract. Very nice trade. Five contracts is a little crazy for my liking, but still if you’re so inclined, that’s $7,860. That’s a nice paycheck here, guys, for one week.
Now, the problem going into, again, next week is this price. Are they just trying to get us going the wrong way? We’ve got resistance up here above 1.26. So this in my respectful opinion only, before we get too excited and comfortable with longs, then we need to break free and clear of this particular high point rate here. That level coming in at 126.41, if we can’t break, here’s what could happen guys and often does, they go 40 or 50 pips above 126.40 so maybe even to 1.27 on Monday, then on Tuesday there’s a violent reversal. So be very cautious because this is a classic location of where we see bull traps in this particular case. And a bull trap of course means that basically they get you to go long up here and then they pull the rug right out from underneath you a couple hours or a day later, so be cautious here. Okay? The neural index has gone from a long period of green down to red, that very well could be the one we’re looking for. Just a word of caution, free advice, be careful around buying this particular pair between 126.40 and 1.27.
British Pound/ US Dollar
U.S. Dollar/Japanese Yen (USD/JPY)
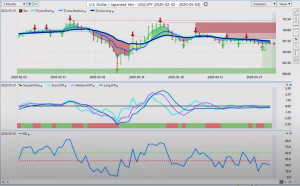
Now, as we look at the dollar yen, once again, the dollar yen has made the additional leg down with the S&P, but it’s a very, very small leg down. It’s not a breakout. We’ve got down to the 106.30 106.20 area, but it’s stalling again here, guys. So think of it this way, if the basis of Forex is buying and selling US dollars and if we’re going into a known period of dollar strength, then I would suggest that dollar yen may make a violent move down on Monday, only to reverse on Tuesday or Wednesday. Now, when I look at these indicators from vantage point, we’re still unable to break above this high point at one 108.04, excuse me. So if we were so inclined to buy this, then it would be somewhere between 105.90 and 106.36 area, playing that reversal for Tuesday. But the deciding factor is still going to be the S&P 500 and the global equity markets. If it looks like the doom and gloom in the economy has been sidelined, then maybe this pair can turn around and rechallenge the 108 area. Right now, the indicators, some vantage point, the neural index are suggesting that that’s very possible.
Now again, if we put the blue line in there by itself, it gives us a much tighter entry 107.15. If we can close above 107.15 by Monday or early Tuesday, then there could be a long trade here. So keep your eyes open for that one.

US Dollar/ Japanese Yen
U.S. Dollar/Canadian Dollar (USD/CAD)
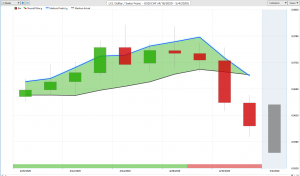
Now with the dollar strength, you can see that US Canada has done a full retracement back to the 138.50. I’ve been a strong advocate for longs on this just because of the state of the Canadian economy is a mess, the oil prices, it’s just none of it works well for the Canadian dollar. And Canada has been shut down for at least a month. It’s slowly starting to reopen, but oil prices are down. Canada has taken on a huge amount of debt, paying people to stay at home so it’s not good for the currency.
Now if we’re looking for places of value, again to buy US dollars, then longs on this pair would be more than reasonable here, guys. That key level coming in at 140.35, if we click on our F8, we can get our blue line by itself. That’s coming in at 140.18. So basically we know exactly where the area it is that we want to buy from on Friday … Or, excuse me, on Monday. So what we would do is let the brokers have some fun on Monday. I bet you any money they try and push this thing as low as they can, probably to sub 140 level, 139.50. Use that for longs. We can see that our neural index has gone from red to green, our RSI is firmly rising up, everything here points to a solid long trade. So watch those levels around 140.18, 140.30 and then look for that trade on potentially, I would be more inclined on Tuesday, closer than to Monday.
U.S. Dollar / Japanese Yen
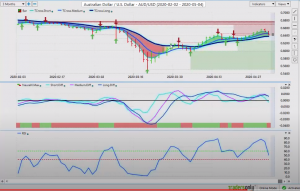
Aussie/U.S. Dollar (AUD/USD)
Now with our final two pair pairs, the Aussie US New Zealand US, almost the identical trade here, guys, very, very similar. And once again, believe it or not, a place of value to buy US dollars could very well be the Aussie and the New Zealand yet again. They’ve had a good rally up here for the last 30 days, they’ve had some fun, but it looks like the cat’s on its way. But when the cat’s away, the mice play, but I think the cat’s on his way back here. We can identify we’ve got some type of failure coming in right up here, and that level is very identifiable here, right guys? So we look at that high at 65.57. When we bring this down, our support level, or major support, is 63.75. When we click on our F8, you can see that we’ve broken down below that key predicted moving average, the correlation of 31 other markets. That’s now a trigger point for us, 64.61.
Now, if the equities turnaround that may boost a risk on environment would definitely help the Aussie, but I think the dollar demand at the beginning of the month will outweigh that and still force this pair lower. So to begin the week, keep a very close eye on 64.61 for possible shorts.
Australian Dollar/U.S. Dollar
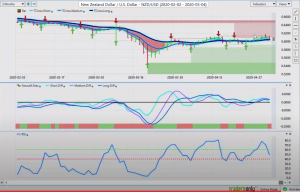
New Zealand/U.S. Dollar (NZD/USD)
The exact same thing would apply for New Zealand here, guys. Virtually the same currency between the two. You can see 60.39 are T-Cross long, a major support level. When we click on our F8 by itself, it too is breaking down. It’s been a hugging the Vantagepoint blue line, the predicted moving average, and now it’s breaking down below that. One could maybe even argue that right off the open 60.68 or maybe towards the vantage point high would be a reasonable short trade.
New Zealand Dollar/ U.S. Dollar
The predicted high for Monday is 60.92, so that’s the level we would watch. With 60.92 we can also assess that we have a good verified resistance at 60.91, so this could be a very good short. But again, I would hold off to Tuesday, let Monday … Monday’s a fake price. And then have a game plan guys and be prepared to act. So with that said, this is the Vantage Point AI Market Outlook for the week of May 4, 2020.


