Welcome to the Artificial Intelligence Outlook for Forex trading.
VIDEO TRANSCRIPT
Okay, hello everyone and welcome back. My name is Greg Firman and this is the VantagePoint AI Market Outlook for the week of May 6, 2024.
US Dollar Index
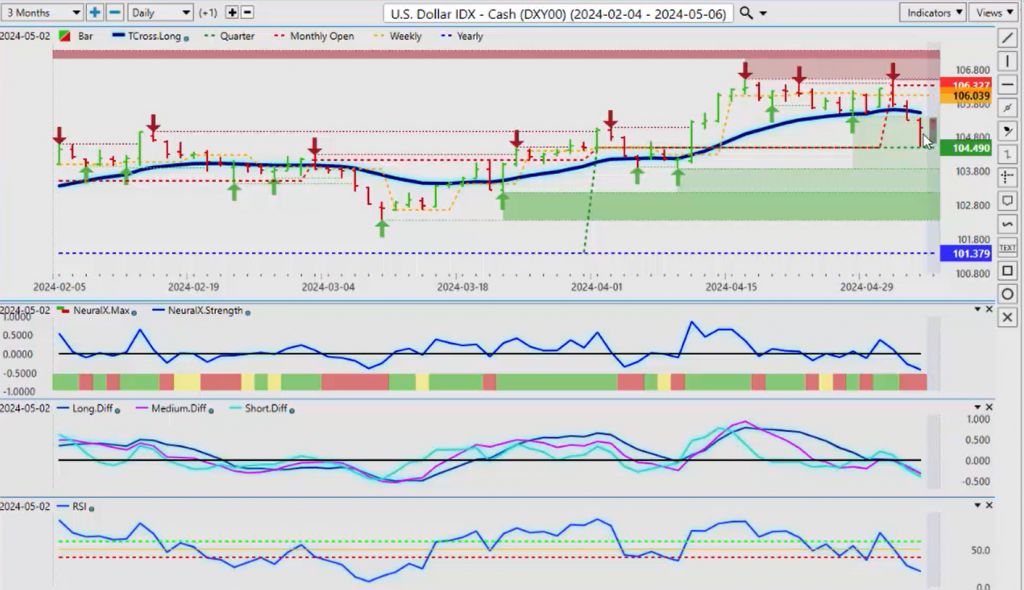
Now, to get started this week, we’ll begin with the US Dollar Index. Once again, a very weak payroll number—the U6 number going to 7.4—that’s a big concern. Downward revisions… I think we’re questioning why the Fed is not cutting, but that’s a separate argument for now. Our quarterly opening price, 10449, and all the indicators at Vantage Point are bearish for next week. In most cases, whether it was a good payroll number or bad, the dollar usually sells off on the Tuesday after the non-farm payroll. But in this particular case, if we can break down below 10449, the current quarterly opening price, then that would put the dollar on a bearish path at least for next week and maybe the next several months until we get a better idea of what the Fed is going to do next. The indicators remain bearish, and selling while under 10553 is a very reasonable play.
Gold
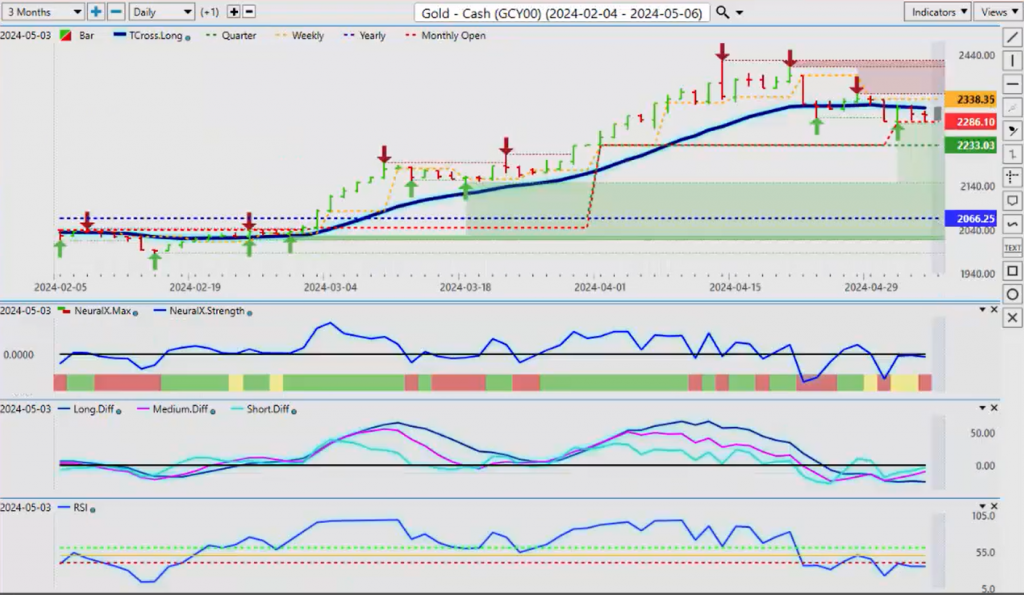
Now, gold is again below our T-cross long. Both the dollar and gold are above their yearly opening prices, but gold is firmly above its quarterly opening price at 2233. That is the area we want to watch very closely for next week. As long as we’re staying above 2233, long positions remain in play, and the dollar is likely going to take a hit. We have an MA diff cross that is completed; it’s telling us that gold is getting ready to turn higher. We just need to clear 2318, guys, and stay above it, and then we would see gold extend. But again, we need to make sure that everything is moving the way it’s supposed to, and right now, the weekly opening price from this previous week and the T-cross long have contained gold even on a Friday, despite that weaker payroll number. So, in most cases, the gold seasonal pattern ends closer to mid to late March, so this could be problems for gold, not just the dollar. But for now, 2066—we’re above our yearly opening price—and the main thing we want to do for next week, 2233, that’s the key area. As long as we hold above that, gold longs are still in play, or for an alternative, you can set up sell limit orders below 2233 in the anticipation that gold is getting ready to move lower and the seasonal pattern is completed.
S&P 500 Index
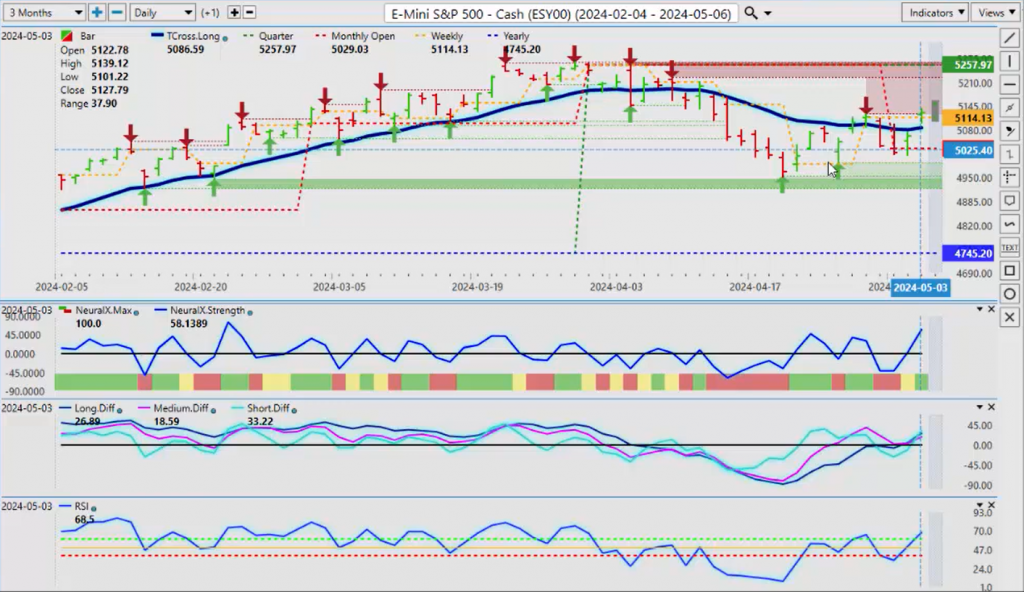
Now, when we look at the S&P 500, and I’ll also make sure I look at the European equity markets this week, the S&P has retaken our T-cross long, and we’ve closed above the current weekly opening. So, a good reversal week for stocks. The indicators are quite bullish at this particular time, but once again, I want to hold above the current weekly and monthly opening prices. The monthly opening, coming in at about 5029, is a substantial area of support, along with our T-cross long at 5086. If these levels hold, then the equity markets are likely to extend higher because now they’re going to be second-guessing what the Fed’s next play is going to be. Is the real labor market starting to show itself? The softer inflation data, is that going to make things a little easier for the Fed to start to cut? I believe it will, so we’ll see where we go with this, but for now, that is the key level to watch.
Light Sweet Crude Oil
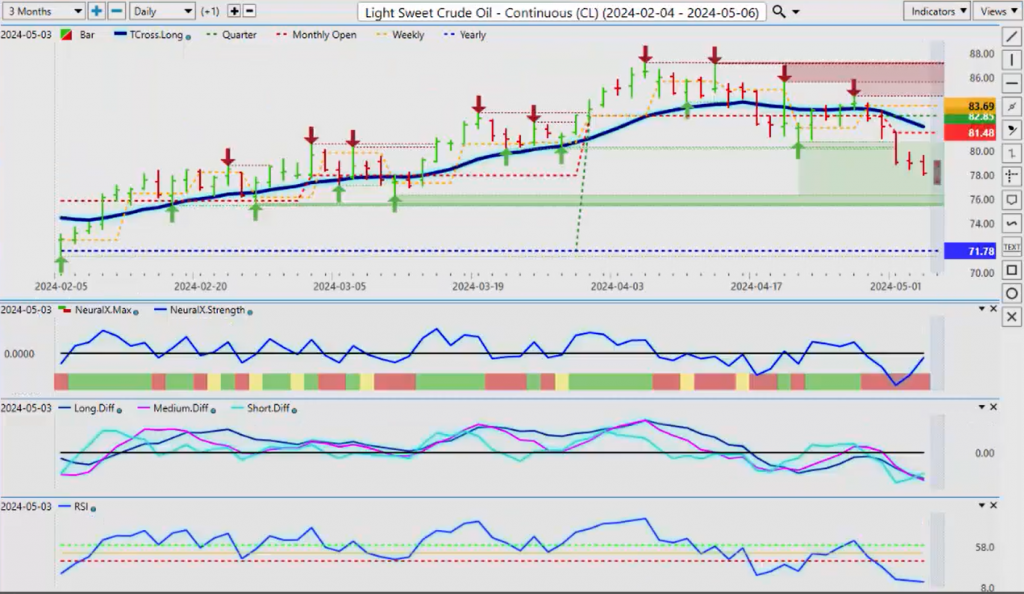
Now, light sweet crude oil, going into next week, I am anticipating a reversal on oil coming very soon. You can see our MA diff cross is trying to move back up, our neural index strength indicator as the market is moving down for the last several days, it’s moving up. That is a huge warning sign for me that a pending reversal is imminent. So, the low point for the week, that’s going to come in at about 7796. I will respectfully submit that longs actually do look good between 76 and 77, as these indicators start to reverse. Predicted RSI at 15, basically running out of steam down here.
DAX
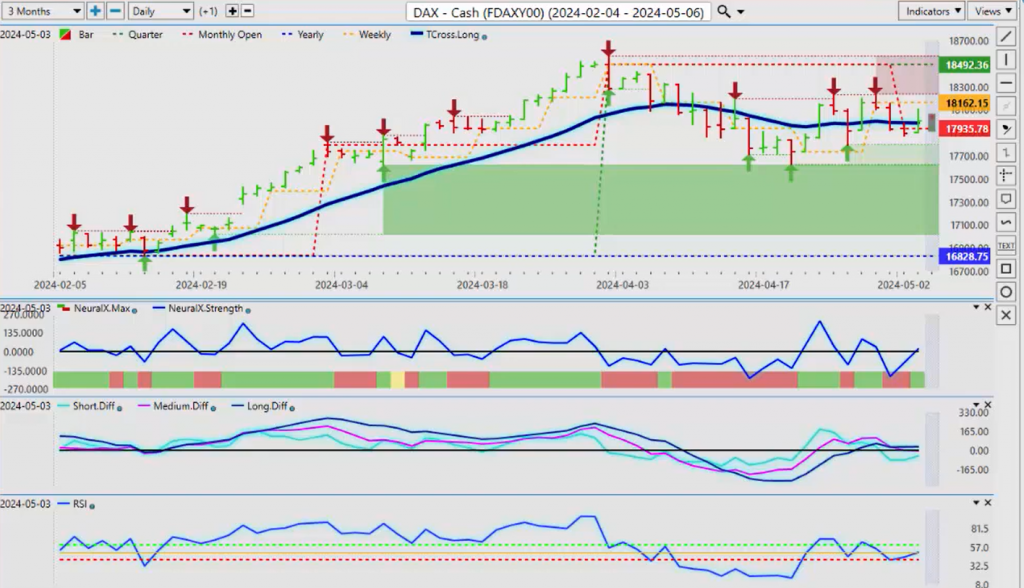
Now, when we look at the European equity markets, which I missed last week, I apologize, the DAX 30 will suffer basically the same fate as the S&P. So, if the S&P moves higher, the dollar takes a hit, and I suspect that’s why gold is stalling out because the market is taking more of a risk-on scenario, and I believe they’re going to move into equities. So, the DAX, everything looks good for it to move up. You can see it starting to reverse with that big reverse check mark coming off the neural index strength. So, as long as we can get above our T-cross long at 17,984 and stay above the monthly opening price at 17,935, then the DAX should move higher next week. That’s what I would look for, barring any Middle East conflicts.
Volatility Index
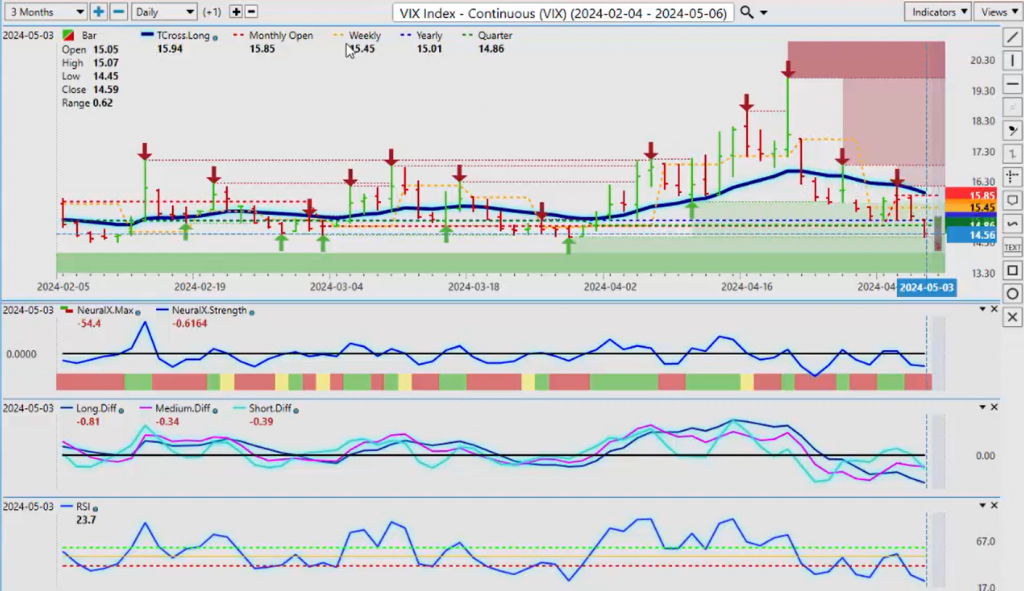
I don’t have any control over that, but I would also validate those trades using the VIX. Now, the VIX is crossing over its current yearly opening price, and that’s coming in at 1501.
This is a huge level here, guys, because if we stay below that, it will confirm that our indices, on both sides of the pond, are going to move higher. So, keep an eye on that area for next week. There is a reversal indicator with the MA diff cross, but I also think that the reversal may have completed because we’ve come back up into the T cross long on the VIX, and we’re starting to turn back away from it. And now we’ve broken the current yearly opening price, so if you bought the VIX on January 1, you are now officially down money, and we look to build on this particular signal.
Bitcoin
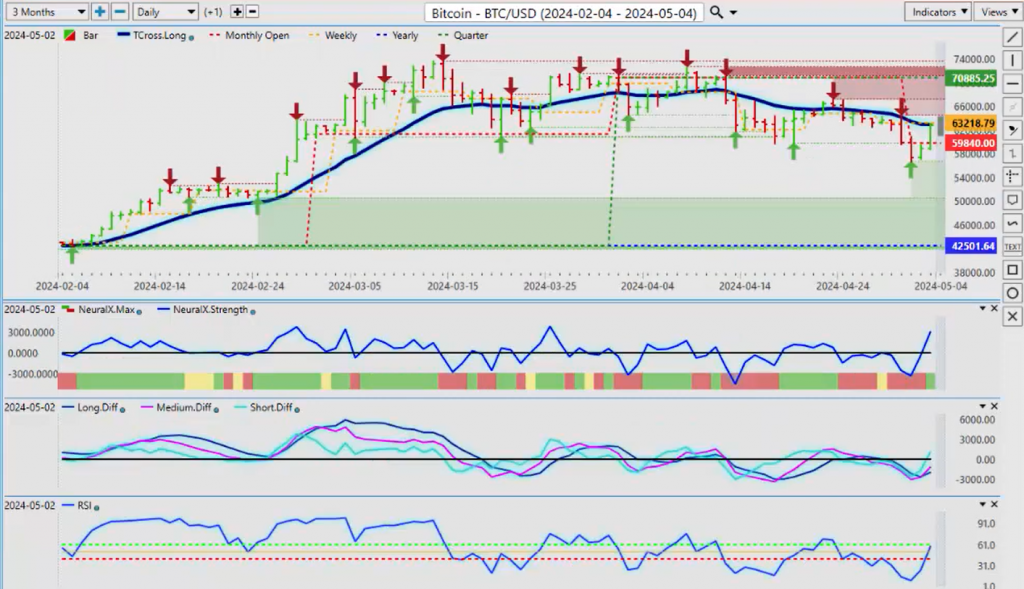
Now, as we look at Bitcoin for next week, we have a newly formed verified support low. That level will come in at 5668. As long as we can hold this level, then I believe Bitcoin can overtake the T cross long at 62975 and resume its uptrend. But that is the line in the sand. We must cross that area again. This market—excuse me, this is an outlook, not a recap of something that’s already happened—we target areas going into the next trading week that we watch for, and if you have you’re armed with that knowledge of that data, then you can make an informed decision. Another way again of playing that is a buy-sell in the T cross long, and then buy off the TCross long. There’s some meat on the bone for the bulls and the bears in this particular scenario. So again, that’s the area we tend to straddle, right around 62975.
Euro versus U.S. Dollar
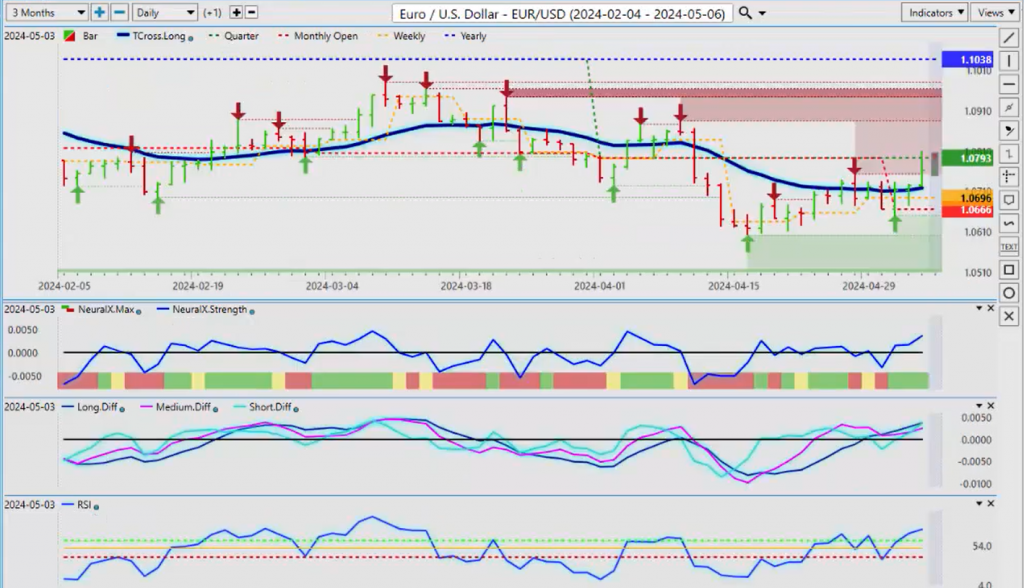
Now, going to some of our main Forex pairs, they are all going to be dependent on the dollar’s demise next week, guys. If you look at the Forex market and the G7 pairs, you’re either buying or selling US dollars. That’s what you’re doing. We have a pretty strong sell signal on the dollar index, so the euro is likely to benefit from this. Now we need to clear—we have a hurdle here—the current quarterly opening price is coming in at 10793. So we have to get above that area next week and stay above that area. The indicators do support that, but our T cross long at 10708 is equally an important level. Those are the two main areas to watch.
British Pound versus U.S. Dollar
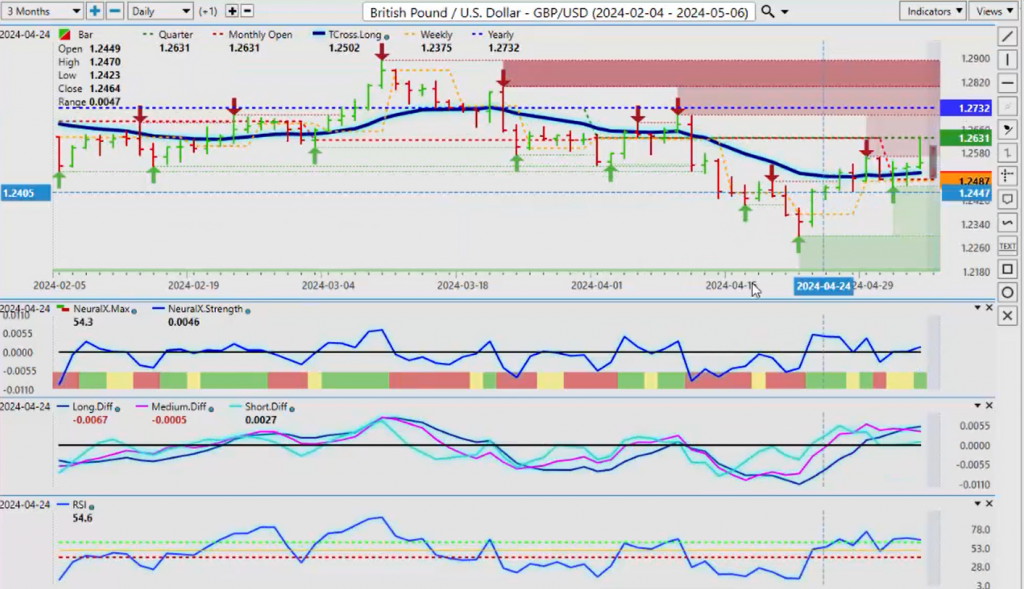
The British pound is going to look exactly the same here, guys. And what I mean by that is, it’s virtually the same trade. The euro is slightly stronger. Now, the only thing that concerns me about dollar weakness next week is that you can see that the British pound came all the way up today, on Friday, to 12631, and immediately failed. Now, if I took a rolling performance model and just said, ‘Oh, I’m just going to put the last random 30 days, or 60 days, or 6 or 8 months… no, no, no, guys, we need solid anchor points in our trading. The reason that the current quarterly opening price is so important is because it’s technically bearish while under it. On the quarter, we’re bearish on the year at 12732, so that’s the level we need to break through next week, 12631. And that could be a tall order with pending rate cuts coming from the Bank of England.
U.S. Dollar versus Swiss Franc
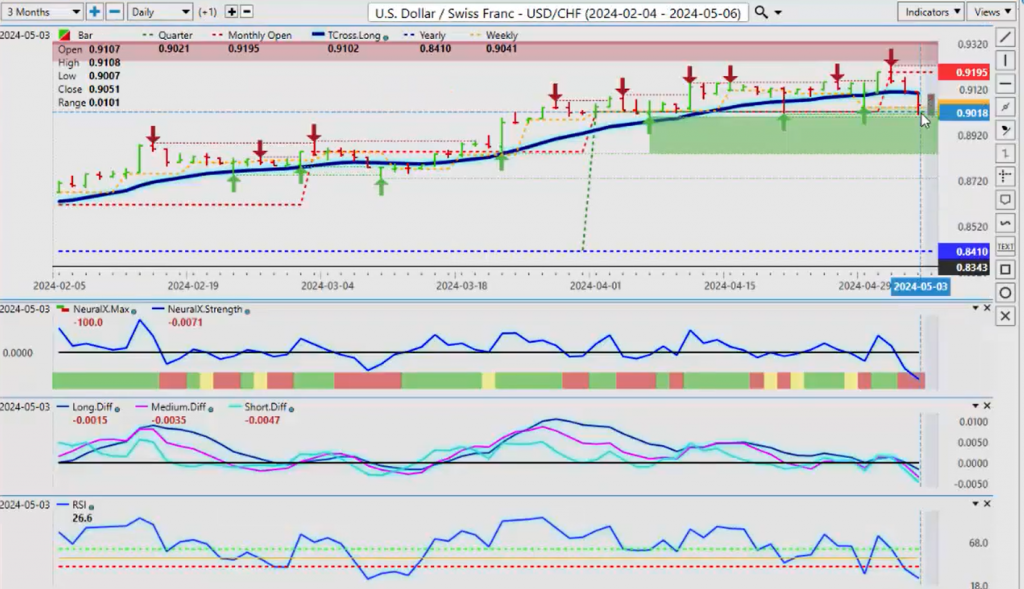
Also, the US-Swiss franc, again, I think it’s getting ready to make its move. It’s had a big run up here, the dollar has had a good run against the Swiss franc, but this could be it. We’ve got one final level of support here, and that’s coming in at about 9041. If we can close below that, you can see that there’s very little support until we start to get—well, there’s one small one there at the 8998 area, but I think more likely this one is in play at 8839. So we’ll keep an eye on that one. The indicators are very bearish on this particular pair.
U.S. Dollar versus Japanese Yen
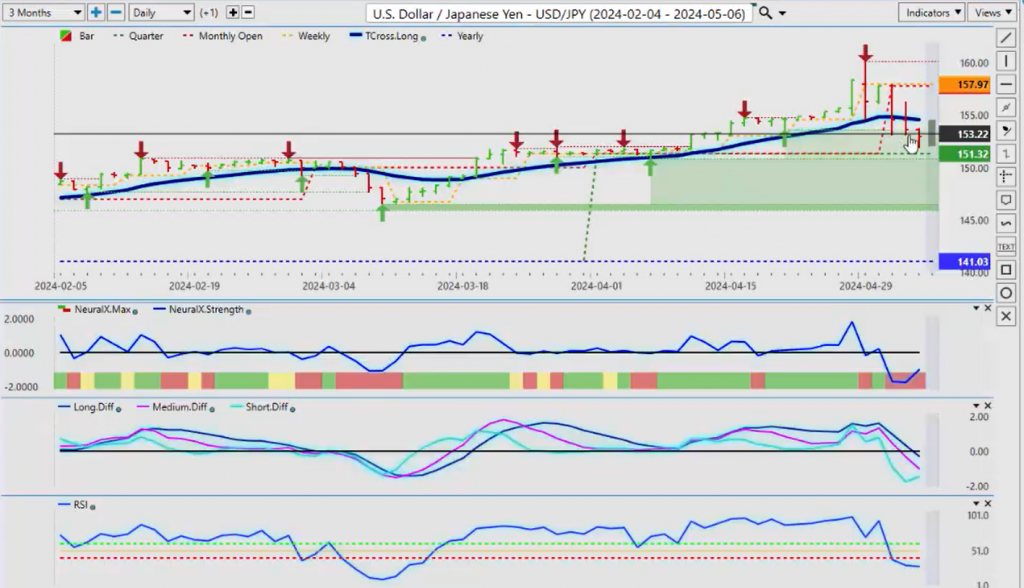
Now, the dollar yen, once again, guys, I’ve warned everybody as best I could, because of the length of time I’ve been in these markets, and the Bank of Japan had to do something after last week’s presence, and I commented on this in last week’s weekly outlook and said, ‘Whenever I see a bar like that, that’s the last thing I want to be doing is buying it.’ So, I am not convinced that the Bank of Japan’s intervention is going to work this time, until the Fed gets more aggressive on rate cuts, then we’ll see yen strength. So yes, this does look technically bearish for the week, but I would be very, very cautious with this pair or any pair that has a Japanese yen in it.
U.S. Dollar versus Canadian Dollar
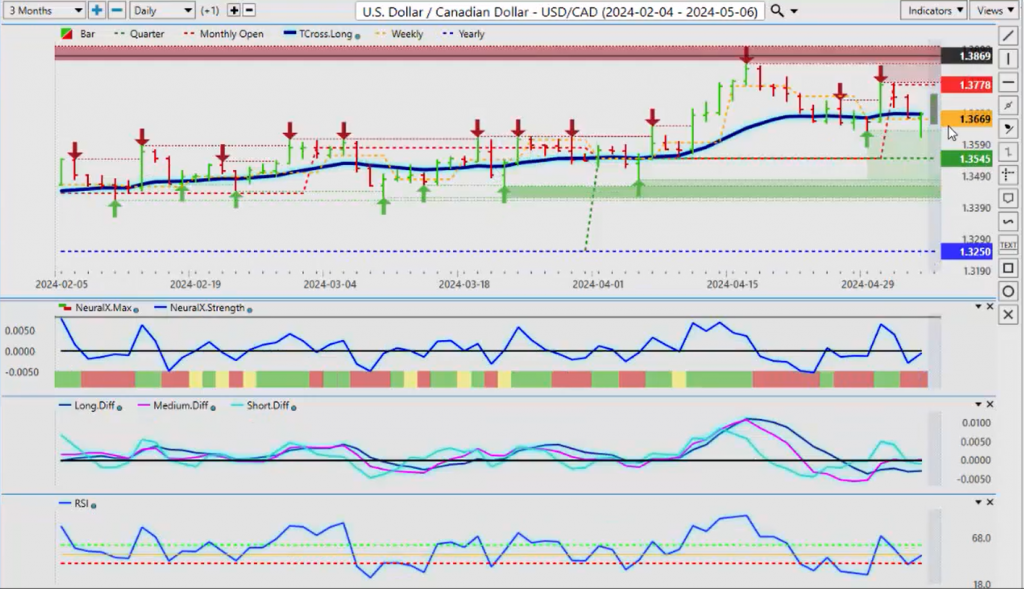
Now, when we look at the US-Canadian pair, once again, if that oil trade and stocks pick up, then that will favor the Canadian dollar. Our T cross long, 13685—if we can hold below that, and the current monthly opening price at 13778, then shorts are heavily favored on this pair. My only concern is when—not if, but when—is the Bank of Canada going to cut? So I believe that that’s already being priced in to the Canadian dollar because I think he should have cut two months ago, by the Bank of Canada, to be clear. So, I believe that that price has worked in, and selling into rallies would be the better play.
Australian Dollar versus US Dollar
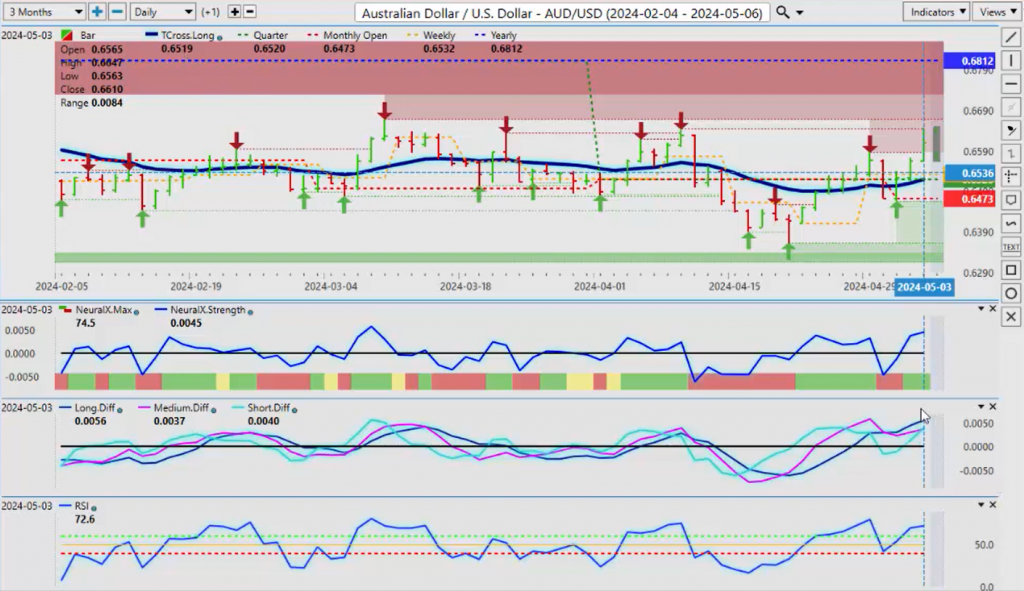
Now, the Aussie and the Kiwi, once again, I think buying dips will be good on this too. Our T cross long, that’s coming in at 6519. Indicators are relatively bullish. That little MA diff cross is a bit of a concern, but again, I believe that to be a retracement, is what it was telling us, and we kissed off our T cross long at 6510 and we’ve gone up from there. So, we are coming into a hot zone up here, 6667. We need to clear this, guys. If we can do that, you can pretty much be sure that maybe this month, we’ll be targeting 6812.
New Zealand Dollar versus U.S. Dollar
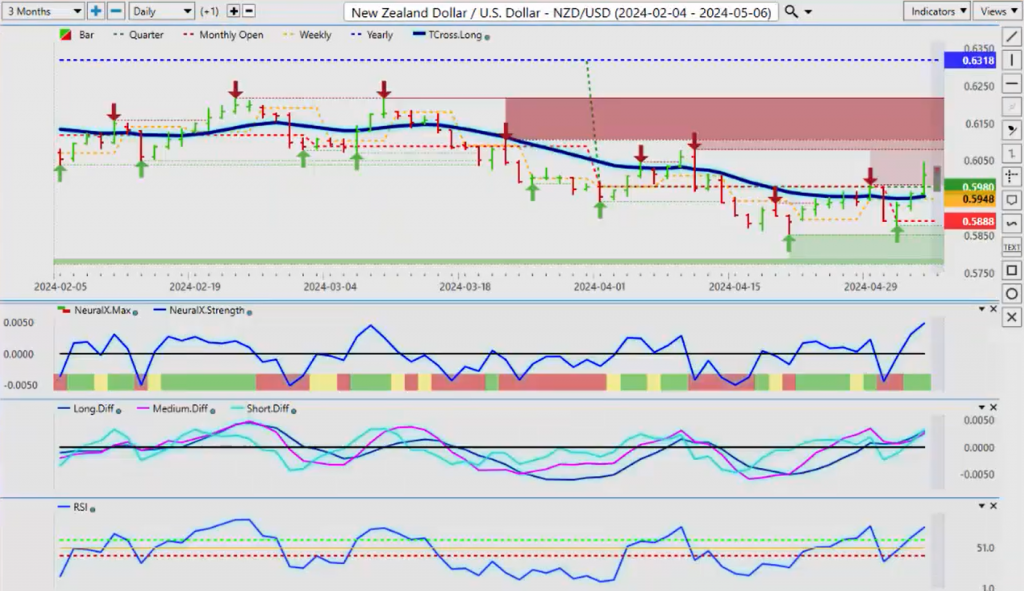
Now, the kiwi is the same trade here, virtually identical trade. So, right now, it’s looking good. We’re coming off our T cross long at 5954. We just need to hold above the monthly opening price at 5888, and 59—that’s the big one for me, the quarterly opening price at 5980. As long as we can stay above that, then I believe we can extend higher on some of the Asian currencies.
So, we’re likely to have a very choppy start to the week while everybody digests that payroll number, but I think that ultimately, they are likely to come away saying the Fed is more likely to cut than hike, or even hold going forward. So, with that said, this is the Vantage Point AI Market Outlook for the week of May the 6th, 2024.