


Welcome to the Artificial Intelligence Outlook for Forex trading.
VIDEO TRANSCRIPT
Hello Traders and welcome back. My name is Greg Firman, and this is the Vantage Point AI Market Outlook for the week of November the 13th, 2023. Now, to get started this week, we’re going to look at the accurately look at the broader Market. The spy’s this week, actually they’re up 1.1%, a pretty solid move off that Weekly opening price. On the month, we’re up 4.86%, so again, it’s very important that we’re not using that rolling performance model because it becomes misleading as to what the actual Market really did. So when we look at this, the S&P 500, we can assess as doing the same thing, the S&P basically up on the month about 5% on the month. So again, very important that we’re looking at the current monthly opening price to identify where we are in the current Trend.
So the S&P 500, what we want to look at is this rally from the beginning of September and how we apply Direct intermarket analysis. So in this particular case, we can see that the S&P 500 has gone up 4.9% from basically the end of October, October the 31st to the November the 4th. So if we look at how an individual stock reacts to that based on intermarket analysis, we’ll use the Ford stock as an example. We can see while the broader Market went up 4% during that same period, the Ford stock went up 9.9%, so again, it’s important to Accurate accurately look at what the vantage point software is actually saying here.
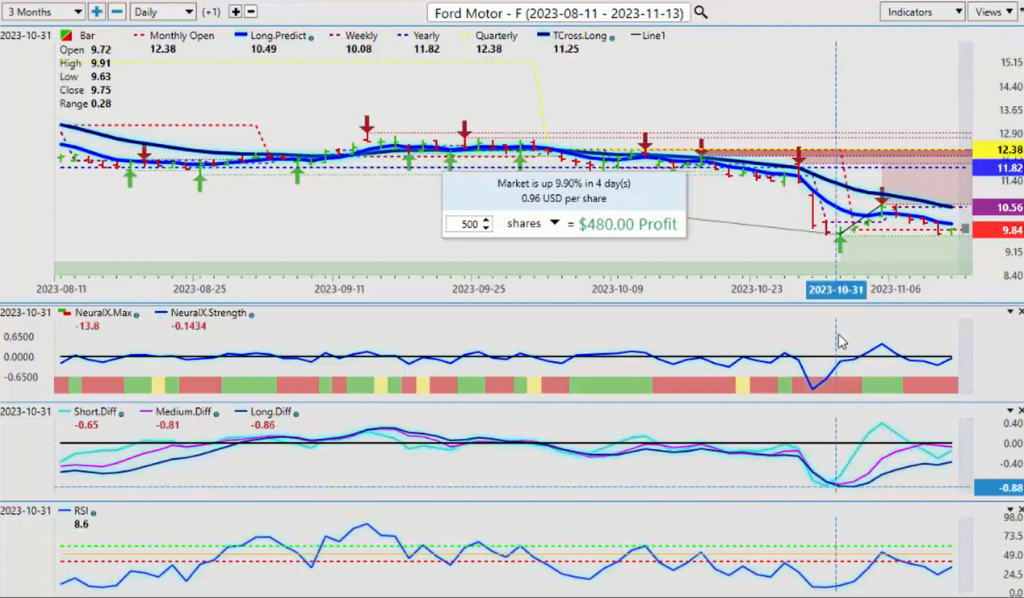
So the ma diff cross occurred on that particular day, and we have rallied up. So on the current monthly opening price with Ford, we can see that there’s actually likely a buy setting up here. Now, when I look at some 18 qualified analysts, they’re basically the median price on Ford is $13.75 per share. Some will say that the fair value is closer to 20, but the medium price at $13.75, so we’re also about 23%, 22 to 23% out of fair value for this stock. Now, again, it’s been driven lower by the UA strike, a six- we strike, but that’s all behind us now. So when we look at what the Vantage Point software is actually saying on this, the medium and long-term predicted differences continue to rise, even though Ford is slipped back to its monthly opening price. The seasonal pattern on a stock like this actually shows that it’s up usually about 80% of the time between mid-November and the end of the calendar year. So even if we return back to the median price, that would be $13.75, that would be almost a 40% return on this particular stock.
But the main thing we want to look at is that Ford rallied at the exact same time that the spys did, or more specifically the S&P 500, but it grossly outperformed the main index. So it’s always good to look at what something is saying because, again, I believe that the Ford stock will likely pull a little bit lower somewhere down between $9.920 and $9.50 a share would be an excellent buy at this particular time of year. Always remember, guys, short selling a stock is very risky and very expensive when the broader market usually moves higher over the longer period of time. So we don’t want to lose sight of that. So for right now, with the spys coming in this week, and this is why I would connect the dots to something like the spys, the S&P 500, and use Ford as an example because if we do pull back and this ma diff cross has crossed to the downside suggesting that the broader Market could pull back a bit.
So we would look for those areas, and that would be the T cross long 4313, but more specifically the long predicted at 4360. So that’s our pullback, and we’ve had a strong close on the week here. So again, we’ll see if we can build on these gains, but the minimum retracement would be back to the Vantage Point Long predicted. Then we would use the T cross long as a secondary level to buy from. But again, it’s very important that we’re looking to what the actual software is saying here on these on the neural index strength. It’s starting to move point to the upside, the predicted differences continue to r. That tells us that the medium-term crossover and the long-term crossover, the strength is turning around. It’s starting to reverse; that’s extremely important.
And then we always want to look at what the broader analysts think of something. So again, if we’re looking at 18 qualified analyst analysts, they have this as a buy or at least a hold on this particular stock. So if we see the S&P 500 starting to move higher, the probability that it pulls this stock and many other stocks up with it is extremely high, and that is the basis of intermarket technical analysis.
U.S. Dollar Index
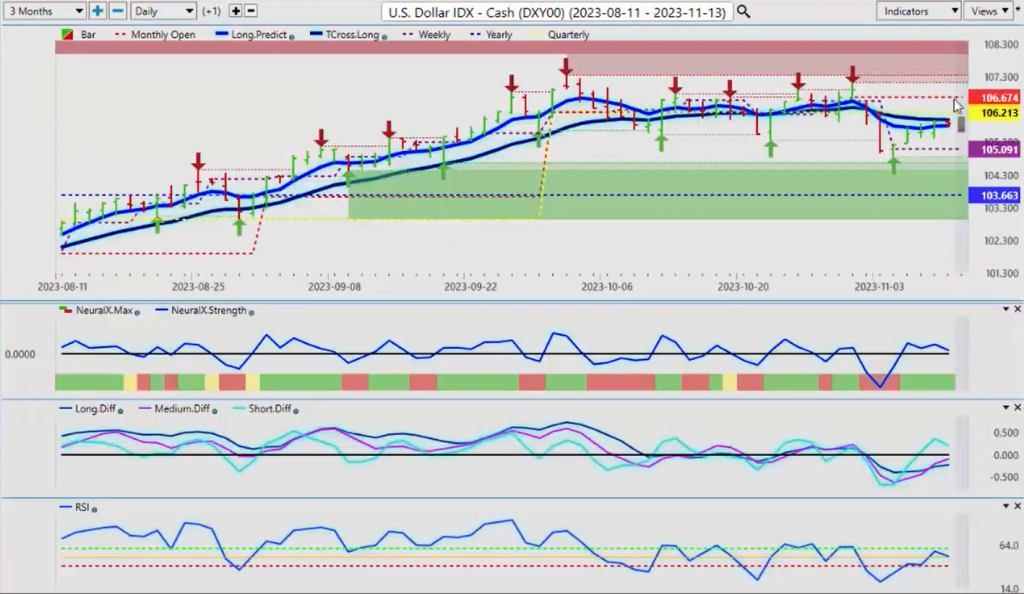
Now when we look at the Dollar Index going into next week, the Dollar’s had a tough week here. Now again, 106.21, we are in the fiscal us first quarter, the fourth quarter ended on October 1, and you can see by using an accurate Anchor Point, your current weekly opening, your current monthly, your current yearly opening price, and more specifically your current quarterly opening. “So unless the dollar can clear 10621, much like that Ford stock, there’s a strong seasonal on this one also to the downside as we go into year-end. But I still suspect some dollar strength here, but I also believe the FED has backed himself into a corner, and they’re probably going to be looking at cuts by early March. So think about that if they start to even suggest a cut, that would send the S&P 500, the NASDAQ, the Dow considerably higher, barring a recession. But if that happens, all the feeder stocks below that will start rising with it, as I just showed you using Ford as an example. Because again, there was nothing to really drive that stock up 10%, but you can see how an individual stock reacts to a risk-on environment with the S&P, the spys, the NASDAQ moving higher.
But for now, the dollar is still above its yearly opening price, and it’s again struggling on the current monthly opening price, which is 10674. Once again, rolling performance models lag the market, they give false entry points. The anchor points are like playing a game of soccer, and then you’ve got a breakaway down the field, and you go to kick the ball in the net, and they just simply move the goalpost on you. So we don’t want to get involved with that because, again, it often leads to false entry points.
Or as we look at this week with the spys saying, “Well, you know, the market, the broader Market’s kind of boring this week,” well, no, it’s actually not. It’s actually up 1.1% when we look at it accurately, and it is not down 1.16% on the month. We’re actually significantly up on the month, and again, using each month, each week, each quarter, we lock that area in, and we use that as a support or a resistance level. So for right now, 10621, and we’ve got our T cross long at 10598. If the dollar cannot clear these levels, then you will see currency pairs like Euro/US, Great Britain/US start to slowly rise, despite fundamentals that arguably are lagging.
CPI data coming out of the US this week, well, so is the retail sales. But the CPI is a lagging economic indicator. So how much weight are we going to put on that? I would say very little at this particular time. But if we do get a softer number, then I’m pretty sure that the global Equity markets are going to respond positively to a softer CPI number, boosting the main indexes and those individual stocks. So we’ll watch that one very closely.
Bitcoin
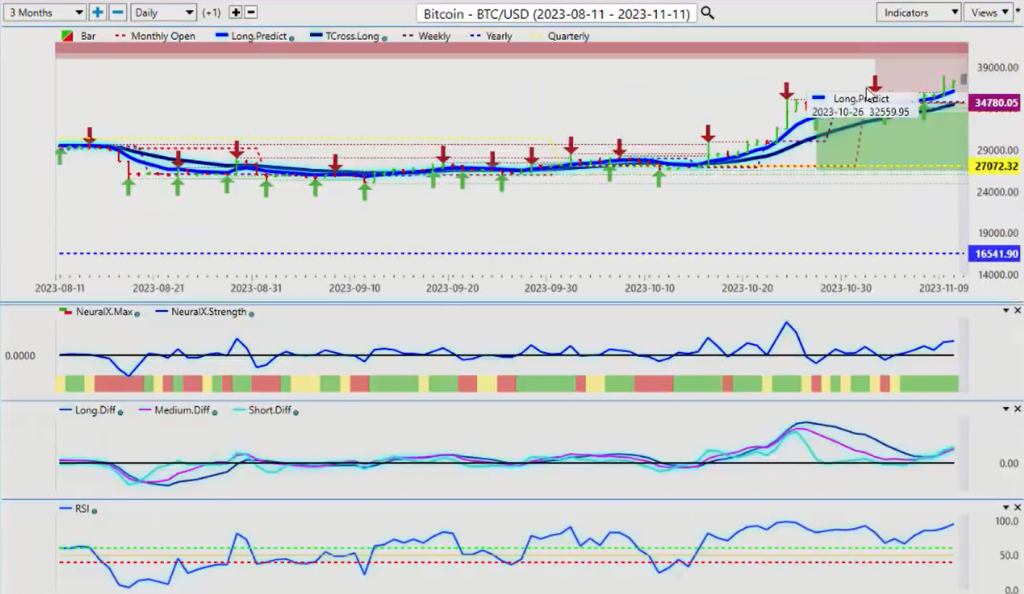
When we look at Bitcoin, Bitcoin this month continues its advance, but what I’ve talked about with the Bitcoin rise, we were a month ahead of this move, guys, on bitcoin. But I believe we’re close to a month, that we’re weeks ahead of this move too, in my respectful opinion only. This Bitcoin rally usually starts to soften by mid to late November. So be cautious, be very cautious of a bull trap up here. We’re going to keep a very close eye on the VP indicators, but I suspect a minimum retracement level of 3447, but I’m not going to rule out a retracement back down to the monthly opening price, the current monthly opening price, not random 30 days ago, guys, because that doesn’t tell us anything. We need to know what it’s doing in the month of October and then combine that with the VP indicators. So again, if we, the monthly opening is sitting there, but that quarterly opening is sitting at 27,072. So that’s a little concerning to me, and the fact that this Bitcoin rally usually starts to fizzle out in mid to late November. So be cautious up here, but as long as we’re holding above the VP cross long at 34474, then the bias remains the upside.
But I suspect that we are going to retest that particular level.
Gold
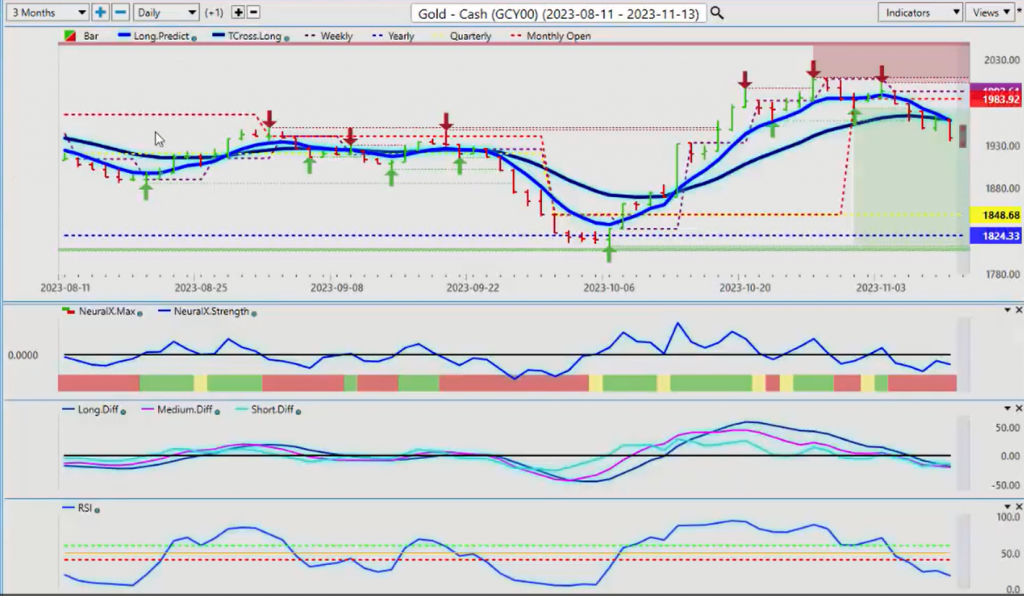
Now when we look at gold contracts going into this month, as stated in last week’s weekly Outlook, that gold is likely going to pull back. But we would be looking to buy this more into the early part of December. That’s a known seasonal pattern here. So I’m looking for the VP indicators to start to reverse here towards the end of November. So I can start looking at picking up gold contracts again. Gold firmly positive on the year. Just another quick note on using a current yearly opening price, a year to date. I’m not overly concerned what it did 300 days ago or 30 days ago, for that matter. I need to look at these anchor points and use them effectively.
We can see on Monday right here on the 6 when we started the week, we immediately crossed over 1883, and you can see the outcome of that. We started moving lower. But again, when we look at this going back, it’s important to use these accurate levels because it’s objective, not subjective. When we look at even a Blue Line crossing a black line, that can be subjective to some point, but when we look at a current monthly opening price, that’s objective. We’ve got a line in the sand and saying, “Okay, I actually don’t have any buyers up here. I’ve crossed over the VP levels.” But again, we’re always trying to get out in front of things because this is an Outlook, not a recap of something that already happened.
So what I’m looking for in early late November, early December is for gold contracts to turn around as the US dollar weakens. So we always are prepared for what’s coming. We’re not guessing at anything, and that again is of critical importance.
Crude Oil
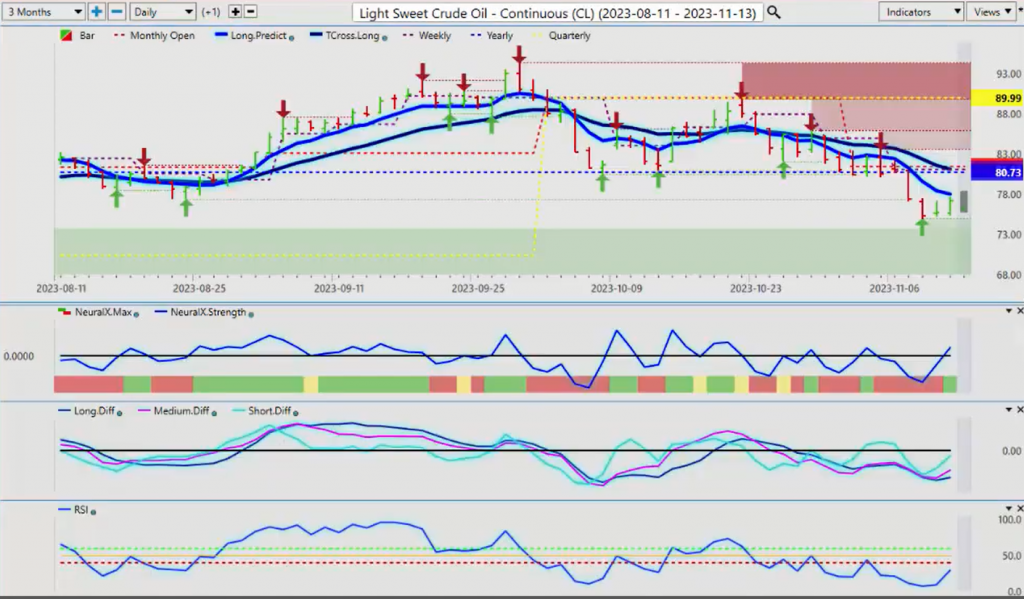
When we look at oil going into next week, once again, you can see that on the yearly opening price, much like those gold prices, gold accelerated off of the yearly opening price, and oil has done that. But the last time it did it, it was back here in the middle of October. You can see in this particular period going into November, we’re sitting right on the yearly opening price. As soon as we lost that, oil immediately tanked, and they flushed all the longs out of the market. So we could be looking potentially for oil to turn around now. I’m pretty sure they’ve got all the stops that they needed, but in the Vantage Point live training room, we discussed this long every single day until we can’t do it anymore. But again, guys, if I took a random 365 days or a random 30 days or even a random 5 days, I wouldn’t see any of this. So very important that we’ve got the current yearly opening price. I’m not going to drag anything from 2022 into 2023. That’s going to create confusion. It’s going to create lag. It’s going to create false entry prices or false analysis in the market. So we’ve got to be cautious of that.
So the way I’ve played this is I will buy, buy, buy. Then I get stopped out, but I have a sell limit order ready to go straddling that yearly opening price. And again, if I didn’t have that there, then I wouldn’t have any of these trades
So it’s very important. But again, right now, we’ve got a solid verified support low that’s coming in at $74.91. I would respectfully submit we are long while that particular level holds because our neural index has turned, the neural index strength, which is rapidly becoming one of my favorite indicators, is pointing straight up, and it’s crossed the zero line. We’ve got an MA diff cross, we’ve got a rising predicted RSI. This is how we get out in front of trades, guys, not analyze them in isolation and guess at levels. We don’t want to do that. We want to look at the predictive indicators and try to get out in front of this thing. I respectfully submit oil goes down on Monday, the Monday-Tuesday reversal that I’ve discussed in the Tampa seminars at the Vantage Point live training room. This is a thing, guys, and it happens most weeks from Monday to Tuesday. Whatever the price does on Monday, it very often does the exact opposite on Tuesday. So if this analysis is correct, I would be looking for oil to go lower on Monday, so I can buy it on Tuesday, based around these predictive indicators.
Euro versus U.S. Dollar
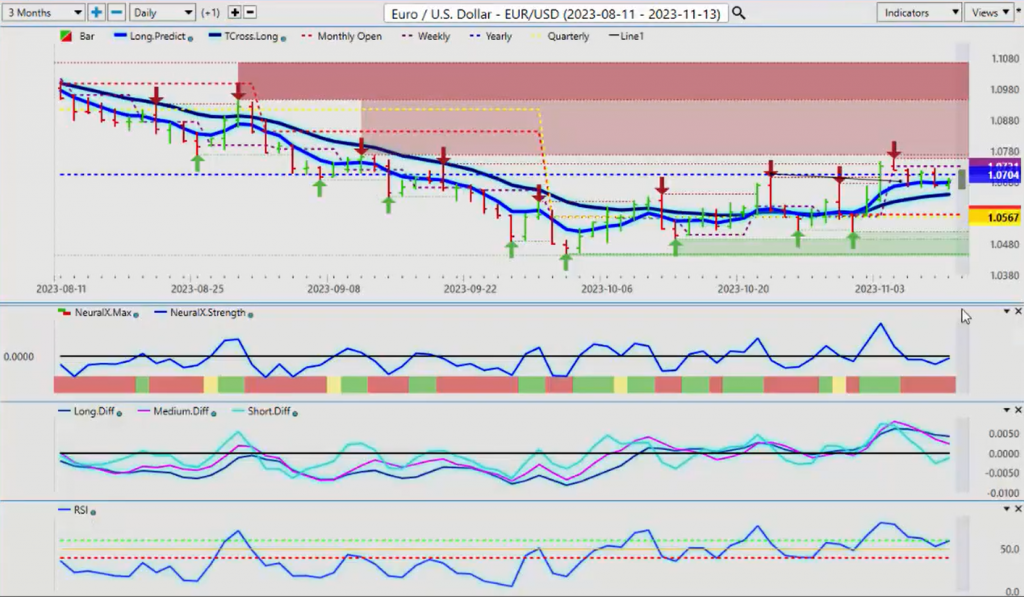
Now as we look at some of the main Forex pairs, the first one we want to look at is Euro/US. Yet, this is the fourth week in a row that this Monday-Tuesday reversal that I’ve discussed has occurred. You can see Friday we had a big bar up. On Monday, we move and make a new high, the market gets long, and then by Tuesday, they’re stopped out. You can see here on Monday, the bulk of the trading volume was to the upside. We then closed Monday below the opening, and that led to this moving lower. But you can see that the neural index strength warned us of that. Then we have an MA diff cross that’s going off here, but remember, guys, this pair is still technically bullish. That’s not me saying that, that’s the market telling you that. We’ve got our quarterly and our monthly opening price at 10576. Our quarterly is coming in at the same level. I would respectfully submit that unless we break down below those levels, then we would be looking to buy this on a dip. We’ve got our T cross long coming in at 10640.
“So if the dollar turns, the dollar Index turns lower, the only way, the only Direction the Euro can go in is up. So in this particular week coming, I suspect we could break this four-week cycle of the Monday-Tuesday reversal, but it will still be there. But I’m looking for it to make a big push down on Monday and then buy it on Tuesday. So again, four weeks in a row, the Euro going up on Monday and then getting killed Tuesday-Wednesday-Thursday. I think that that is just about done here, and the Euro is potentially getting ready to break.
But again, using the current yearly opening price at 10704, this is the level we need to break. So if you believe that Euro/US is going short, then I would, again, respectfully submit you can short this almost every day last week into that yearly opening price. But I would also respectfully submit you should have buy limit orders ready to go just above 107 because the Vantage Point indicators are very mixed here. The predicted RSI, the neural index strength is pointing back up, so we could see a potential reversal sooner rather than later.
U.S. Dollar versus Swiss Franc
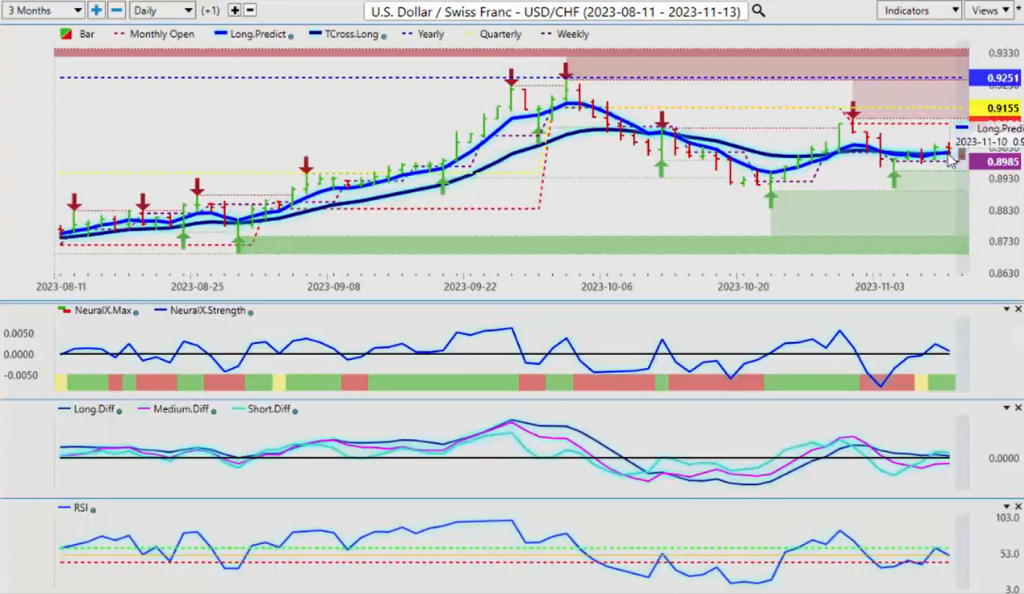
The US Swiss franc, again, the dollar holding in there, but as you can see, the structural bias of this Forex pair, using accurate anchor points, moving away from Rolling performance, guys, it causes nothing but lag and confusion. I will keep stressing that point. The structure of this is very bearish. We’re below the yearly opening price, we’re below the quarterly opening price, and we’re below the monthly opening price. So again, unless we can get above 9251, this is a sell into rallies. The Vantage Point indicators, the predicted differences, are down below the zero line. Once that blue line crosses the zero line, that would likely trigger a bigger move. So right now, the only thing that is holding this thing, currently holding this thing up, is the weekly opening price. So next week, where we’ve closed at 9026, if we can’t stay above 9026, guys, we’re likely getting ready to move lower yet again on this pair.
British Pound versus U.S. Dollar
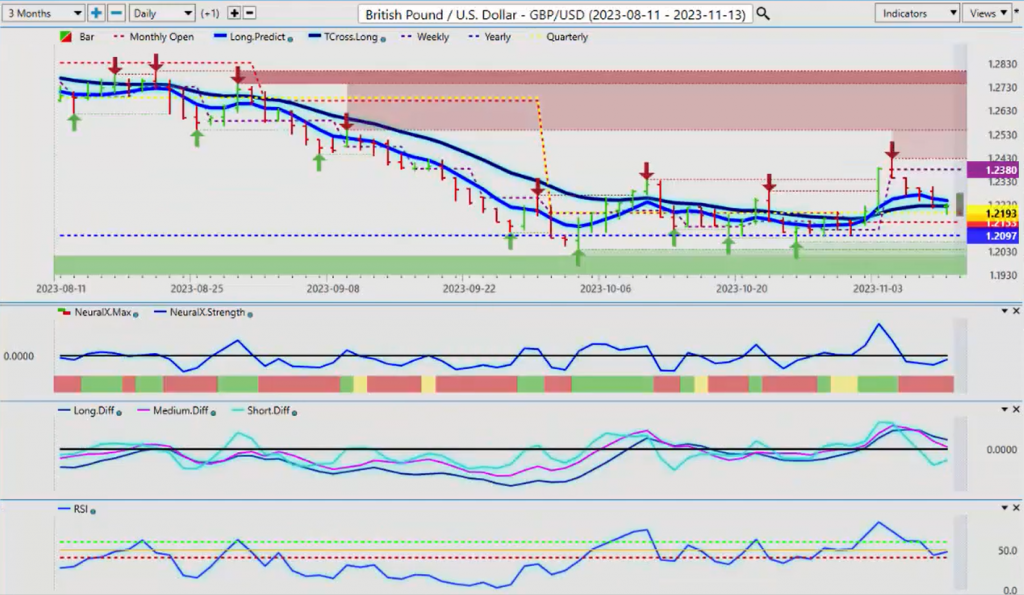
Now the British pound/US dollar, once again, you can see the structure here, buying off the current yearly opening price. This is not a complicated methodology; we’re just combining the yearly opening price with the Vantage Point indicators. When they start rising and the market is unable to break down below the yearly opening price, we use that as a leverage point or a confirmation—an objective confirmation, not subjective. Subjective is opinions and misinformation, disinformation that people often fall for, right? Or they simply add a lagging performance model, and that causes confusion also. So we look to keep it simplistic. So right now, we do have some resistance up here, and that resistance is coming in at 12223, but we need those Equity markets moving higher. We need a risk-on environment to get things. But normally, the pound does fairly well. But for now, again, the MA diff cross is telling us this is a corrective move, not a new trend yet, guys. And I would be very cautious while the market is shorting this while the market is above 1297.
U.S. Dollar versus Japanese Yen
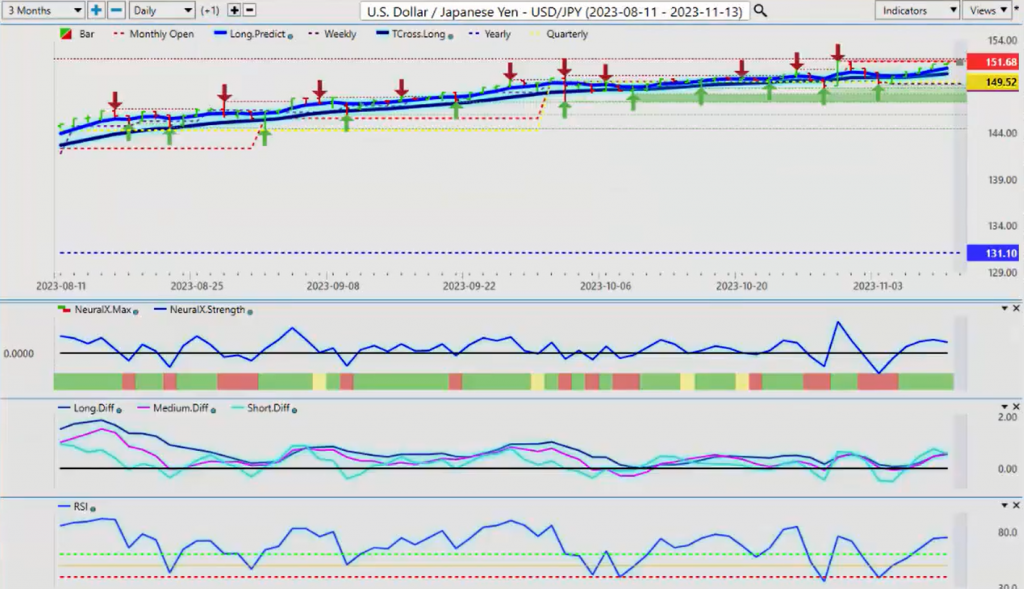
When we look at the dollar/yen now, again, the dollar/yen is a tricky pair. In most cases, the Japanese Yen starts to strengthen at the end of November, and as you can see, once again, using the current monthly opening price. When somebody tells you the monthly level is not based on the monthly opening price, then again, it’s causing confusion. This Anchor Point is quite clear, so we need to clear this monthly opening price. That level is coming at 15168. I suspect very soon we’re going to see sellers coming out of here because again, we’ve been stuck up in this area for quite some time. But essentially since the end of October. So again, if we can clear it, I would further suggest that longs are very, very risky up here. I’m watching these Vantage Point indicators very, very carefully for a potential short.
But in this scenario, I would rather let this thing break down below 14952 because you can also, it’s not just all about looking at one level, we need to look at both. We’ve also got heavy support coming down at 14921. So once we break this support, if we break this support, then there’s potential for a substantial short trade on this pair. But again, it is the carry trade. We’re not looking to hold a short for a long period of time because it could get quite expensive, like very much like shorting stocks. It’s very expensive to short stocks, and it’s very risky. Well, this one could be the same thing because we’re going to have to pay a lot of interest if we’re holding a short for any length of time. So we want to make sure we get the right level on this. But I need that confirmation of a breakdown below 14952, and then we can start, in 2024, I believe we can start targeting back down into the new yearly opening price we get in 2024.
U.S. Dollar versus Canadian Dollar
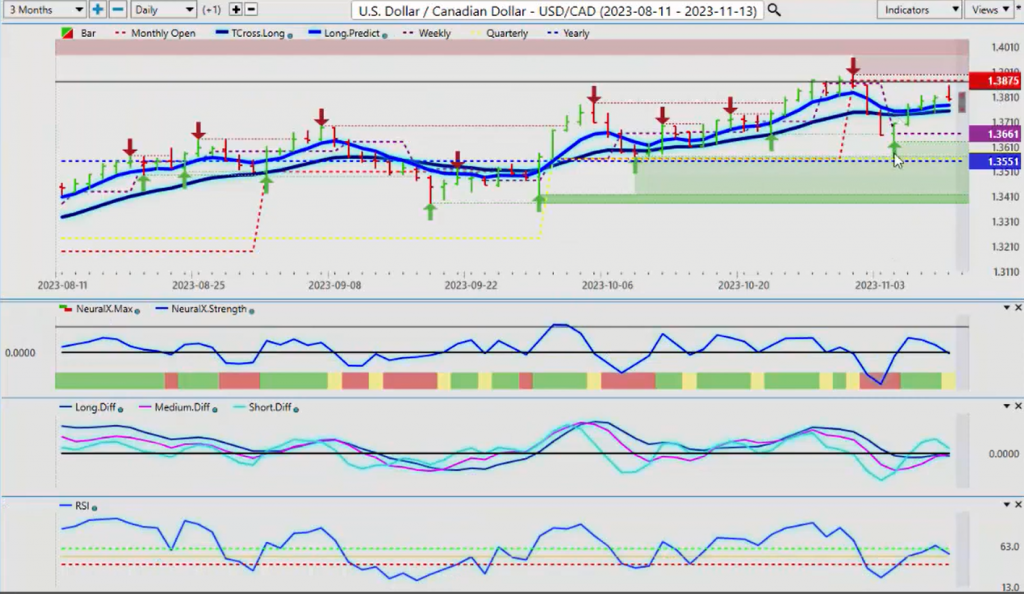
Now the US Canadian pair, once again, we can see the structural bias of this. We start the week and we push down immediately, but then we close above the opening, and it’s very, very important for the average Trader to look and understand what’s happening in these markets. Monday-Tuesday reversal and Thursday profit-taking. With some of the clients I’ve worked over the years, very good Traders, but they’re saying I have problems on certain days of the week, and every scenario, they’re either stopped out on Monday or they’re stopped out on Thursday, only to see the trade would have been profitable the next day. So be cautious of that. Let all the markets come in before you jump in. I usually will not even touch anything until after 9:00 a.m. Eastern on the Monday. But I’m anticipating this reversal.
So you can see that we open US Canada 13661, we immediately moved lower, but then we closed at 13701. And then on the rest of the week, up it went. So right now, the immediate resistance is up at 13875, the current monthly opening. If we can’t get above that, guys, then it’s an easy targeted short. Where the Vantage Point indicators are slowly starting to agree with this. But we need equities up, and we need oil prices up, which I’ve both talked about in this Outlook that oil, we could have a long next week. If we do, then that means we’ve got a long on the Canadian dollar, meaning selling the US Canadian pair. So 13875, what I would be looking for is an immediate push to this level on Monday, only to see it reverse and go lower on Tuesday. That would confirm the Monday-Tuesday reversal on US Canada occurs 85 to 90% of the time here. I don’t look for it necessarily December or August, but all of the other outside months I do.
Australian Dollar versus U.S. Dollar
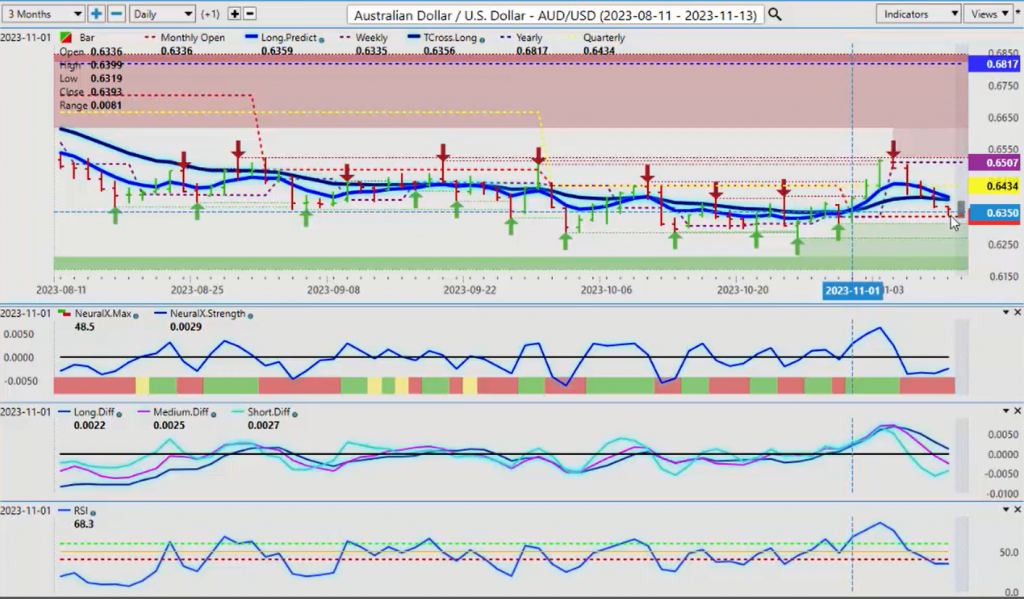
The Aussie and the Kiwi are very, very similar trades to the US Canadian pair. And what I mean specifically by that is their risk-on currencies. If the equities are good, then the Aussie is usually good, the CAD, the New Zealand. So the Aussie right now has retraced back directly
and mysteriously stopped on the current monthly opening price. So again, when we look at the structural bias of the market using the proper anchor points, not a rolling performance, we can see the open push at the beginning of the month, we go up, and then we have a natural retracement. I would respectfully submit this has nothing to do with Fibonacci or waves or any of this stuff. You’re simply running out of buyers up here. So we have a natural retracement. So if the Aussie is going to turn bearish, then we need to actually break down and turn negative on the month. If you want to apply additional indicators, waves, Fibonacci, all the more power to you. But don’t leave out something as important as the current monthly opening because that will… it’s an objective indicator. If it breaks down and closes below that, it’s bearish. Right now, it is a bearish undertone, but it’s still positive on the month, and that’s the way we want to measure this, guys. Are we negative? If you’re saying it’s bearish, then it should at least be negative on the month, right? But it’s not. It’s positive.
New Zealand Dollar versus U.S. Dollar
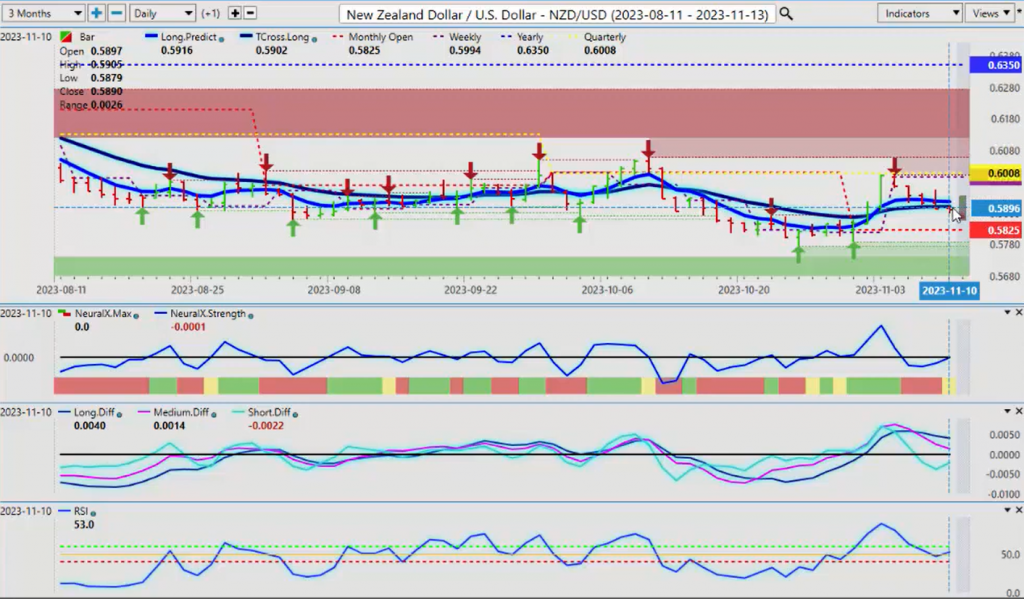
And when we look at the Kiwi, we’re going to see something very similar to this. We’re very much positive. So if I look at the difference between Aussie/US and New Zealand/US, then I think you would hopefully agree that there’s probably better value buying the Aussie/US than there is buying New Zealand. We could buy them both, but it’s virtually almost the same trade. But when we’re talking about fair value, it’s much like that Ford stock. The Ford value, the stock is 22% out of fair value. So why would I want to sell it? Because if I did, it’s going to cost me more money to short sell the stock. I’m carrying way more risk. So it’s the same idea. Which one between these two is more attractive? Well, I would argue the Aussie is slightly more attractive. But again, it’s a very similar trade. You can see we’ve got an MA diff cross to the downside here on the New Zealand pair. But the New Zealand/Aussie has already has a short or a medium-term crossover. But again, we want to make sure that if we’re going to short this, we need to be below the current monthly opening price at 6336. And I think that’s a very, very tall order, particularly if we get a year-end equity Rally or a Santa Claus rally comes early. So with that said, this is the Vantage Point AI Market Outlook for the week of November the 13th, 2023.


