


Welcome to the Artificial Intelligence Outlook for Forex trading.
VIDEO TRANSCRIPT
Hello everyone, welcome back. My name is Greg Firman, and this is the VantagePoint AI Market Outlook for the Week of November 6, 2023.
U.S. Dollar Index
Now, to get started this week, we’ll begin where we usually do with the **US Dollar Index**.
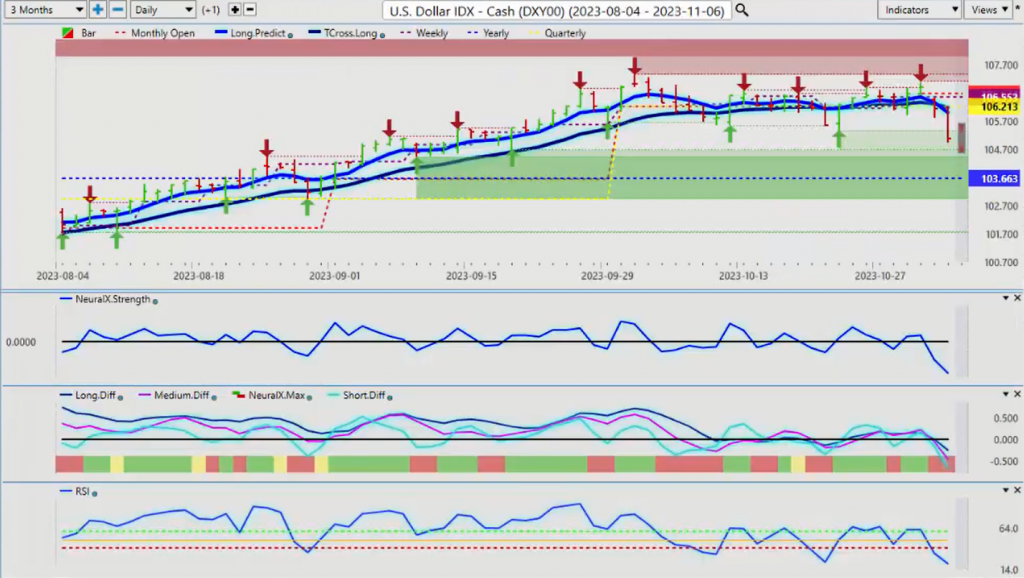
Now, not surprisingly, the dollar is under pressure here after discussing the non-farm payroll number in last week’s session and the session before that. With the payroll numbers not being what they’re trying to sell us on, another week’s jobs report, the dollar is reacting to that—a fairly large sell-off. But the bigger seasonal pattern here is the dollar usually doesn’t fare well in November into year-end anyway. So that just basically helped this move lower.
Once again, we are still above that very critical yearly opening price, **10366**. We’re closing the week at **10509**. Now, again, in most cases, the dollar sells off the week after the non-farm payroll number, regardless of what the payroll number is. But as we can see, leveraging that current monthly opening price, that monthly opening price coming in at or about **10674** is just too much for the dollar, and we moved lower. The **Vantage Point indicators** are well in front of this move, but again, Friday’s bar is a little concerning here—the T cross long **10618**. I still think we can retrace potentially back to that level.
But there is more now, with the **FED** possibly cutting rates.
Gold
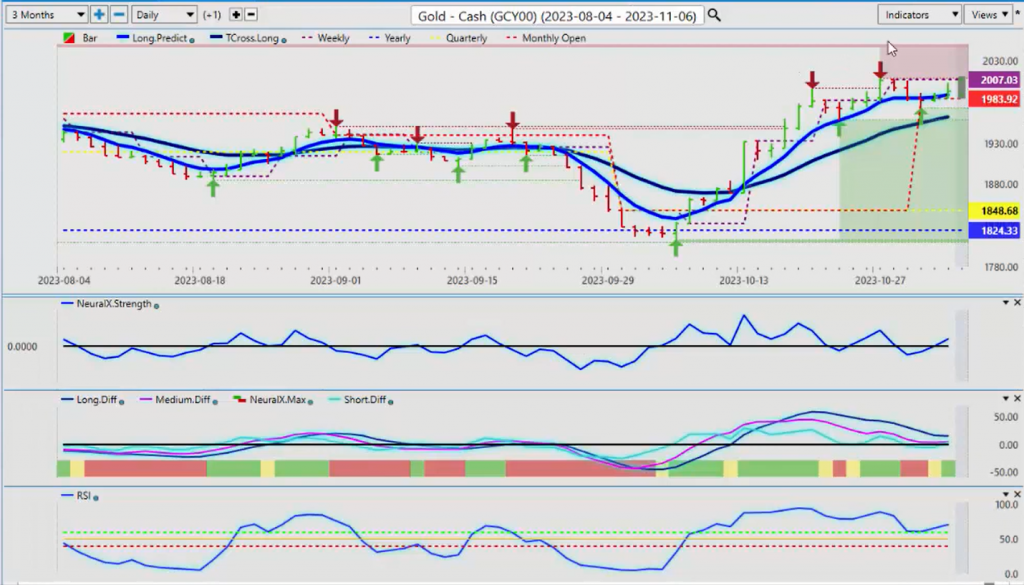
Now, that has helped **gold** markets move up, but gold is stalling out here, guys. We’ve got a verified resistance high **1984**. The opening price on that particular bar, we shot up to **2008.65**, but we couldn’t make any new highs past this. So, once again, we’ll keep the gold remains very bullish on the year. The quarterly opening **1848**. We were well out in front of that move, this move to the upside in the sessions here **1824**. The current yearly opening price, once again, guys, we don’t want to be looking at lagging rolling performance. We want proper anchor points in our trading: the quarterly opening, the monthly, the weekly, the current yearly opening. The last thing we want to do is go back random dates: 15 days, 60 days, 365 days. We use seasonal patterns for that, and again, the seasonal pattern in **Gold** over the last 5 years, it’s been 80% bullish; over the last 10 years, it’s actually been bearish. So, the trend is shifting and moving forward as discussed in these videos.
So right now, gold is mildly bullish here, but again, a little bit of a concern. But either way, I think after a corrective move, as I discussed in last week’s Outlook, that we can extend higher.
S&P 500 Index
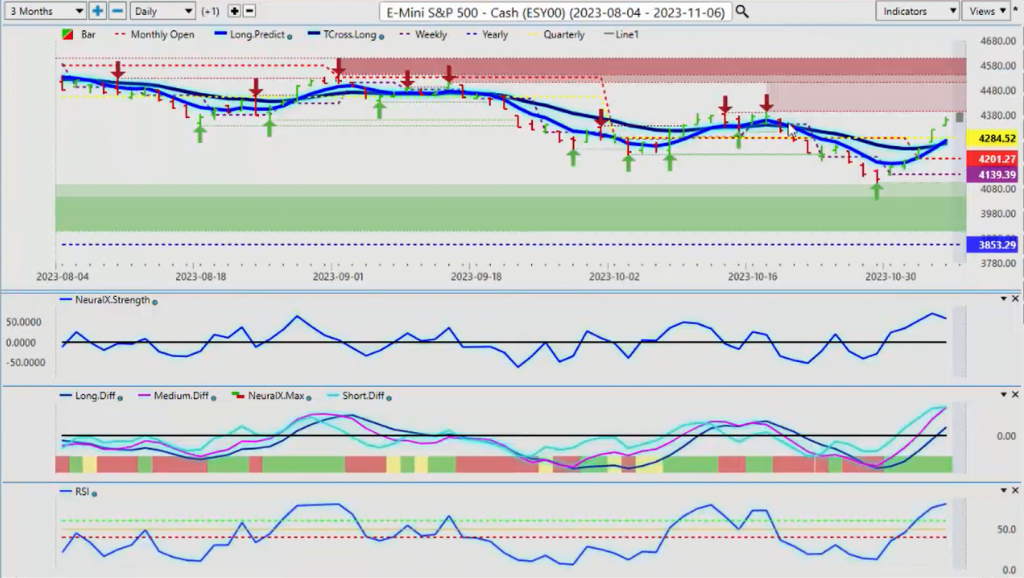
Now when we look at the **S&P 500**, the **SPYs**, once again, the confusion around this, lagging rolling performance model, one week it’s bullish, next week it’s bearish. We’ve been bullish the better part of the calendar year here, guys, **3853**. When we go back and look at this over a 9-month period, once again, we can see exactly what’s been going on here. If we look at the beginning of the calendar year, we moved higher right out of the gate. We came back and retraced to the current yearly opening price and had one heck of a rally. Yet, the talking heads told us only buy US Dollars, don’t buy equities, don’t buy gold, and don’t buy Bitcoin. But again, we’ve got to trade what we see, not what we hear. So right now, the **S&P 500** again, it’s largely had bullish momentum for some time now. But again, now we’ve retraced, had a corrective retracement, and we’re back above the quarterly opening price, **4284**. That’s our anchor point. The monthly opening price is going to come in at **4201**. These are strong support levels that we’re looking for the market to hold.
So in summation, right now, we’re above the weekly, the yearly, the quarterly opening price. These are all levels that we need to look at to make an objective decision on which way we’re going to trade. This rolling performance will constantly create confusion. It will create lag. Keep your anchor points consistent: the start of the month, the start of the week, the start of the quarter, the start of the year. And then we look at our VP indicators.
So again, the MA diff cross, much like what we saw on gold, we’ve hit a low point here, and that was back on October 27th. It’s been turning bullish since then. So I don’t need to look at the last 5 days, the last 15 days, or even the last 30 days to see this. We need to stay current. So right now, we do remain bullish. Our immediate resistance is going to come up at the verified zone just under **4,400**, **4394** will be the area we need to break through this coming week. The neural index strength is starting to slip to the downside, so a little bit of a corrective move. But both of those two key levels are coming in at **4264**, and again, when we look at our long predicted **4274**, all support sitting. Immediate weekly support resides there with, of course, the weekly opening price.
Bitcoin
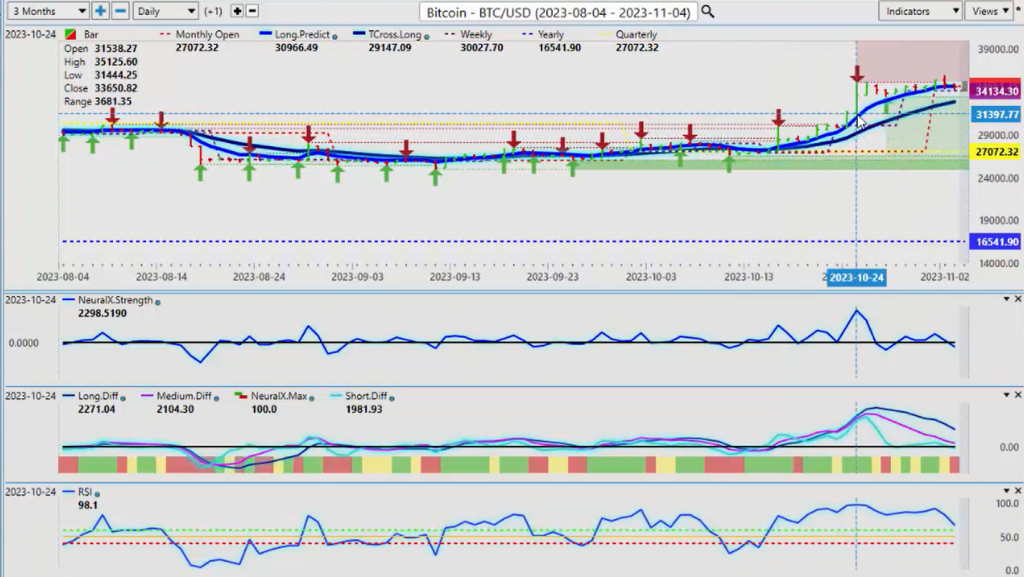
Now when we look at **Bitcoin**, once again, Bitcoin has made a big push. But we have again, that was in mid-October, which we discussed. In most cases, the Bitcoin rally starts to fizzle out by mid-November. So we’ll look at this, but the resistance high **35,1125**, the bulk of this move has come back here when we discussed this in the previous VP outlooks around mid-October, which I kept saying ignore them. Bitcoin is a strong seasonal pattern, but the pattern that’s equally strong is that it doesn’t have a lot of momentum into the latter part of November. So the Vantage Point indicators are also picking up on this, the neural index strength, the predicted differences are dropping, and the predicted RSI is slipping. So if nothing else, I think we will see a corrective move to **32833**, and we can reassess if this area holds, then we will have yet another good long trade on this. But be careful and make sure that we can stay above **32833**.
Light Sweet Crude Oil
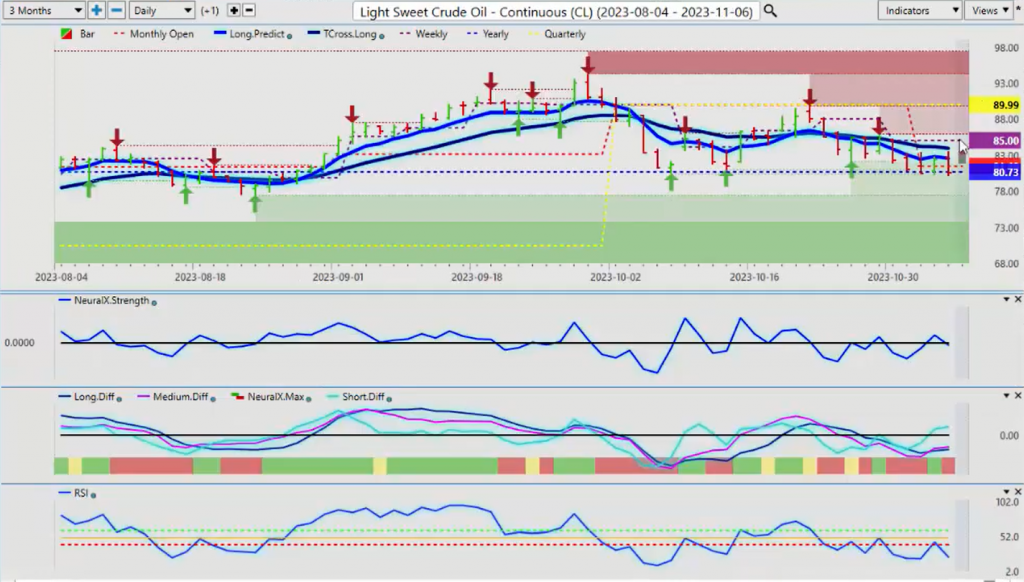
Now when we look at **Light Sweet Crude Oil**, going into next week, Light Sweet Crude Oil is likely to remain under pressure here. But again, we’ve got to be cautious. The current yearly opening price that’s coming in at approximately **8073**. When we start mixing up dates and adding rolling performance, it causes nothing but confusion. One week I’m bullish, the next week I’m bearish. You’re chasing the market, guys. Use proper anchor points. This is consistently hit the yearly opening price going back into early October. This past week, we’ve hit the yearly opening price four out of the five days. So there’s enough meat on the bone for everyone here, for bulls and for bears. But if we break down below the yearly opening price at **8073** and close below that for 2 days in a row, then you’ve got a bear setup starting in oil. But right now, we want to look, and we’ve got a VP indicator, the MA diff cross that is warning of a potential reversal back to the upside. So right now, we’ll keep a very, very close eye on **8073** and the current VP indicators.
Euro versus U.S. Dollar
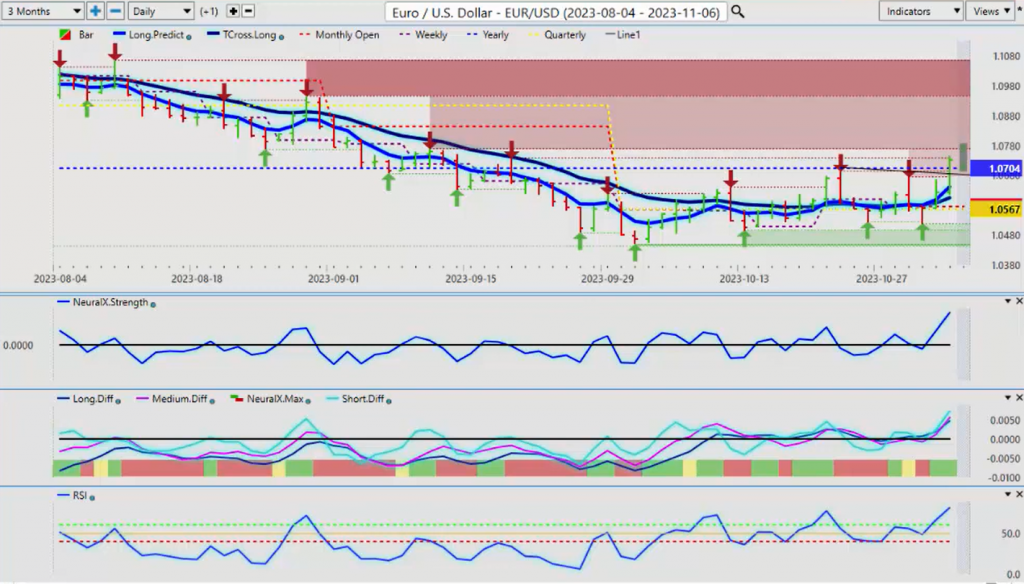
So when we look at the main Forex pair, the **Euro/US Dollar**, if the dollar index goes lower, then the reality is the Euro/US will go higher, regardless of the ECB, the Fed, the CPI, the non-farm payroll, the retail sales. It’s exhausting here, guys. The fact of the matter is, dollar down, Euro up. There’s a **99.8%** inverse correlation between these. So as if the Euro can clear, the Euro has “Closed above its yearly opening price, and it does have a very bullish setup. But again, that yearly opening price, **10704**, keep a very close eye on this level next week. We need to hold above it. You’ll have your Monday-Tuesday reversal by Wednesday-Thursday-Friday of next week. We need to be holding above this, or we’ve got a false break. So again, as long, what I always say, guys, is trade what we see and know your trade. What we see, not what we hear, and know your levels.
So the Euro will remain bullish as long as we’re above our T cross long at **10604**, but we really need to stay above the current yearly opening at **10704**.
U.S. Dollar versus Swiss Franc
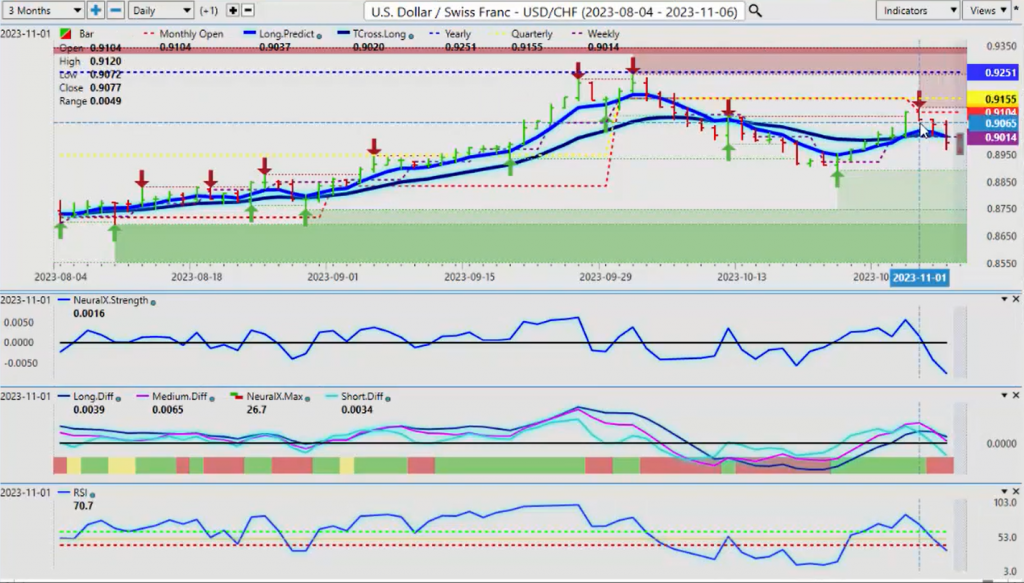
Now the US Swiss Franc, again, immediately responding to that dollar selloff, but this has started right at the beginning of the month, November 1st. We can see the or November the 1st, excuse me, using that monthly opening price and the VP indicators. You can see that immediately the neural index strength was pointing down on the 31st. Then we still, again, we capped out there and then started pointing down on November the 1st, and that led to a substantial move.
But to clarify again, using the current yearly opening price, this was never bullish; it was correcting higher. So that was complete; we’ve corrected higher. Now we’re not making any new highs. So again, it looks like we’ve got room to extend next week, which I would put it at least down into the lower to mid **88** level for again going into next week, and then we’ll reassess where we are from there.
British Pound versus U.S. Dollar
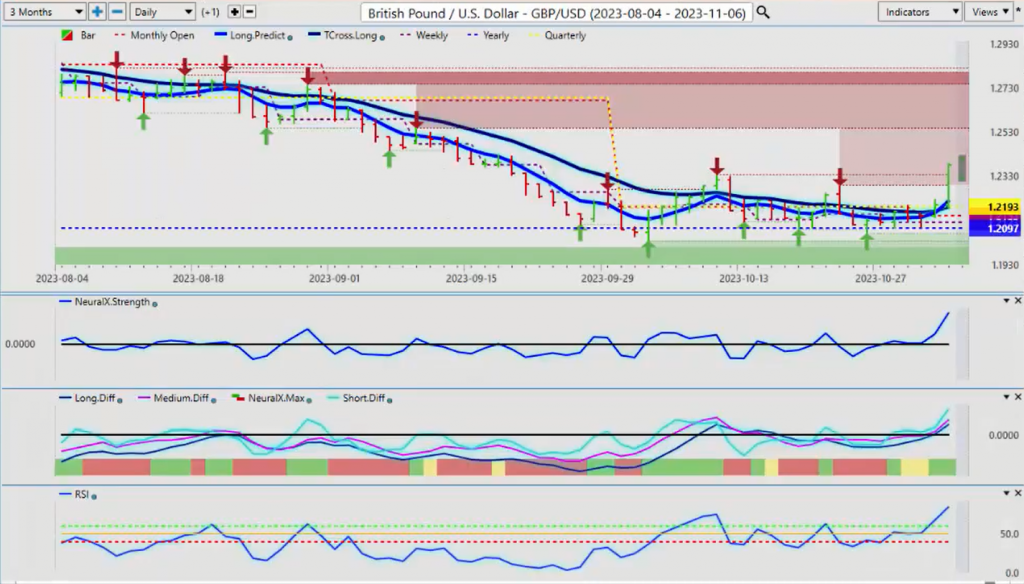
Now the pound-dollar, again, having a decent week once we got the payroll number. But again, I can’t stress this enough, guys, the current yearly opening price, using that as a support level and looking at the VP indicators. As soon as they start to rise, it breaks above the zero line on the predicted differences, the predicted RSI held above the 50 level since October the 30th. Now it’s breaking above, excuse me, the 60 level. The neural index strength is also extending higher. So right now, it looks good for the pound for the British pound going into year-end. But we need to stay above **1297** and above the T cross long at **12168**.
U.S. Dollar versus Japanese Yen
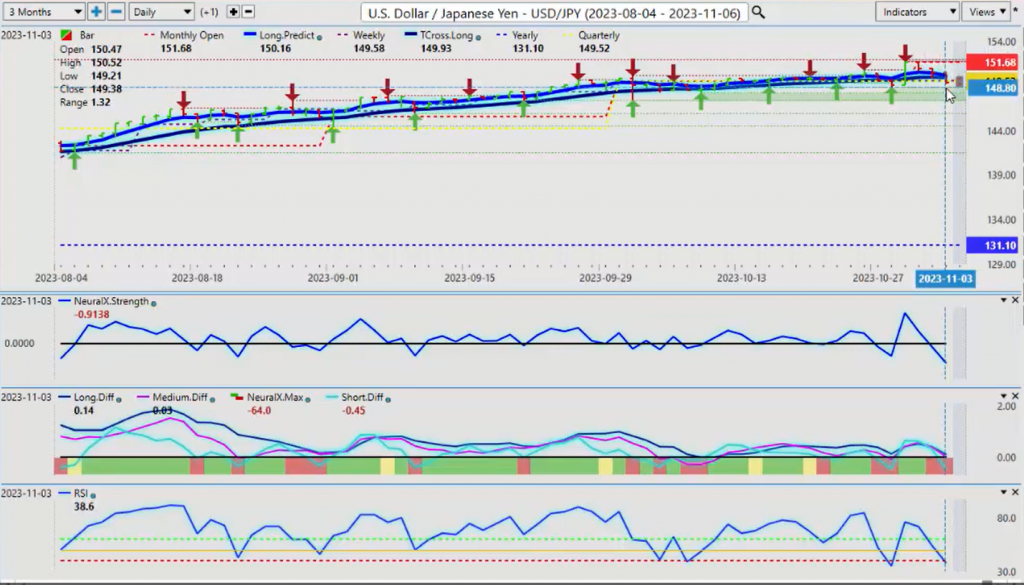
Now the dollar-yen is going to be a very interesting pair over the next several weeks and actually into year-end because in most cases, the dollar doesn’t fare well against most currencies in November and December. But there’s been historically it’s had a significant move. If we look at this from last year, even with the FED hiking rates the way he did, this pair still sold off. There is a strong seasonal pattern with this one. So again, we’ll continue to monitor it, but we are starting to lose some pretty significant levels here.
The quarterly opening is **14952**, that is the level you want to keep a very, very close eye on next week because if we’re holding below this, then that would tell me we’ve got room to extend considerably lower on this particular pair, at least down into the lower **144** area. That may not happen next week, but over the next several weeks, if we’re holding below the quarterly opening price, that’s very likely. The Vantage Point indicators are getting close to pointing to a trending move; they’re just not quite there yet. So keep an eye on that key level.
U.S. Dollar versus Canadian Dollar
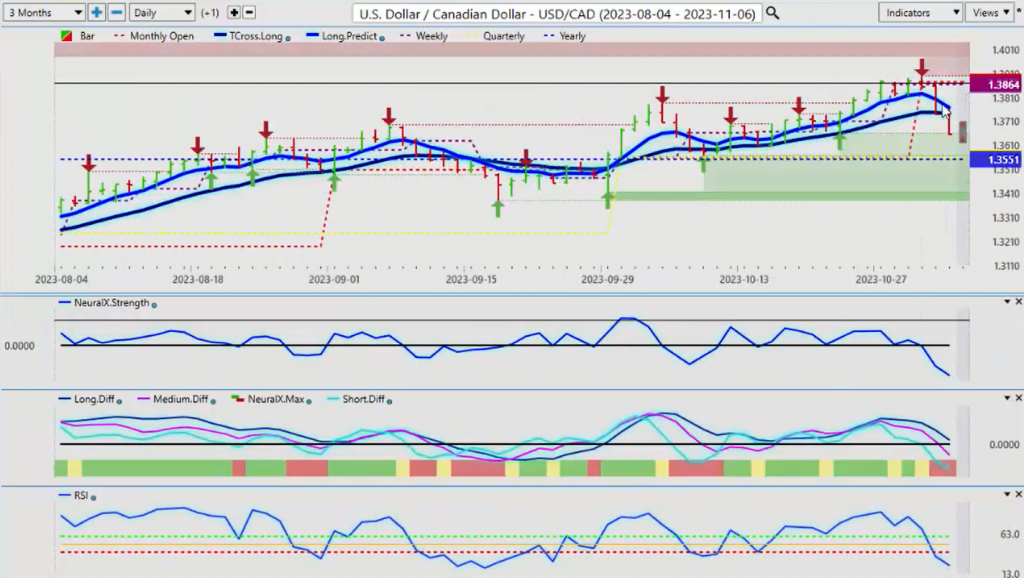
Now, for next week with the US-Canadian pair, once again, when we look at the current monthly opening price **13875**, this is again another excellent example of combining a hard anchor point. Rolling performance will is lagging, it’s misleading, so we’ve got to use proper anchor points. On the month, this is an objective level, not a subject objective level. We’re not guessing at things. If we can’t get above the current monthly opening price, then why are we buying this right? So the Vantage Point indicators, they are in full agreement; we’re going lower. Quite frankly, there’s very little reason at this time to be buying Canadian dollars.
But the direct inverse correlation between the S&P 500 and this pair is huge. So the S&P 500 up, US-Canada down. The same thing with Aussie-US and New Zealand-US. As I’ve talked about repeatedly in these videos, inter-market correlations will trump almost anything other than maybe seasonality, and even that can challenge those.
So right now, our yearly opening price **13551**, we can reassess once we get down to this level, but be very, very cautious down because, again, if oil sinks and stocks soften a bit, then money will come out of the Canadian dollar very, very quickly, is what I can advise.
Australian Dollar versus U.S. Dollar
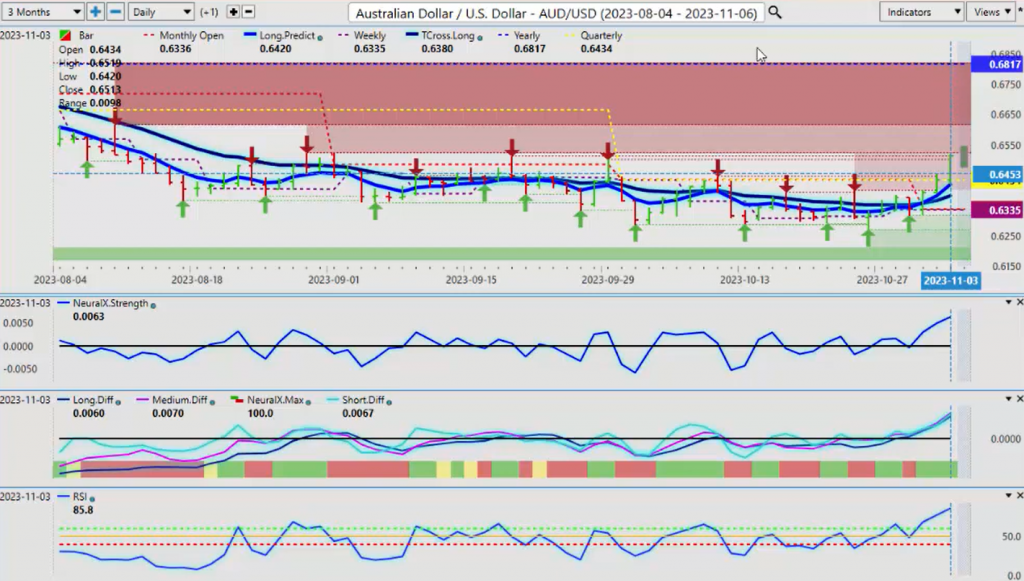
I would say the same thing with New Zealand and Aussie-US. We’ve cleared the quarterly opening, but still very bearish on the year. The yearly opening price **6817**, we’re closing out the week at **6513**. So it looks like we’re going to try and make a run for this, but first, let’s see if we can clear the high of **6522**. If we can get above this verified zone, then it looks good.
New Zealand Dollar versus U.S. Dollar
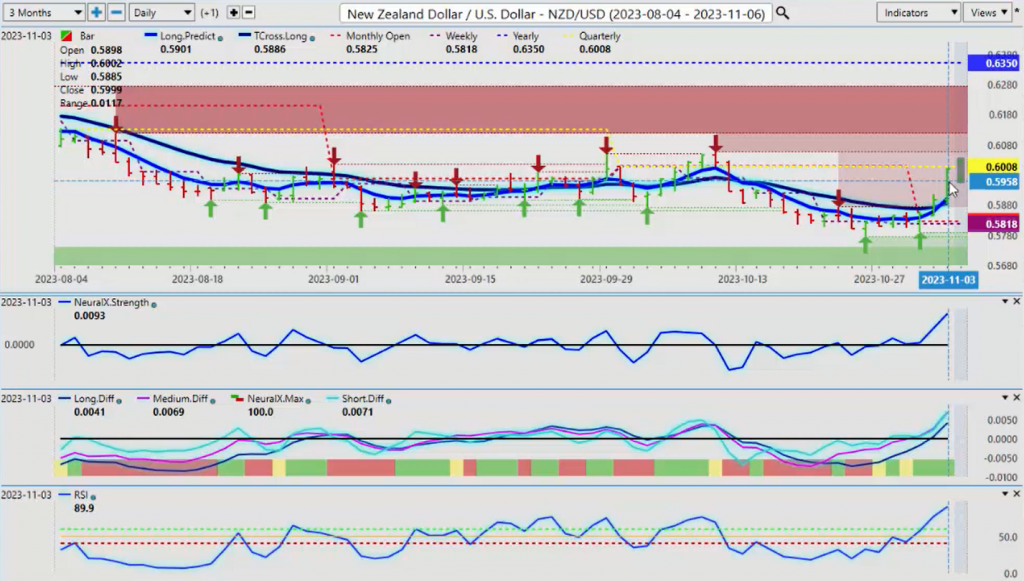
And I would argue the same thing applies to New Zealand, but the Kiwi is a very strong buy signal in the month of November. The seasonal pattern in New Zealand is that people are buying the Kiwi in the month of November. And again, getting out in front of this, using the current monthly opening price, the neural index strength, the predicted differences, but that break of the 60 level on the predicted RSI was really a trigger to get this thing moving. But again, expect, I expect a retracement likely coming back down to the Tross long at **58.86**. And again, we’ll reassess when we get down there, but if we, excuse me, clear the quarterly opening price, this pair could easily extend towards the **6350** level.
So with that said, this is the Vantage Point AI Market Outlook for the week of November 6, 2023.

