Welcome to the Artificial Intelligence Outlook for Forex trading.
VIDEO TRANSCRIPT
Hello everyone, and welcome back. My name is Greg Firman, and this is the VantagePoint AI Market Outlook for the week of October the 16th, 2023.
Now, to get started this week, we’re going to look at the accurate performance values of the different markets, so we have a better idea where we’re currently at.
U.S. Dollar Index
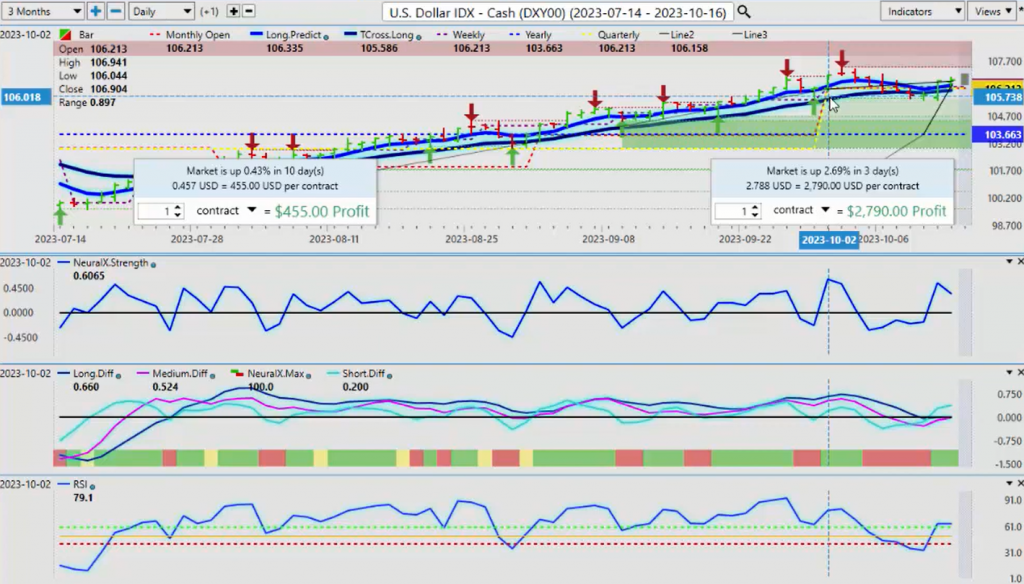
Now, in the month of October, again, when we’re looking at measuring the point in time indicator in VantagePoint measures where we’re at on the week, the month, the year, and the quarter. So as we can see right now, the dollar index is up a mere 2.69% on the entire calendar year at the current time, and in the month of October, we have very little momentum here, 0.43%. That’s all we’re up on the dollar here, guys. Despite everything we hear, they’re saying the dollar’s bullish, the Fed’s hawkish. Well, the charts are not really showing that. And even with this most recent conflict in Israel, it still is not provided much of a boost to the US dollar.
Now, we did come off the CPI number that was slightly hotter this past week, but in my respectful opinion, again, the Fed may be one more and done, and then we’re likely looking at rate cuts into next year. So again, the dollar is at the end of its normal period of strength on a year-over-year basis either way. We take into consideration last year, October the 20th, the dollar had peaked for the entire year, and then it’s basically been selling off since. We’ve not made a new high in the dollar index since October 2022. So again, we want to make sure we’re trading what we see, not what we hear, because, again, most of these very modest gains that the dollar had for the week all came on Thursday and Friday, and that could be argued it’s nothing more than profit-taking. So again, the seasonal pattern in the dollar, usually the dollar has peaked by the end of October, October 20th. You get one small dollar rally at the beginning with that dollar cycle in November, and then that’s usually it for the year. So again, these percentages matter.
When I look at this right now after this rally up, the neural index strength or the neural index is green, but the neural index strength is showing something very, very different. This reverse check mark that I’ve talked about here, we can attribute that to additional peaks in the market here at the beginning of the month. But again, that is not an overly bullish signal. And what I suspect is going to happen is we will see further dollar strength on Monday, and then on Tuesday we reverse. But it’s very important that we have the accurate performance levels. Rolling performance is a lagging indicator, guys, and it can be very, very misleading. When we look at the actual performance, the factual performance of the spies, they are not down 2.88% on the month. They are actually up 1.5% on the year. We’re up 11.84%. So right now, with the spy’s, arguably they are actually bullish while we hold above this quarterly and monthly opening price that’s coming in at 426. We see the same thing with the S&P 500.
In the last 10 days in the current calendar month, the last thing we ever want to do, guys, is take random dates. Five days from today, 30 days from today, we need proper anchor points to determine what the actual performance actually is. So when we look at the S&P 500, we’re actually, again, I would argue long while above 4284, we’re positive on the month. And again, the Israeli-Hamas conflict most suggested that would send the equity markets significantly lower, and the exact opposite happens. So that’s where seasonalities come into play. Intermarket correlations come into play. So yes, the S&P is under selling pressure, but it’s important to use a proper anchor point. Again, we’re up 1.4% on the month. We’re up 12.59% on the year.
So at the current time, this is actually somewhat of a bullish sentiment… has bullish sentiment, excuse me. Until such time, we move below the quarterly opening at 4284, but in the months of October, November, and December, the markets do not favor dollar longs. They do not favor Bitcoin or gold shorts, and they actually do not favor equity shorts. And again, instead of chasing individual stocks, going into the index itself is likely a much safer play. The S&P 500 has never claimed chapter 11 like numerous, like a number of these stocks have done. But this accurate performance model is very important.
Gold
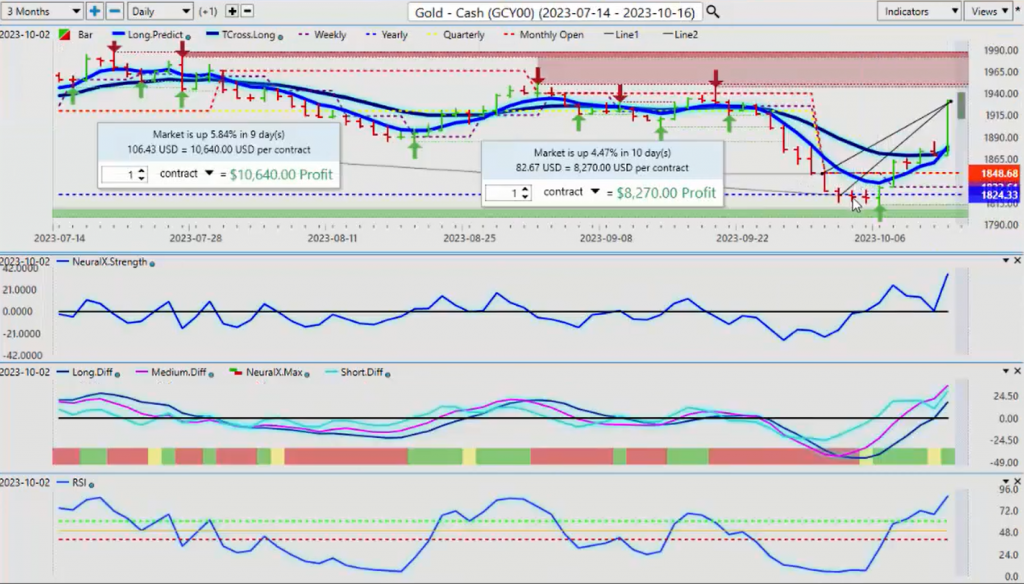
When we look at gold prices, hopefully everybody got on board with this, but what I will point out is that this move and gold started before, not after the Israeli-Hamas conflict. It’s very important that we understand this.
So right now, in the month of October, in the last 10 days, gold is the shining light in these markets, up 4.47%. And as we can see, the argument of the flight to safety into the US dollar is not happening. The money is going into gold. It’s going into the Swiss franc. Some of the other currencies, and we have some money going into the US dollar, but clearly, gold, the catalyst here. When we look at using a proper anchor point, again, guys, we don’t want to take any kind of performance model below year-to-date because it’s lagging. It creates a false signal. We use the yearly opening price as a pivot level to say, “Okay, we need to stay below here,” but as we’re stalling on this yearly opening price that is coming in at about 1839, then we can see the vantage point indicators are stalling on this blue line 1820, excuse me, is the yearly opening price. So when we’re holding there and the VantagePoint MA diff cross, the actual signal to buy gold here, guys, had nothing to do with Israeli-Hamas conflict.
Yes, it’s accelerated the move, but this move was already in progress. The MA diff cross, the neural index strength, a rising momentum that led to where we’re at now. But again, for the last calendar year, or excuse me, we’re up 5.8% on the year, and we’re up 4.47% on the month. I am not, nor was I interested in September. We knew in September gold contracts were going lower. That’s perfectly normal during a period of known US dollar strength. But that’s seasonal in the dollar again, usually ends by mid- to late-October. So we immediately start looking to other markets, oil, gold, Bitcoin. This is the primary basis of intermarket technical analysis, but we must use proper anchor points.
We don’t want to get involved with rolling performance here, guys. One week they’re saying, “You’ve got bullish momentum coming into the market.” The next minute they’re saying, “Equity markets are bearish.” We have to have proper points in time to measure this from. That way we can apply proper stop-losses, but it also provides buying opportunity like we’ve seen here in gold. So again, the catalyst may be now the Israeli-Hamas conflict, but this move was already in progress at the beginning of the month, as mentioned in the previous weekly outlooks.
Light Sweet Crude Oil
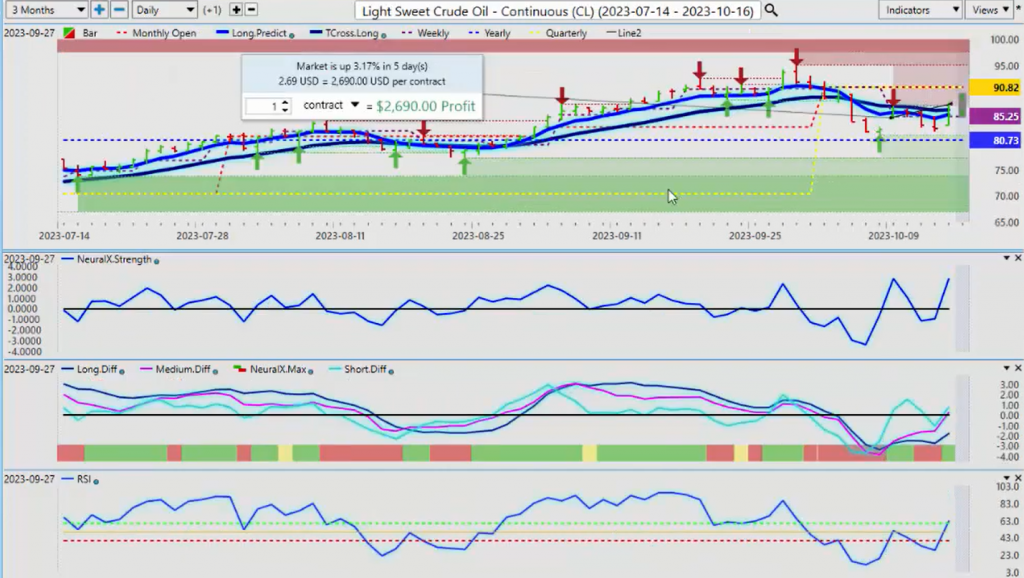
So when we look at light sweet crude oil, again very important that we understand where we currently are. And we’re below the quarterly opening price.
But for now, when we look at this right now from a monthly perspective, 9082, we are still holding below this and below the quarterly opening. But on the week, over the last five days, oil has managed to recoup and is up 3.17%. If we look at it on a year-over-year basis, again, above the yearly opening price confirms that there’s still a bullish bias for oil. Now, the indicators right now are saying there’s more upside potentially here. Predicted differences are rising, but we don’t have a long-term crossover. We only have a medium-term and a short-term cross. So again, there could be some headwinds here, but for now, there’s still that slight bias while we’re above the yearly opening price at 8073.
Bitcoin
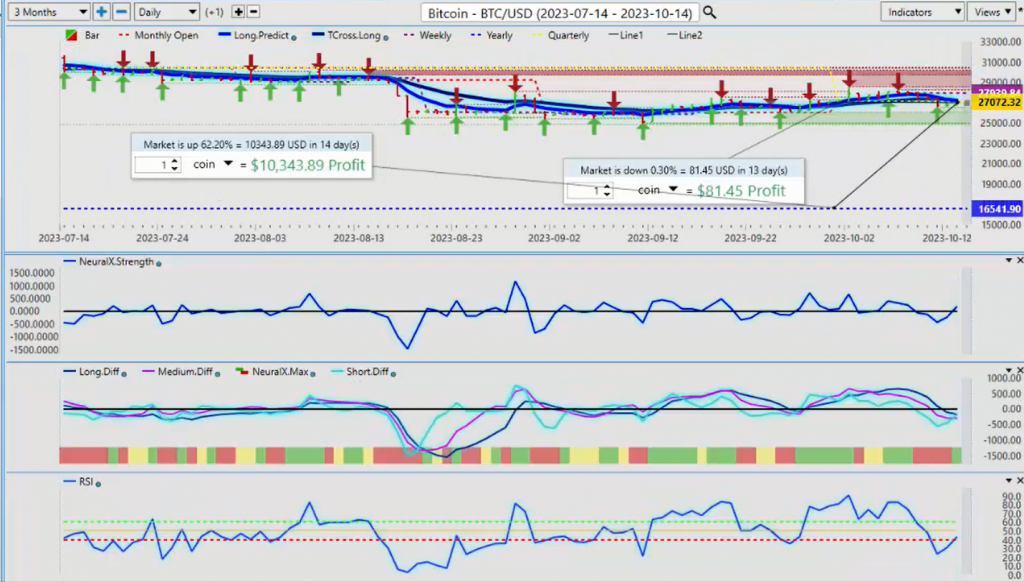
Now, when we look at Bitcoin, once again, they’re attempting to vilify. Bitcoin, yet again, is the problem. Bitcoin is financing terrorism. Oh, boy. Guys, I really… They’re doing everything they can to try and kill this rally in Bitcoin. But here’s the deal, guys, based on fact, not fiction, any calendar year when Bitcoin was down 50% or more, which was last year, it rallied the next three years anywhere from 50% to 100% or more. But the point is that that one down year, again, looking back at the patterns here, and then when we look at the seasonals of Bitcoin, then probably the best value right now out of all of these markets in the month of October is likely Bitcoin.
So I’m watching the indicators very closely in VantagePoint. The neural index strength is suggesting this move lower is not accurate. The reverse check mark on the predicted RSI, we’re losing downward momentum, so watch this one very closely. Again, our quarterly opening here is 27,072. You can see we’re closing very, very close to that, but in my respectful opinion, only I would follow the money, the institutional funds, and they’re usually, excuse me, buying this particular asset class at this time of the month. Now, they don’t necessarily buy it into late November and December, but they have been buying it since 2018 anyway in this particular month. This is exactly what I’m looking for. The market moving lower, and the VantagePoint indicators moving in the opposite direction. So watch this one very, very closely.
U.S. Dollar versus Swiss Franc
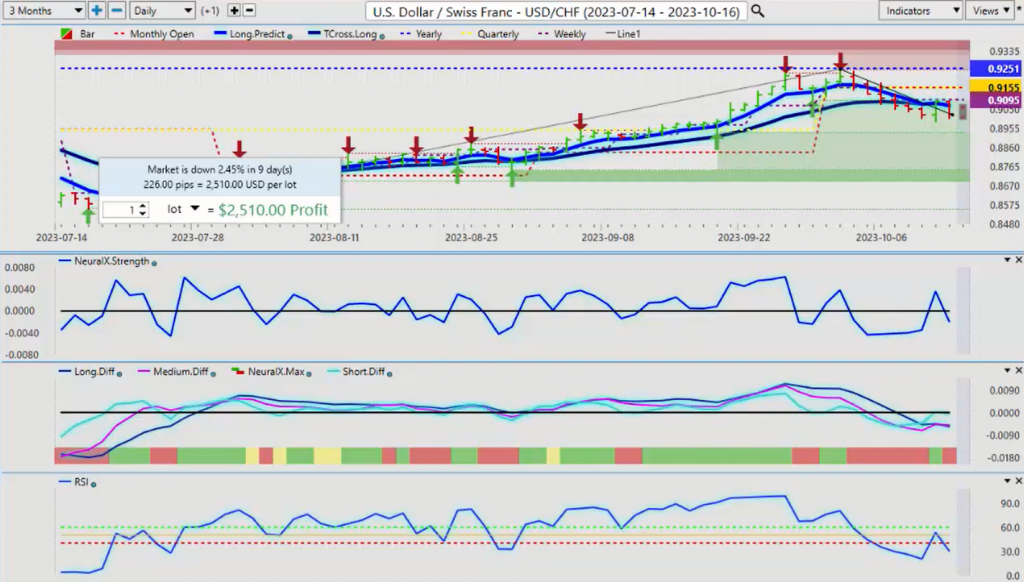
Now, when we talk about the dollar bulls, again, I think I need to point out here, guys, these currency pairs dictate where the flight to safety is really occurring, and it’s not into the US dollar. When we look at the Swiss franc, it’s now down 2.45% on the year. We stopped exactly on the calendar yearly opening price. This is exactly why we want to avoid any type of rolling performance model. It’s lagging, guys. If we went back 365 days, that yearly opening price of 9251 would not be there, and that is a significant problem. So the trader sees bullish momentum and doesn’t see the basic concept of real-time support and resistance using the quarterly opening, the monthly opening, yearly opening price. But the yearly is really a trend-defining tool because, again, it’s hard to make a bullish argument. Even though we’ve rallied up on this, again, the seasonality is in play here. We know the dollar is strong in the month of September. We know gold is weak in the month of September, as I’ve stated in every one of these outlooks.
But I don’t get involved in waves, Fibonacci, all this stuff. I’m using these anchor points to tell me, “Okay, is the market willing to buy this pair above that yearly opening price?” The answer is no, they’re not. And it has fallen significantly out of fair value. And again, this was long before the Israeli-Hamas conflict. So something else is afoot here, and that is why we use these types of anchor points. So the depreciation of the US dollar is really showing in pairs, like the US/Swiss franc. It’s simply unable. They’re not willing to buy the dollar against the Swiss franc, but they are more than willing to buy the Swiss franc, and I still say that this pair is undervalued. It should be much higher, but my opinion doesn’t matter, guys. The market feels otherwise. So that’s what we have to monitor. We have to trade what we see, not what we hear.
So we have failed at that particular level.
British Pound versus U.S. Dollar
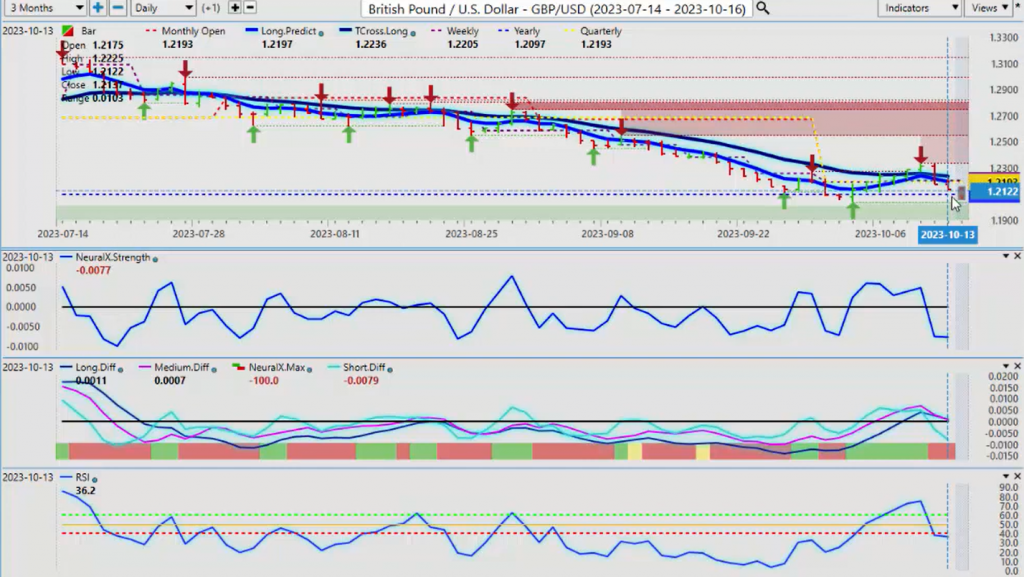
When we look at the pound dollar, we see basically the same thing. We’ve got a lot of buying down here off the yearly opening price, but we’re failing into the VantagePoint T cross long. But any type of settlement in the Israeli-Hamas conflict, which I believe we may be able to get to in a few weeks, depending what happens this weekend with the evacuation, but right now with the pound, again, the yearly opening price here is 1.2097.
If you’re completely disagree and you want to short this, then I would strongly advise to not do that until we have a sustained break of 1.2097. And I suspect we will not get that for any length of time because of the time period we’re in after the US fiscal fourth quarter ends, which is October the first, the dollar usually does not do well into the calendar year. So this is a weekly outlook, guys, not a monthly or a yearly outlook, but I will say that I do not anticipate dollar strength into the calendar year-end. I anticipate dollar weakness regardless of these global geopolitical events. So right now, we can see that again, the neural index strength, while the market moved down heavily on Friday and did cross over the quarterly opening, you can see that the neural index strength is starting to flatten out while the neural index itself is still down.
We look at the predicted RSI. We see something very similar. We’re losing momentum here. So is this just end of the week profit-taking? There’s a very strong possibility because, again, when you look at the bulk of the trading volume on the dollar index last week, the bulk of the trading volume was all to the downside. It was only on Thursday, after the CPI number, did it get a little bump. But again, in my respectful opinion only, that CPI number is, first of all, it’s very similar to using a rolling performance model. CPI is a lagging indicator. So they are likely already going to start talking next week. The talking heads will start to pump up the fact that the Fed is done. And the second they do that, the dollar will lose its steam. But again, it usually does this in October, November anyway.
U.S. Dollar versus Japanese Yen
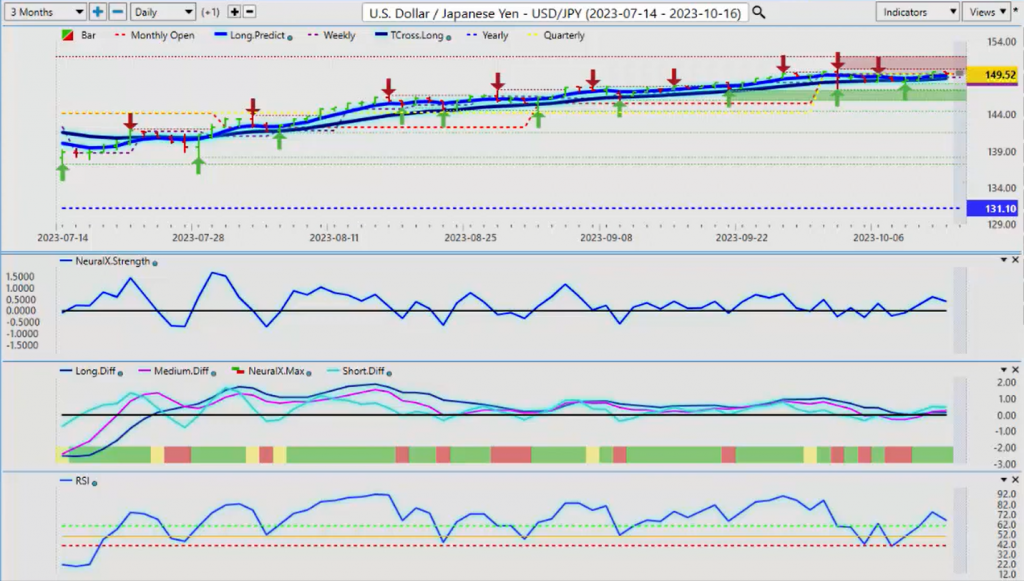
When we look at the dollar/yen, now the dollar/yen is a very interesting pair. And again, this is a weekly outlook, but I will give you a piece of advice with what I’ve seen with these seasonal patterns on the dollar yen in the month of October, November, and December. In most cases, the yen strengthens. The yen could be considered a risk-off currency, but the carry trade is keeping it weak. If the carry trade comes unwound, then this payer could drop very, very fast. When we talk about payers that are undervalued versus overvalued, this pair is grossly overvalued at 149.50. But what I will say and not every calendar year is the same, but there is a lot of similarities in the last five years. The dollar yen does not hold up well at the end of October, and it starts its descent based on that seasonal. And if the Bank of Japan intervenes here, then this could drop very quickly.
As you can see, we have no buyers up here, guys. So what I would… In just a little side note here, watch… As I’ve talked about in the VP live room, the Monday-Tuesday reversal play. If this pair spikes up heavily on Monday, look for a potential short on Tuesday. These indicators are definitely turning sideways. There is not a lot of upside momentum here, and I firmly believe the Fed. Not only is he one more and done at that’s a best-case scenario for interest rate hikes, but I don’t believe he’s got any of this right to this point. The hike should have stopped at two and a half, maybe 3%. But to go over 5%, no, I don’t think so, guys.
I think you’re going to see this thing. Potentially, I could see the Bank of Japan on the hunt in thin liquid markets to strengthen their currency now after they tried to intervene, which caused this mess to begin with. You notice, the general rule of thumb is whenever a central bank gets involved with anything, it just turns into a complete mess, and that’s what’s happened to them here. The Fed went hyperbole with hikes, and the Bank of Japan intervened back in 2022, and that brought us up to where we are. So I think that this is at the top of the mountain here, and it’s just a matter of time before it slips and falls.
U.S. Dollar versus Canadian Dollar
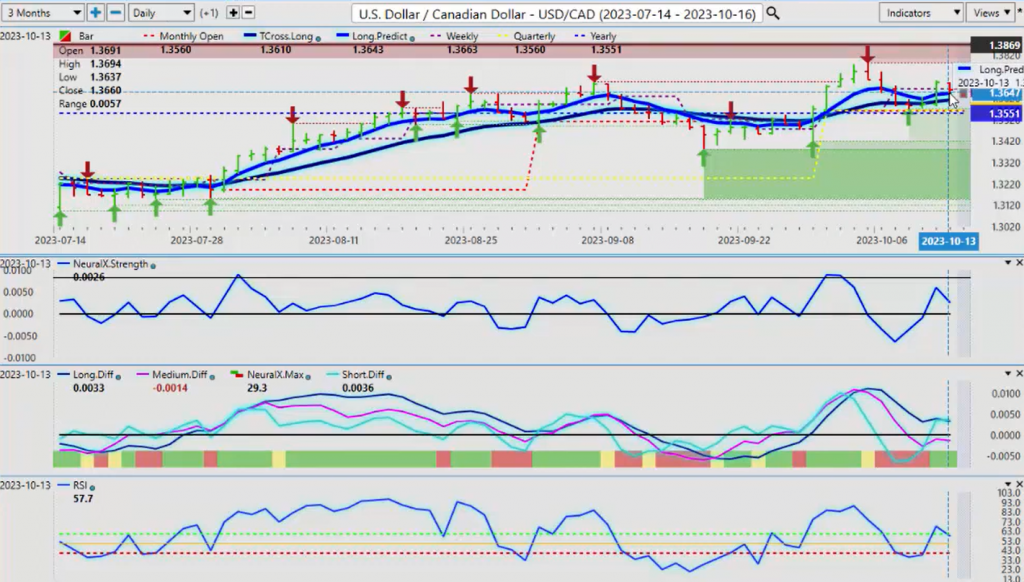
Now, when we look at our three main commodity/equity-based pairs, starting with US/Canada, again, if oil prices continue to climb, I believe we can push lower on this. The wild card with the Aussie, the Kiwi, and the CAD is where do we go with these equity markets. If the equity markets stabilize and start moving higher and we get into a bit of a risk on environment, then there could be some very good buying opportunities on these particular currencies.
So right now, the Canadian dollar, again, we have a reverse check mark on that predicted neural index strength. While the neural index is up, the neural index strength is saying something very, very different here. We are above the yearly opening price, absolutely. We just managed to get above the yearly opening price on Thursday and Friday. But you’ll notice that we didn’t have a lot of momentum on the Friday, and I believe that this spike. And as I’ve discussed in the VantagePoint, again in the VantagePoint live training room is that I never buy a bar, a big spike in a bar, because, again, I don’t think they really look close enough at that CPI number. And regardless, it’s a lagging number. That’s the previous month. That’s not this month. So again, this can completely change, which I believe it will. And I still don’t see the kind of inflation that the Fed does, to be perfectly blunt, because of COVID.
So right now, the high 1.3701, I believe it will be very difficult for this payer to pass that level and hold above that level. And either way, the next verified resistance high that’s coming in around 1.3786. I would absolutely target this area for shorts because I believe that oil could go higher. But more specifically, I think there’s still an equity play going into year-end.
Australian Dollar versus U.S. Dollar
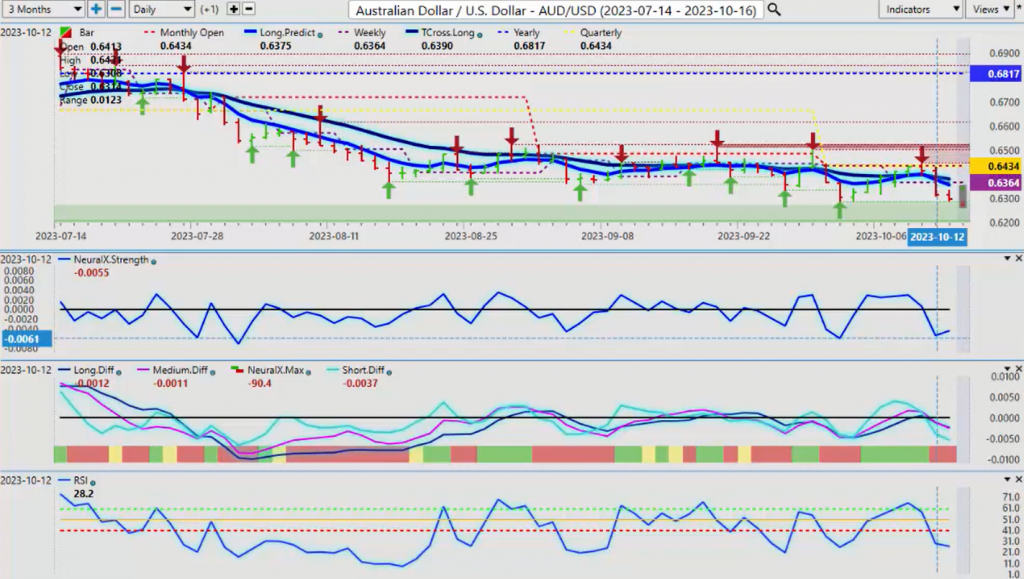
When we look at the Aussie dollar, basically the exact same trade just inversed to US/Canada. So right now we’ve got a very strong verified support low that’s coming in at or about the .6286 mark. We’ll watch this one this coming week. But again, you can see the neural index strength is turning the other way as the market drops on that CPI number, and there’s a minor follow-through on this pair on Friday. The neural index strength is not buying into it. So again, be careful with Monday trade. I would anticipate dollar strength out of the gate, but I don’t anticipate the dollar will hold those gains into Tuesday, Wednesday, Thursday of next week. That’s what you want to keep your eye out on. The indicators from VantagePoint are actually indirectly supporting what I just said.
New Zealand Dollar versus U.S. Dollar
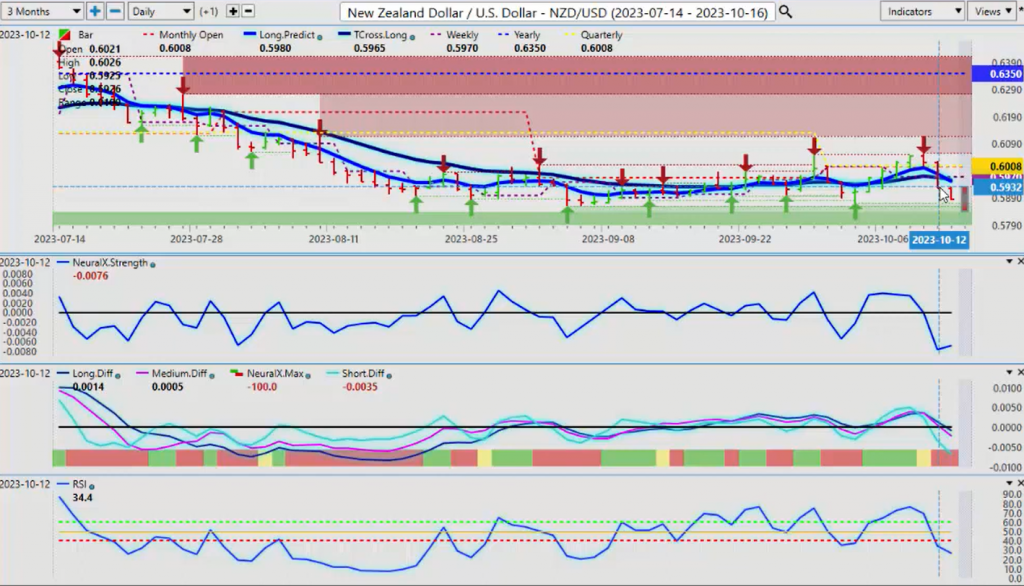
The Kiwi, we see the exact same thing. That reverse check mark, we’ve got the predicted moving averages have crossed, but the neural index strength is not in agreement with these. And I believe that they’ve been influenced, again, by a highly questionable CPI number. The PPI number, okay, I’ll give you that one. It’s slightly hotter, but these are not numbers that require rate hikes, guys. When we look at the… And this is why I believe that ultimately gold has to go higher because a recession is pending, and I could argue that we’re in a recession now.
Inverted yield curve, all the economic indicators are showing contraction. In most cases, gold rises in that scenario. So again, these are fundamentals we have to look at. But we always have to challenge this current media because a lot of the things, again, this most recent attack on Bitcoin, you got to laugh at that a little bit here, guys, because they’re saying that now Bitcoin is the currency that’s being used to fund terrorism. Well, I don’t think when one of the fiscal US governments dropped a skid of money off to Iran, I don’t think it was in Bitcoin. I believe it was in US dollars. And I won’t say who that was, but that did happen. So again, does that mean the US dollar is a terrorist-funded currency? I don’t think it does, guys. So again, be careful what you’re buying into with this particular media trade, what we see, not what we hear.
So what that said, this is the VantagePoint AI Market Outlook for the week of October the 16th, 2023.