Welcome to the Artificial Intelligence Outlook for Forex trading.
VIDEO TRANSCRIPT
VantagePoint AI Market Outlook – September 15, 2025
Okay, hello everyone, and welcome back.
My name is Greg Firman and this is the VantagePoint AI market outlook for the week of September the 15th, 2025.
Now, to get started this week, we will again revisit different ways of looking at the Dollar Index for the forex traders, and for commodity and equity traders alike, based around the correlations.
UUP WisdomTree Bloomberg U.S. Dollar Bull Fund
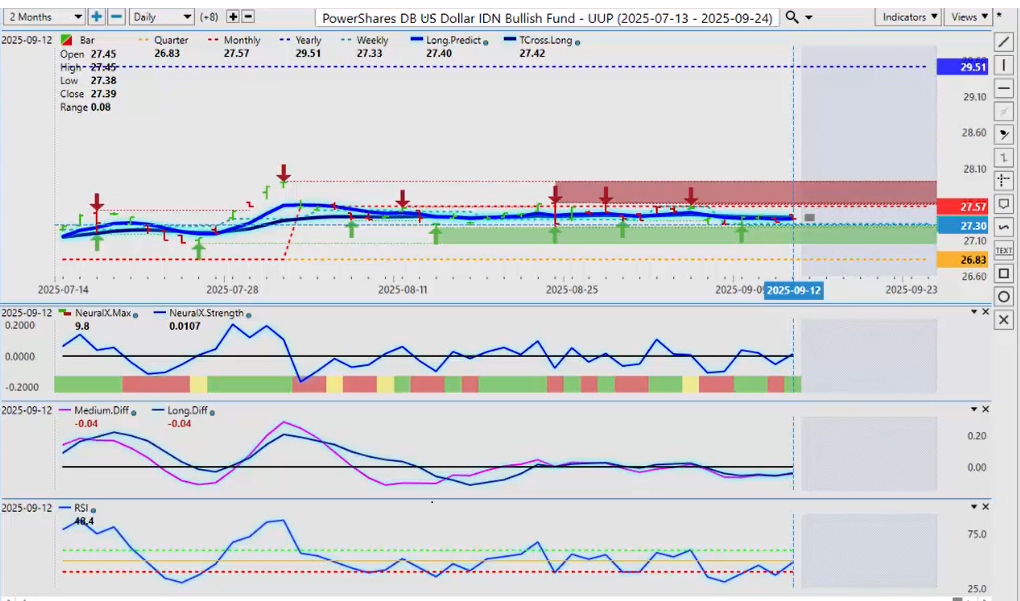
What I’m seeing is using the UUP against the WisdomTree Bloomberg U.S. Dollar Bull Fund. And there are very specific differences between these.
Now, we’ve had a series of false breaks on the Dollar Index with the UUP. If I look at the predicted RSI, I continue to see a very different signal between these two dollar bull funds.
Now, we’re coming into a very, very high volatility week. Everybody is waiting to see what the Fed is going to do. That is going to dictate trade no matter what.
But for now, we can see that on the UUP, on the predicted RSI with a 60/40 split, it was showing some kind of momentum, but very quickly it recovered and moved back up inside the range of the 60/40 split.
We don’t want to be looking at overbought and oversold. We want to be looking for momentum-based trades because that’s the kind of market we’re in.
So when we look at that, we are dead flat, sitting waiting for the Fed, slightly above or below the T Cross Long at 27.42.
Now, when we look at the WisdomTree Bloomberg U.S. Dollar Bull Fund, you can see that the predicted RSI has never broken down below the 40 level, saying that there is no downward momentum. Now it’s recovering. The Neural Index is starting to point back up.
We remain below the monthly opening price and the T Cross Long. But what I will point out again is we have remained positive on that quarterly opening price at 25.77.
So we can’t very well say that the dollar is super bearish or very bearish, whichever wording you want to use, when in actual fact it’s been positive for the entire third quarter, which is actually the U.S. fiscal fourth-quarter year end. Which I’ve stated many times—in most cases the dollar remains firm.
Now, the Fed could completely blow this apart on Wednesday, but this is currently where we’re at: nobody is taking a big bet on either side of the dollar yet. And this is the advantage of looking at some of the ETFs.
So again, we remain neutral ahead of the Fed.
Gold
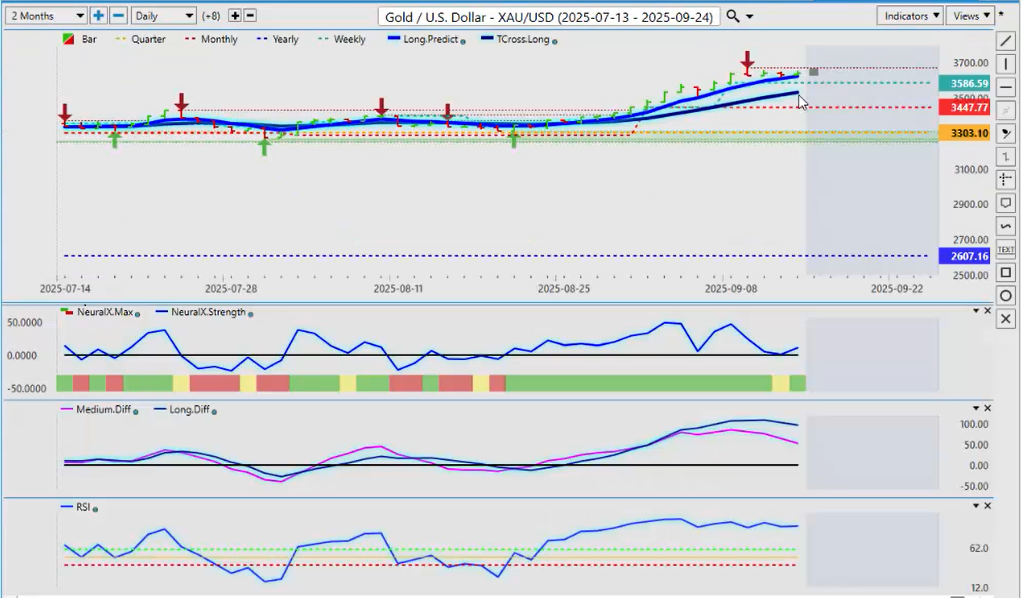
Now, Gold is stalled to some degree. We have a new verified resistance high that’s coming in at 3,673.
I believe it will be very difficult for this level to be breached prior to the Fed, unless something is leaked. But for now, you can see that the buyers are taking a rest here.
We’ve got an MA Diff Cross—the pink line below the blue line—saying that basically the medium-term trend is weakening against the longer-term uptrend. So a very, very powerful contrarian signal.
But once again, it will be fully dependent on the Fed.
Structurally speaking, when we look at Gold, our yearly opening price 2,607.30—Gold has remained positive on the quarter. We’re above the monthly opening and the T Cross Long.
Respectfully, I think we will see a retracement at the very minimum this coming week back to the T Cross Long, potentially around that 3,530 area.
We just have to break down below the Long Predicted at 3,662.30 to get it moving.
In my respectful opinion, my view is that the Fed is going to disappoint the market. It’s very unlikely he’s going to go 50 basis points and make the mistake he made last year.
So I think he’s going to go 25 basis points, and then it’s going to be a wait-and-see, and maybe hint towards a couple of other 25 basis points.
But I really don’t think he will make the same mistake twice and cut 50 basis points. But again, I’m speculating.
SPY (S&P 500 ETF)
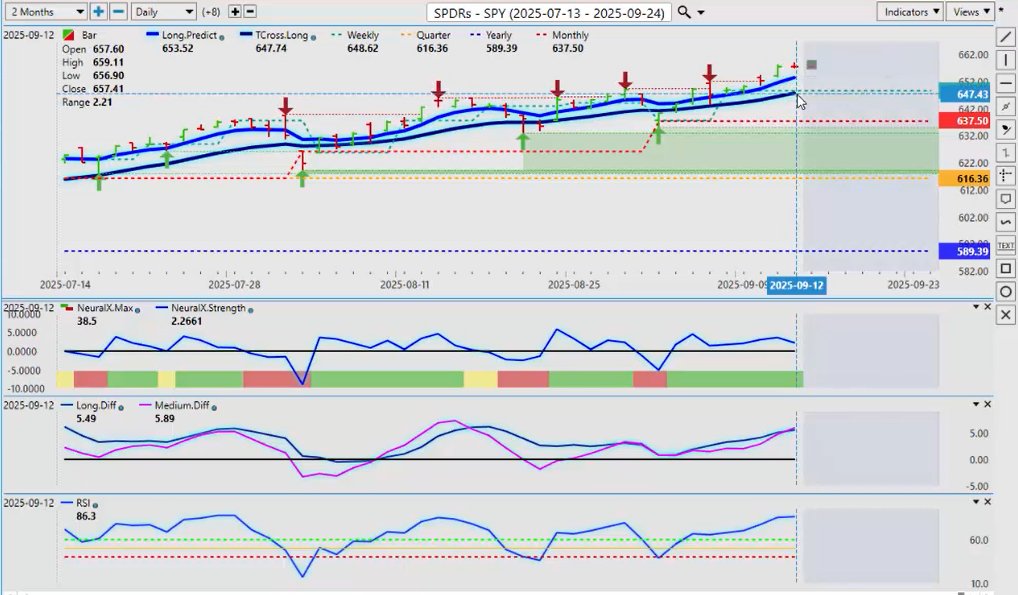
That’s where we’re at with Gold. When we look at the SPY going into next week, I believe they are at a substantial risk for a sell-off if the Fed does what I just suggested he is likely going to do.
Because again, he doesn’t want to be criticized. He’s just going to say: “Nope, data dependent. 25 basis points. We’re going to see where this goes.”
That would likely trigger a sell-off in the equity markets across the board.
So if that happens, then the T Cross Long 647.74—that’s the area you want to keep your eye on.
The predicted RSI again sitting at 86.3. The MA Diff Cross though is warning that there’s still a little bit of strength here.
So it will be very interesting to see in the press conference what Powell is going to do here. But everybody is hanging on his every word.
So again, a retracement is extremely likely back down to that T Cross Long.
Oil vs. Natural Gas
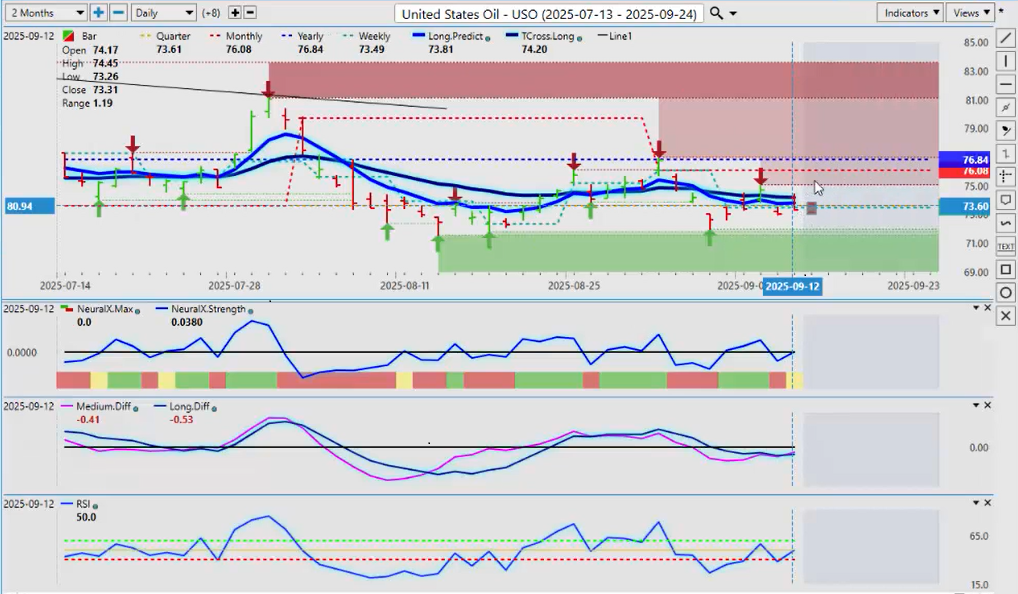
Now, Oil contracts for next week—a little bit of a rebound, but more of a dead cat bounce in my respectful opinion.
The yearly opening price is sitting at 76.84. The monthly opening price 76.08.
At this time of year—towards the end of September—I look more towards the Natural Gas contracts than Oil.
I think Oil’s been a pretty good trade this year. Not the best trade, but good following the seasonal patterns.
I now firmly believe that most of the money will start moving over towards Natural Gas into the heating season. But we are looking at a heat wave next week, at least in Canada.
So I don’t think Natural Gas is going to take off next week. But buying on a dip is a preferred strategy versus Oil at this particular time of year.
There is a little bit of momentum here. We’ve got an MA Diff Cross. But I believe that to be corrective in nature, likely back up into the monthly and yearly opening price.
But in order for it to get bullish, we have to clear 76.84, which is extremely unlikely at this time of year.
Volatility Index ($VIXY) Proshares VIX short Term Futures ETF
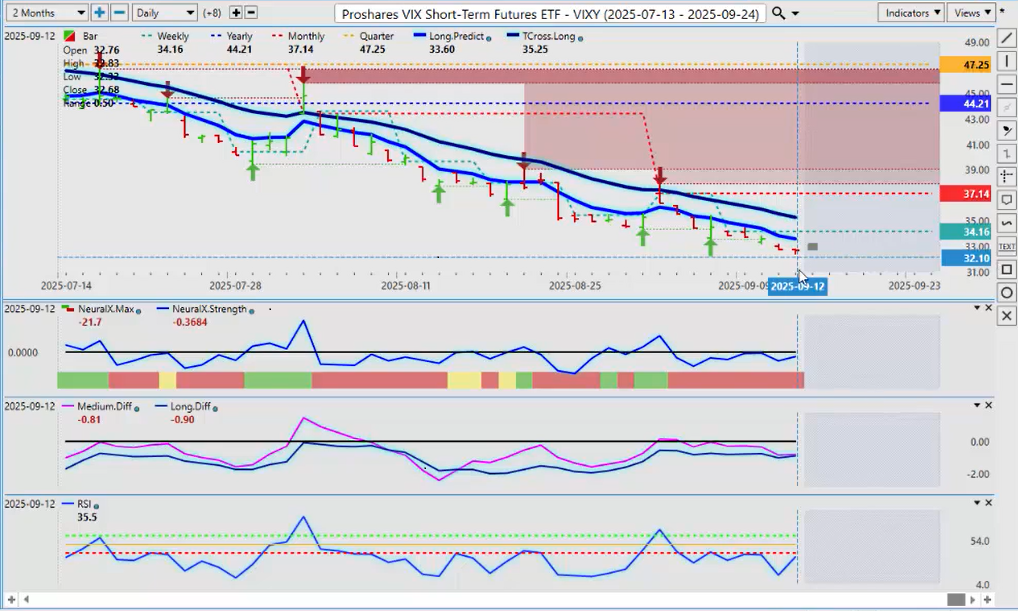
Now, when we look at the equity markets as a whole using the VIX, do we have any kind of sign of life here that the VIX could turn higher?
I would argue that reverse check mark right here on the predicted RSI—the pink line here is above the blue line—means the medium-term strength is starting. It’s starting to show something here in the software very early.
So, have we got a bottom in the VIX yet? No. But I think it’s entirely likely we will have a bottom on it by Tuesday or Wednesday.
So keep an eye on the VIX if you’re trading equity markets heavily, individual stocks, stock futures. Keep a very close eye to see if this signal starts to develop by midweek.
DAX ETF
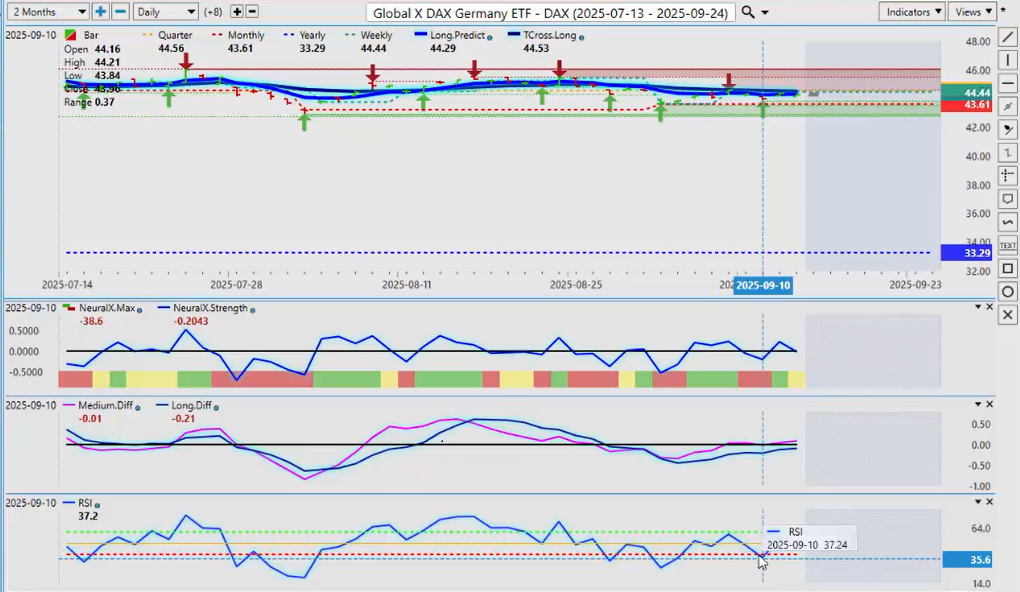
Now, when I look at the German equity markets, the DAX ETF specifically, it is holding along its monthly opening price.
We do have a fresh crossover. The pink line has gone over the zero line. Once again, a failure at that 40 level, saying there’s no downward momentum.
But again, if the Fed does what I think he will—if I’m correct—then the DAX, like the S&P, the NASDAQ, they’ll all come under selling pressure.
So, be careful with this one next week. But the monthly opening price 43.61—that is the area you want to keep your eye on very, very closely going into next week.
Bitcoin
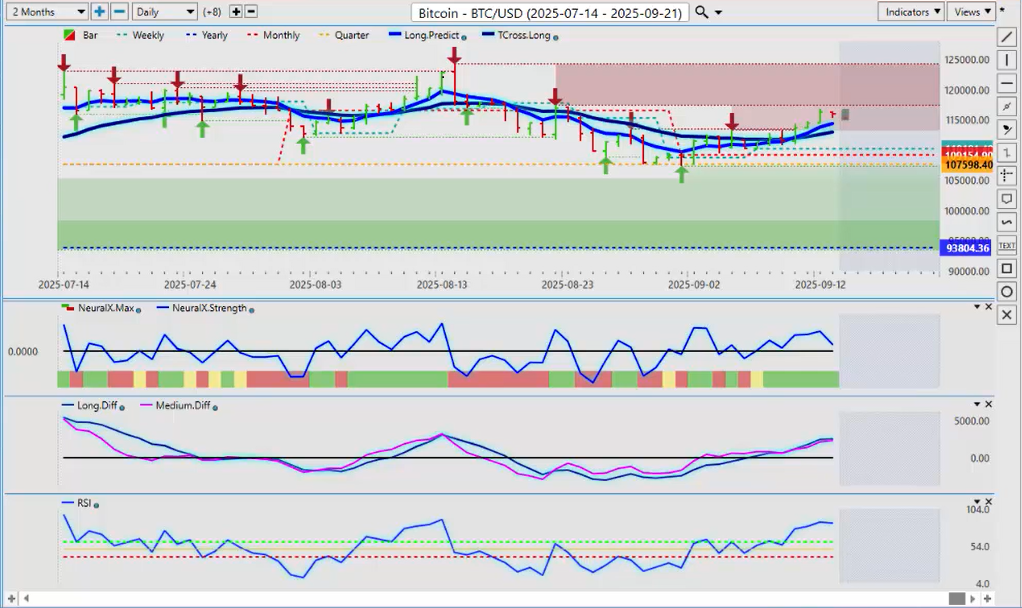
Now, Bitcoin—again, a lot of chatter about this one. Bitcoin going to 200,000.
What I can tell you, based on my experience, is that Bitcoin runs a three-year cycle: three years up, one year down.
We are in the third year of a three-year rally. So in order for Bitcoin, the rumors—the word on the street, if you will—that Bitcoin’s going to 200,000? Well guys, first we have to clear the high of 124,198.
I believe that’s possible. But again, I also question whether that’s it for this year on Bitcoin.
In most cases, Bitcoin is a very strong buy at the end of September going into October. And then we potentially should be prepared for as much as a 40–50% drop next year.
Then we start the whole three-year cycle all over again, guys.
So, we’ll see if Bitcoin follows its normal pattern.
But as soon as the media starts releasing things saying “Bitcoin to 200,000,” I immediately start looking at the other side of that. Because why would the media do anything to help us, right?
For now, Bitcoin is holding in there. Our key levels again—the quarterly opening at 107,598. Keep a very close eye on that particular area.
I’ll remind everybody that the quarterly opening price will reset on October 1, and it will be very interesting to see where Bitcoin is at that particular time.
EUR/USD and G7 Currencies
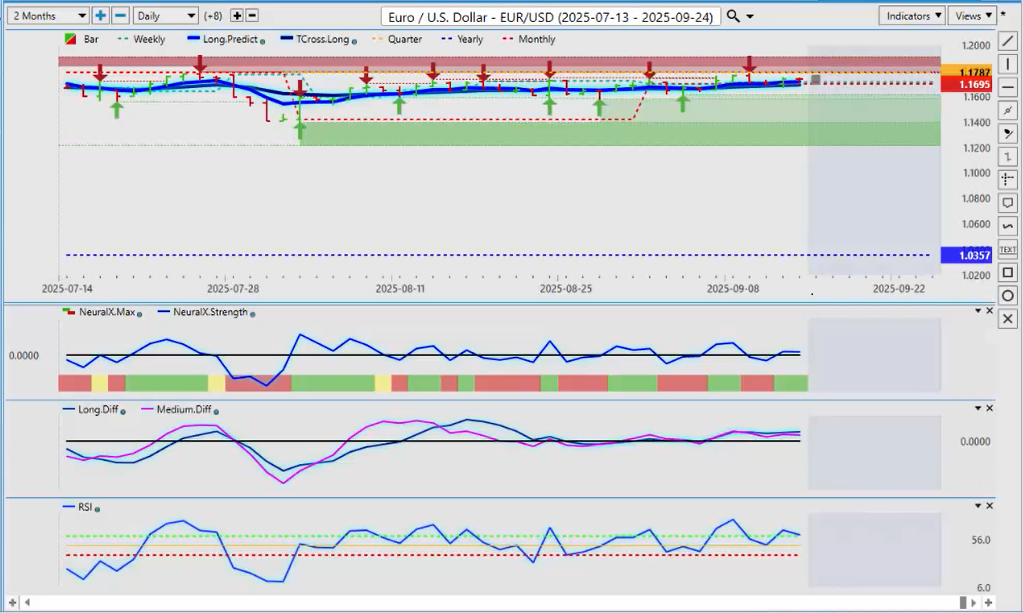
Most of, if not all of, your G7 pairs are going to be reacting to the Fed this week. So it’s a little bit redundant to go through all of them.
For this particular week, I believe that most eyes will be on EUR/USD.
When I look at the Euro right now, once again, we don’t have any momentum to the upside or downside.
But when we look at the VP predicted differences—two of the most powerful indicators in the software—the pink line represents the strength of the medium-term trend, and that is sitting below the blue line.
That in itself can be a warning sign that this Fed is not going to do what the media is telling us.
So again, this week is 100% data-dependent on what the Fed is going to do.
I do think there’s a high probability we are going to be disappointed.
But again, I’ve seen this movie before. He was heavily criticized for cutting 50 basis points in September of 2024. And all that did was delay the dollar rally to October, November.
And again, last year, October and November were actually pretty decent months for the dollar, because the Fed had to come back out and say, “Well, wait a minute. The data is not really supporting what I just did here.”
So we’ll keep an eye on that.
U.S. Dollar versus Canadian Dollar ($USD/CAD)
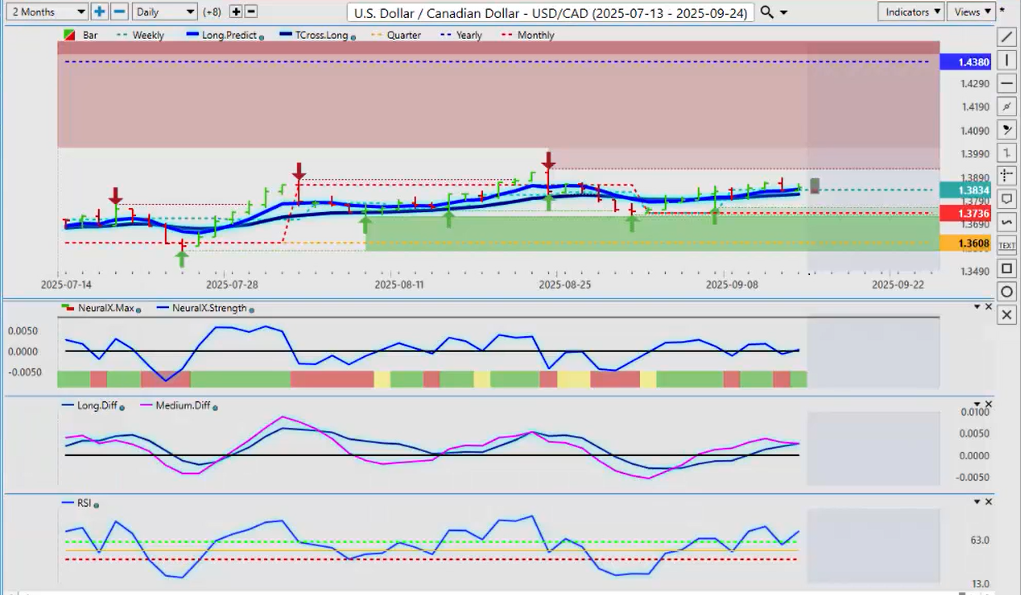
When we look at the USD/CAD pair, that’s another central bank announcement this week.
Respecting the fact that I am domiciled in Canada—I believe that the Bank of Canada is going to cut, or at least talk about cuts, maybe multiple cuts, to get the economy going.
There is no trade deal with the U.S. right now. And there doesn’t appear to be one on the horizon.
You’ve got falling Oil prices, potentially following equity markets. None of that supports the Canadian dollar.
The only thing that could save the Canadian dollar at this point would be for Governor Tiff Macklem to not cut, and say, “We’re going to wait and see.” That the Canadian dollar could benefit from.
So, these two currencies here—the Euro, the USD, and the CAD—will definitely be in the spotlight next week.
U.S. Dollar versus Swiss Franc ($USD/CHF)
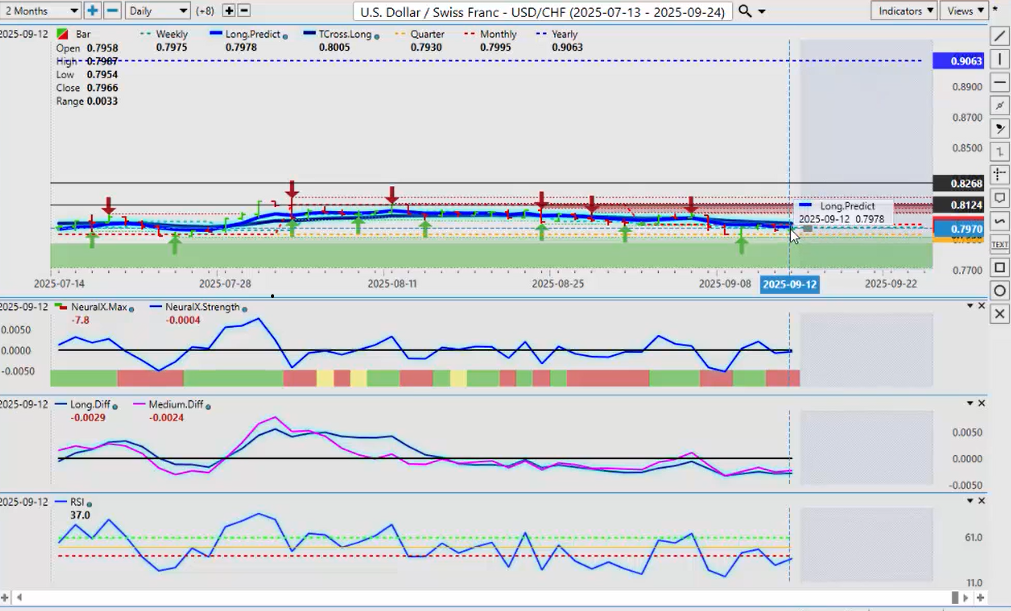
Of the trend this past week, USD/CHF is another one you want to keep an eye on.
USD/CHF mirrors the Dollar Index, and it too is holding above its quarterly opening price at 0.7930.
So again, when we look at most of the currency pairs, the dollar is still holding its ground against a number of them, meaning above or below that quarterly opening.
So when I look at the USD/CHF, well, that could be a very strong buy next week, guys. But again, it’s dependent on what we get from the Fed.
Australian Dollar versus U.S. Dollar ($AUD/USD)
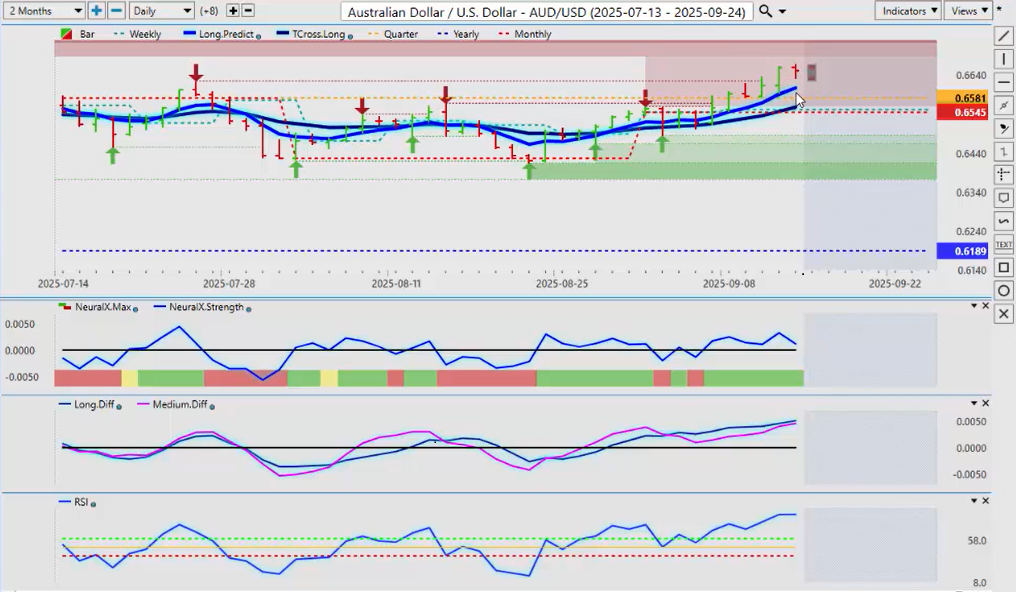
Now, the currency that did make a break this previous week was the AUD/USD.
The quarterly opening price there is now coming in at 0.6581.
But in my respectful opinion, I think it will be very difficult for the Aussie to advance without the help of the Fed cutting 50 basis points, or cutting 25 and giving a very dovish outlook for the U.S. economy—which I don’t think the data currently supports.
So I don’t believe he will say that.
Again, you could be looking at a substantial pullback potentially on the Aussie. But this past quarter, the third quarter, the Aussie is one of the few that’s been able to break through against the dollar.
U.S. Dollar versus Japanese Yen ($USD/JPY)
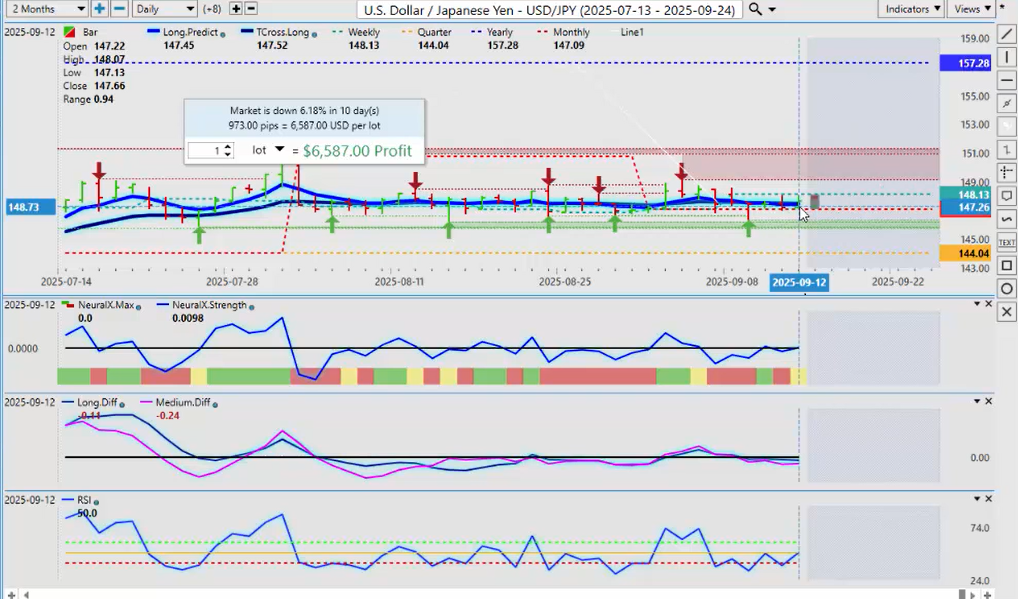
Again, I would also keep a very close eye on the USD/JPY, because I believe the Bank of Japan is going to be on the prowl next week, potentially talking about hiking rates to offset further dollar strength against the yen.
At the end of the week, we’ve parked right on the current monthly opening price.
The entire concept, guys, of using hard anchor points like the monthly, the quarterly, the yearly opening, and even each week if you apply the weekly opening price—you are going to see an immediate difference in your trading and investing.
Because you’re not moving the goalposts.
When we hear things like “the last 30 days,” “the last 60 days,” “the last 90 days,” you’re constantly moving the goalpost.
When we look at seasonal patterns, we want to look at them quarter-to-quarter, month-to-month. I don’t want to co-mingle months when I’m doing that.
So again, we’re holding above 144.04. But even if the Fed gives us a hawkish reading, I think the Bank of Japan is going to have something to say about this.
So be careful with this pair next week.
Again, I will do a limited number of FX pairs this week because they’re all tied to the Fed in one way or the other.
So the volatility will likely bring profit-taking on a number of different markets: Gold, equities, dollar shorts—probably by mid to late day Tuesday.
I expect a very choppy, volatile start to the week. But with that, there still is likely to be some very good opportunity going forward.
So with that said, this is the VantagePoint AI Market Outlook for the week of September the 15th, 2025.