


Welcome to the Artificial Intelligence Outlook for Forex trading.
VIDEO TRANSCRIPT
U.S. Dollar Index ($UUP / USDU)
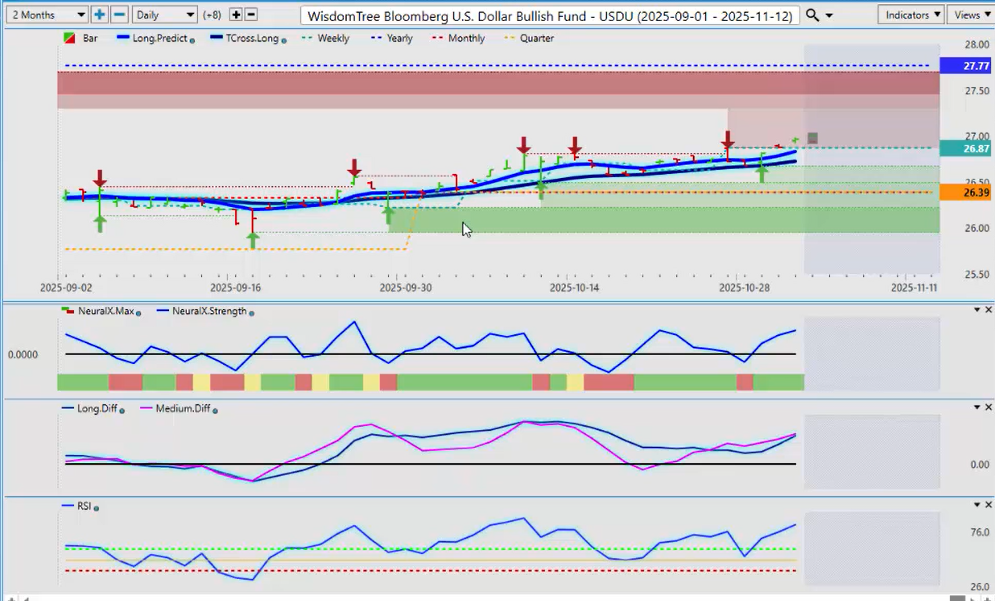
Okay, hello everyone, and welcome back. My name is Greg Ferman, and this is the Vantage Point AI market outlook for the week of November the 3rd, 2025. Now, to get started this week, we’ll begin with that US dollar bull fund. We’ll have a quick look at the UUP and the USDU, both have slightly different signals. Now, when we look at the USDU, which does a very different calculation on the strength of the US dollar, we can assess here that we have another medium-term crossover back to the… another MA diff cross, excuse me, back to the upside, after being unable to break down below the 50 level on the predicted RSI. Our neural index strength is pointing up. Our medium-term predicted difference is above our long-term predicted difference, and again, we remain above the quarterly opening price, and more specifically, the Tross long at 26.72.
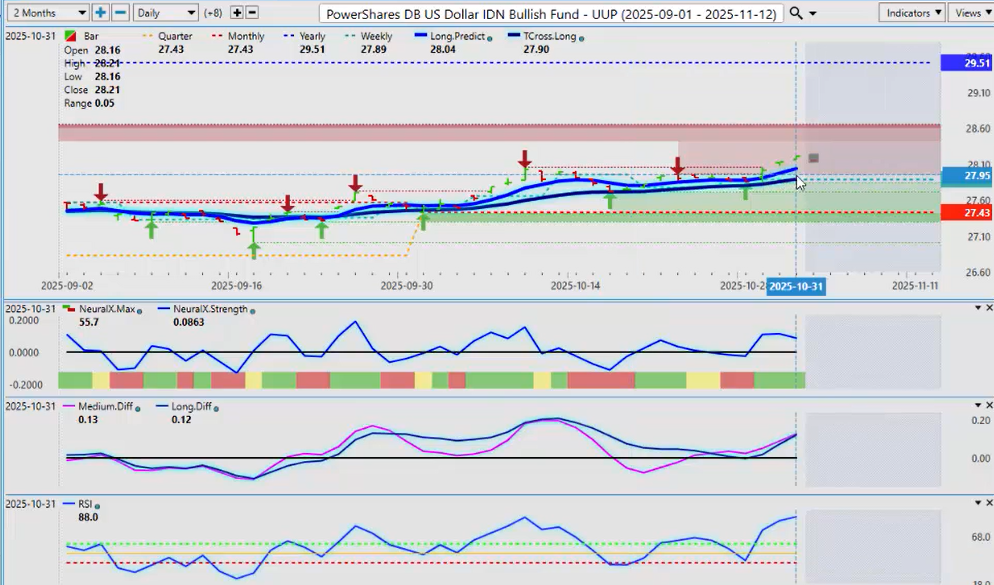
Now, with the UUP, slightly different signal here. We can see we’ve had a number of false breaks below the 40 level on the predicted RSI, but now it, too, is recovering, and the position of the strength of the medium-term crossover versus the long remains bullish. So again, I will point out the primary trend on the year. We have been below the calendar yearly opening price for a… considerably, for basically the entire calendar year. But right now, with the Fed changing his rhetoric to more of a hawkish rate cut than a dovish one, that has the market questioning whether the Fed is going to continue to cut, where on Monday the media had basically already told us that there was absolutely guaranteed three more rate cuts this year, when in actual fact there was nothing to support that. The Fed made no such comments. But he was clear on Wednesday that the economy is moving along well, and he’s not in a rush to cut. So that leaves the dollar at the mercy of the market. From a strength standpoint, the fundamentals, the technicals are supporting the dollar.
Now, on top of all that, all these many years that I’ve been doing this weekly AI weekly outlook, I’ve always talked about that strength in the US dollar at the beginning of the month, and then it dissipates after the non-farm payroll number. So again, not sure if we’re going to be getting any kind of payroll number this coming Friday, but it is the week of the payroll number, and the dollar is usually strong until the Tuesday after that. So potentially the perfect storm of dollar strength. But again, the fundamentals can change very, very quickly here, guys.
S&P 500 Index
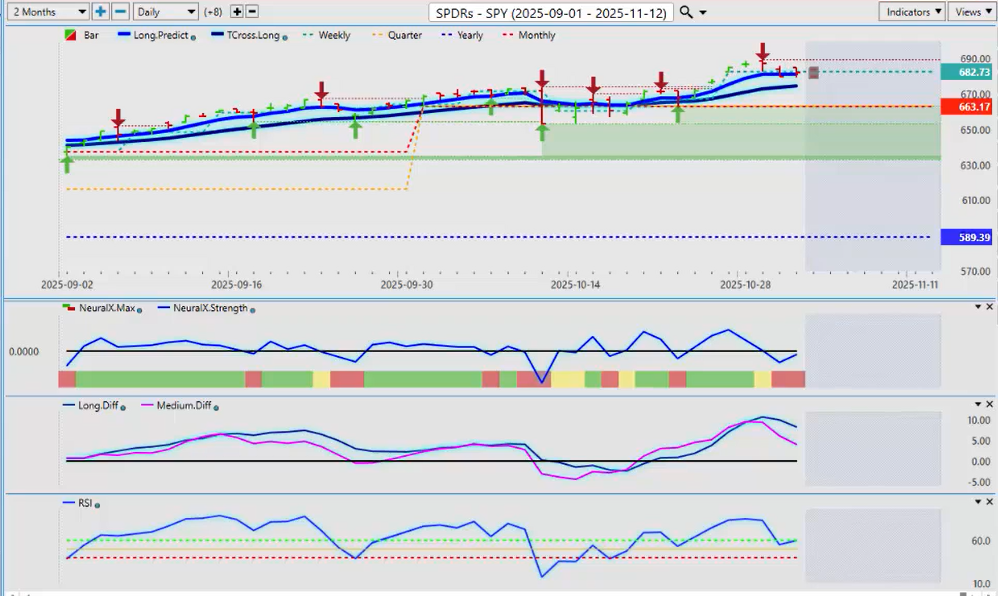
So, if we bring in the equity markets — I’m going to bring them both in at the same time, the US equity markets and the European equity markets — we can see that the S&P 500, we do have an MA diff cross to the downside. So, to explain what this is, it’s telling us right now that we should expect a corrective move back down to our TROS long at 6,7466. But to see an immediate trend reversal, we would have to not only break down below the TROSS long but also the quarterly opening price at 6,6317. That’s a very, very important level for stock traders. And again, it’s corrective in nature. But now the market is going to have to digest — they were absolutely adamant that the Fed was going to be… would cut three times this year, and I don’t believe he’s going to, and now the market is going to question that.
DAX (Global X & Futures)
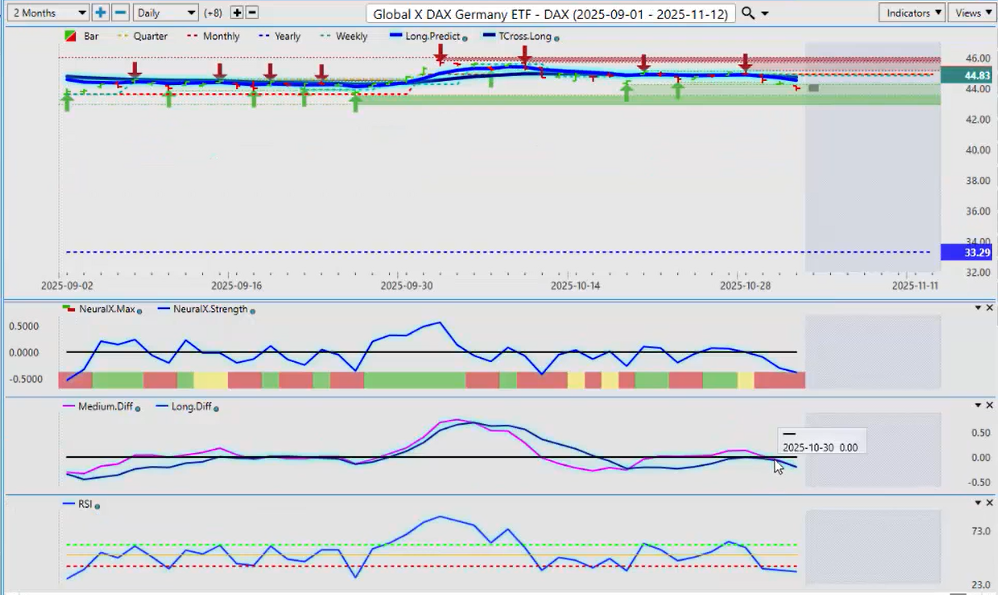
So again, if I look at the European equity markets, that signal is actually showing something even more ominous — that a bigger breakdown potentially is coming on the DAX. The Global X DAX futures right now are below the calendar monthly opening and, more specifically, the quarterly opening and the TROS long. So those levels are right there, and they’re ones to keep a very close eye on here, guys. 44.72 — we need to stay below that level. But the monthly or the quarterly opening 44.91 — in order to go long up here again, guys, we’d have to break above that and stay above that.
Now, again, if we look at the positioning of these indicators, it is suggesting momentum is building here. In this one-time event, I will show the continuous contracts on the DAX. And this is where I find it interesting. Is the signal from the Global X a leading indicator here? Because when I look at this, we’re still above the quarterly opening price at 24,019. The monthly, the same obviously, and then we have our Tcross long 24,277. So, I just wanted to show the difference here. But what I will say is whether it’s the Global X — the DAX Global X — or whether it’s the DAX futures, they’re both bearish, but one remains above the quarterly opening and the other doesn’t. So is it possible the futures are lagging behind this, or it’s a false signal on Global X? But either way, this week…
Volatility Index ($VIX)
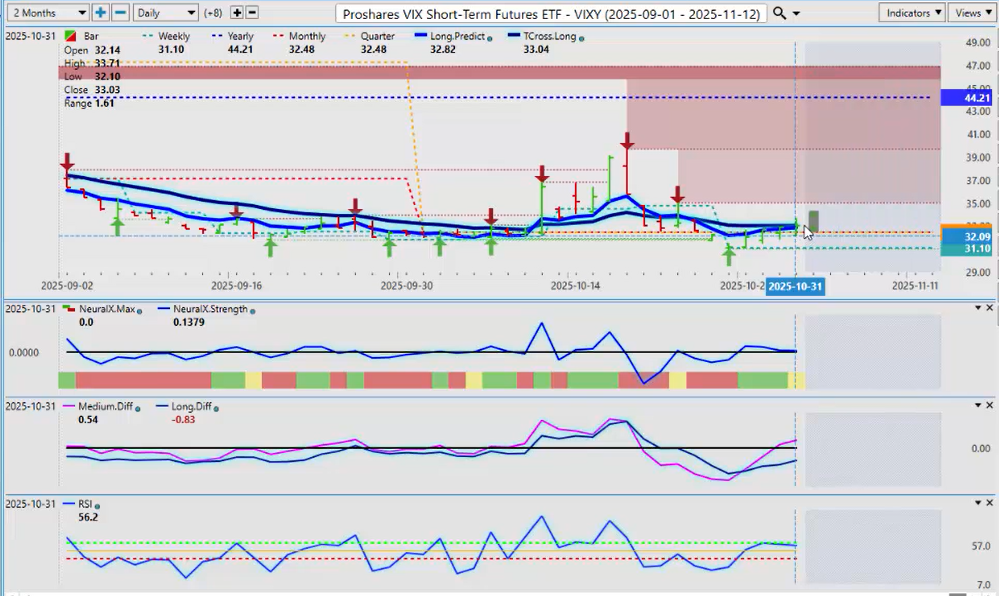
And I apologize, of course, I forgot. I usually, not always, I usually do the VIX, but the VIX is now the one we want to keep an eye on. And as you can see, we have an MA diff cross, and this is a corrective move back to the T cross long. In order for the DAX to move lower, the S&P 500 to move lower, all of these things, then the VIX must break through the TCROSS long at 33.04. Right now, we have penetrated through the quarterly opening price 32.48, and again that MA diff cross. But here’s where it gets interesting again. Again, using the predicted RSI with a 60/40 split, I’m looking for the predicted RSI to remain elevated above 60 to confirm a bullish move, and I actually don’t have that.
So again, if you’re trading the NASDAQ, the DAX, the global indices in general, keep an eye again on that VIX to see if we can hold above 33.04. If we can’t, then the DAX, the S&P, the NASDAQ, the DOW, they’re all likely to reverse higher. But the main thing is, we can look at all of that and then say, okay, well, the VIX has made a corrective move from a newly formed verified support low at 30.96, and now it’s getting all tangled up in that TROS long at 33.04. So 33.04 — just keep an eye on that area here, guys. Okay? And if this ETF can get above that, then that will confirm that your global indices are moving lower.
U.S. OIL ($USO)
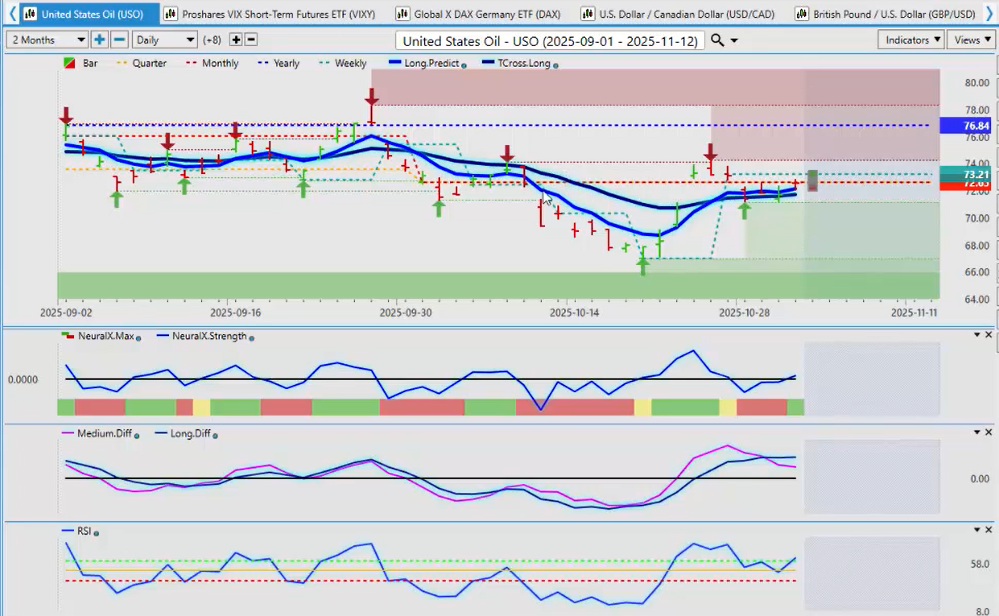
Now, oil prices once again — oil prices remain bearish. We’ve had another retracement back up to the quarterly opening, the monthly opening, but we remain negative on the year 76.84, and our monthly opening and quarterly opening price 72.65. This is the area we need to break above. Now again, when we utilize the medium-term crossover in a different way via the MA diff cross, the medium-term strength is weakening against the long-term. That tells me this is a corrective move higher back up into this area, and we need a sustained break of that 72.65 area if we’re going to buy oil. But again, very low demand at this particular time. I believe that it will struggle, and the nat gas contracts carry a slight edge here, but we’ll review it further as we go into November.
BITCOIN
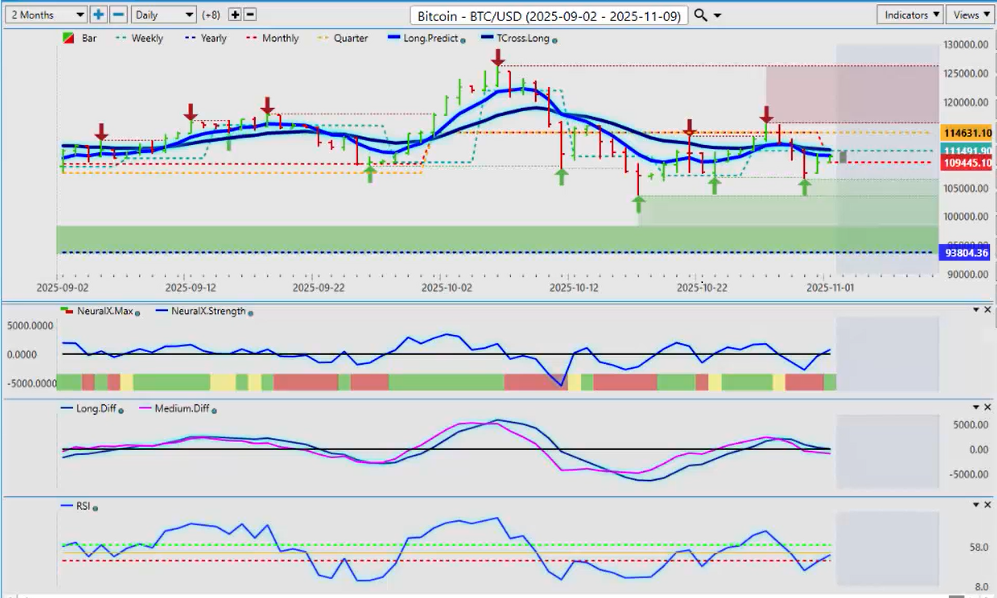
But there is a very mixed signal. If we look at the predicted RSI holding above 50, the neural index is pointing higher, but that MA diff cross right there is one that is warning that that could be a false break higher. And this is simply a corrective move back to the upside. Now, for next week, Bitcoin again — the Fed letting some steam out of Bitcoin, but it’s holding in there right now. The yearly opening price 93,804. The indicators again are very mixed. We’ve got a reverse check mark here, guys. We’ve got a medium-term crossover, the long-term crossover is attempting to go, but as you can see, the neural index strength, and now the neural index being going from red to green, is in agreement, but the slope of that neural index strength is saying, well, wait a minute — there is some underlying strength here.
So again, our T cross long coming in at 115,1980. We need to get above this very quickly by the latter part of the week, or Bitcoin potentially could be in a little bit of trouble here and could be looking at a deeper corrective move. But as long as we can hold above 93,804, then it’s still positive on the year here, guys. Right? But it is going to be at the mercy of these fundamental headlines that we keep getting hit with week after week.
Euro versus U.S. Dollar ($EUR/USD)
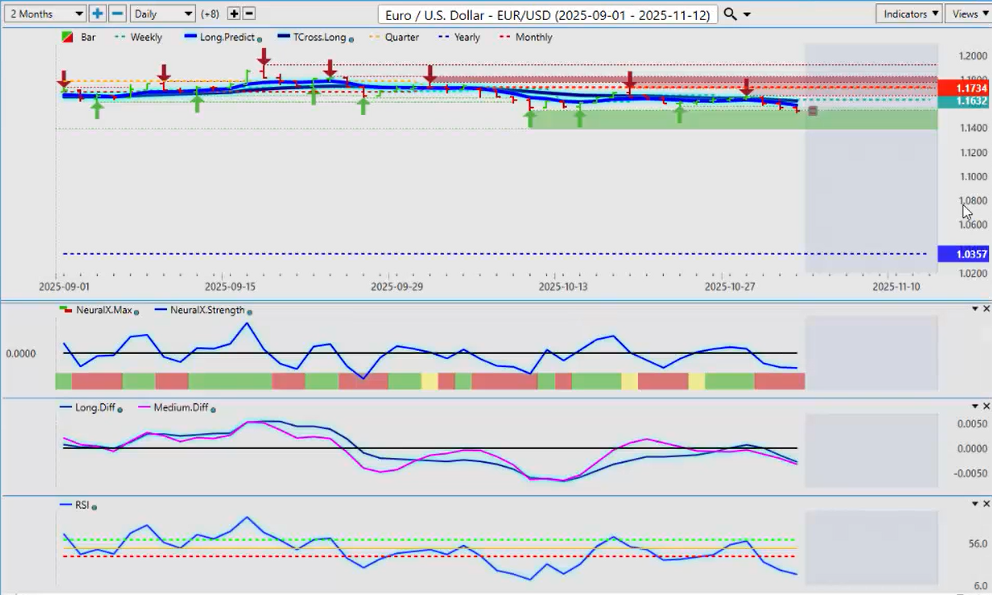
Now, looking at some of our main forex pairs, starting of course with EUR/USD. The EUR/USD pair mirrors an inverse correlation to the USDU, the UUP, or the DXY. So right now, it does look like we’re getting set for a bigger move to the downside in the euro for at least next week. But again, very, very choppy — you’ve got Fed members coming out against Powell. A lot of things are going on, trade wars, but the inflation data out of the Eurozone is a little bit softer. I believe the Europeans want a weaker currency to promote tourism.
But for now, the main thing we need to do is identify our key levels. Starts up at the monthly opening price 1.1734, which of course is the quarterly opening price. We will get a new monthly opening price tomorrow when the market opens. But again, when we look at that TROS long, the area you want to watch closely is 1.1623. We have a number of verified support zones sitting down around this low around 1.1543.
In my respectful opinion, only if we have a sustained break of these verified zones could that lead to a much deeper move to the downside. I don’t think we’re going down to 1.0357 before year end, but I could see us moving into the 1.13 area. So, we’ll watch it closely. But those are your key levels. And again, you’re savvy traders — if you want, you can say, “No, no, I disagree. I think the euro is going higher.” Then I would put buy stops above the Tcross long or above the quarterly opening price at 1.1734 and wait and see how this one plays out.
U.S. Dollar versus Swiss Franc ($USD/CHF)
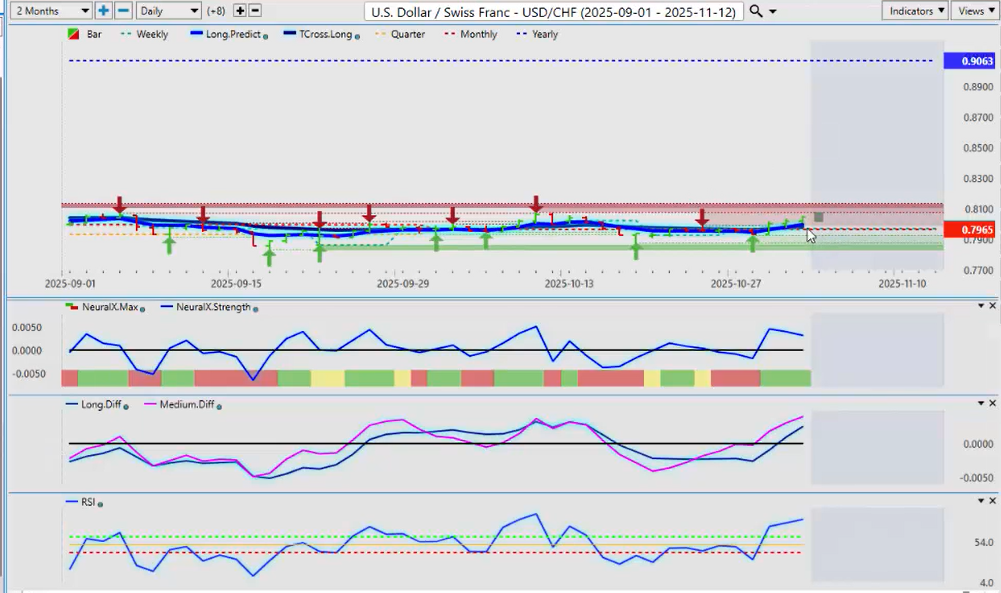
Now, the dollar again showing its strength in the USD/CHF pair — again, another good pair to measure dollar strength. Excuse me, there it is, we’ll just let this update here. So again, another intermarket correlation that’s suggesting there is some dollar strength. But I will point out, guys, I’ve got this VP software set to two months, and this has been running sideways for at least two months, maybe even longer. Let’s go to three months — see if we see something different. Not a lot different.
Some new lows. So we’ve got a low down at 0.7830, and our high point is, I would argue, probably over here at or about 0.8171. So again, the next big move in the dollar will come when this long-term channel breaks. But for now, it does appear that we are moving back towards the most recent highs up around this 0.8132 area. And then next weekend, I can reassess this and say, okay, we’ve completed our retracement inside the channel, and now ultimately we’re getting ready to go lower. But for next week anyway, the signals here from VP remain bullish.
British Pound versus U.S. Dollar ($GBP/USD)
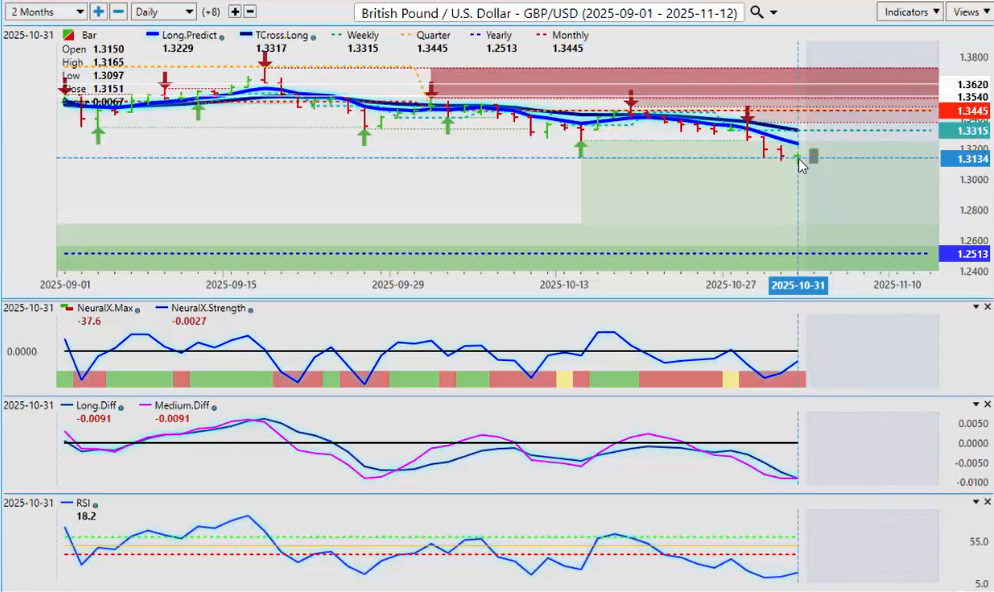
GBP/USD again — G7 pairs all have the US dollar in them. I believe Great Britain has a better chance of recovery against the US dollar than the euro because the pound’s been getting beat up for a few weeks here now. So, it could be that they’re going to shift to selling the euro and maybe they’ll start buying a little bit of Great Britain this week.
And we’re looking for that in the cross pairs. The reason I say that is not just opinion — I have an MA diff cross that is forming. The pink line over the blue line is a zero-lag tool. When that pink line crosses that blue line to the upside, it’s a warning sign of a retracement or corrective move back to the upside. So, I’ll continue to monitor this. But again, if we look at the euro, I do not have that same signal here.
So, with respect, guys, I think that points us to more than just one trade. I would watch EUR/GBP very closely next week because that’s a side trade. If the euro drops — well, put it this way — there is really no such thing as EUR/GBP. It’s made up of EUR/USD and GBP/USD. And we’ve seen this recently where one of the currency pairs is stronger. So next week, it’s suggesting here that Great Britain is going to be the stronger currency versus the euro.
We’ll watch this one closely, but I believe there is something there. This is how we can use the Vantage Point predicted highs and predicted lows. The predicted low for Monday is 1.3106 — keep an eye on that area, guys. We may have a Monday-Tuesday reversal, and we could see this pair, again, move correctively back to our T cross long at 1.3317.
U.S. Dollar versus Japanese Yen ($USD/JPY)
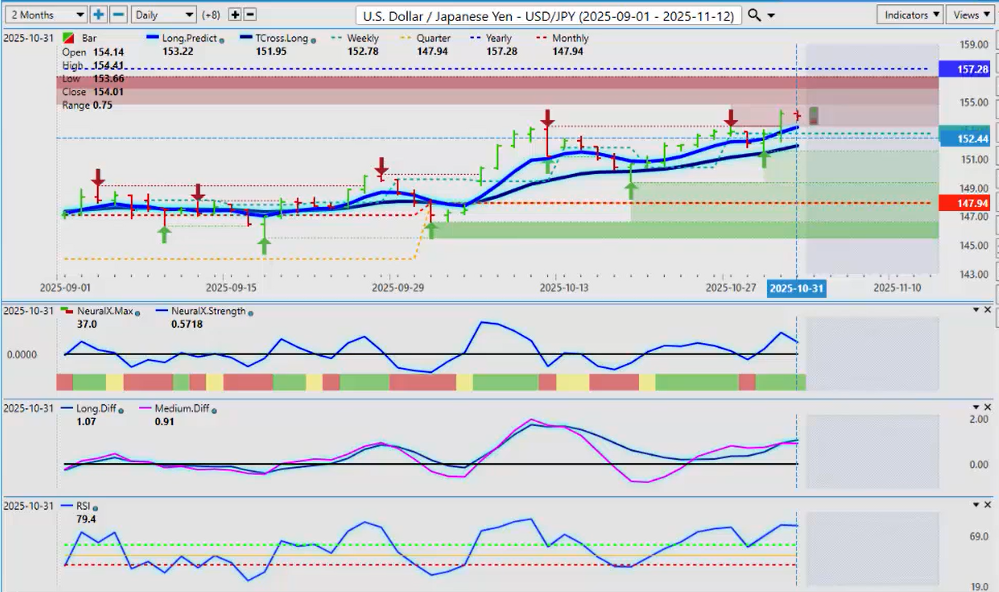
Now, carry trade appears to be back on here with the Fed once again. The Fed is not backing down from Trump or anybody else. And probably the one time in history where I have to kind of agree with Powell — that if we’re doing this based on economic data, then the economic data doesn’t really support that rate cut going forward.
The economic data out of the US — the tariffs were supposed to decimate the US economy. The exact opposite is happening. So, we’ve got to see how this one plays out. But I believe there is a bit of a trade deal between the US and China, at least for one year. So that again would promote the weakening of the yen and the carry trade as long as the Fed is not cutting.
The only thing I can advise going into next week’s trading — I do have an MA diff cross right there to the downside. But as long as we’re above the TROS long at 151.95, this would be a corrective move lower. So here’s how I see this possibly playing out in Monday’s trade: we go down hard on Monday, and then we go up the rest of the week. The USD/JPY has become notorious, like USD/CAD, for whatever it does on Monday, it does the exact opposite on Tuesday. So watch for that. But I believe the carry trade, for now, they’re not going to be in a quick rush to exit dollar longs to any extent.
U.S. Dollar versus Canadian Dollar ($USD/CAD)
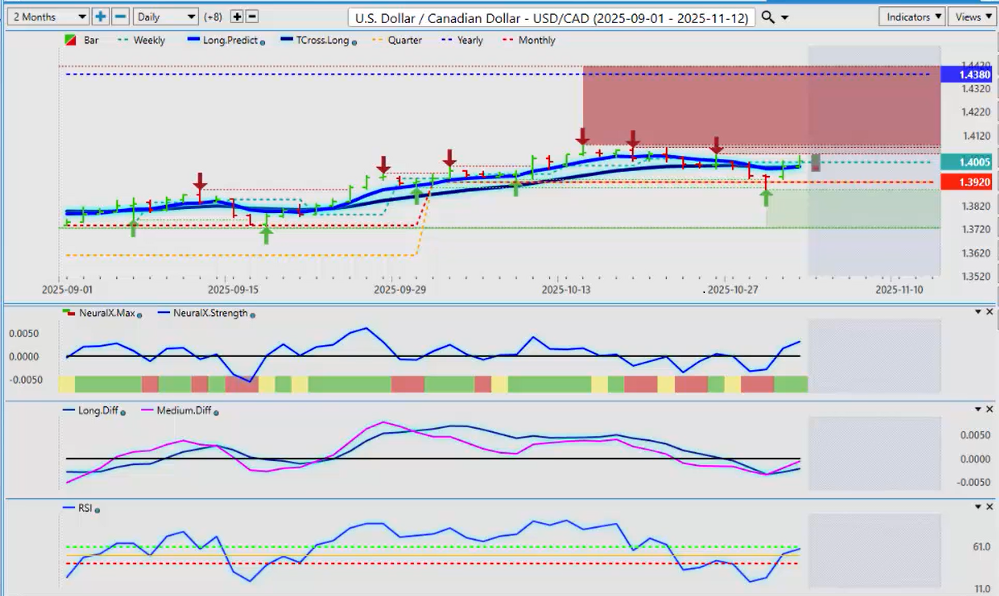
Now, the USD/CAD pair — we have another rate cut out of the Bank of Canada. But the rate cut is not what we want to focus on here, guys. What we focus on is the position from Tiff Mlin, the head of the Bank of Canada, going forward. How is the Canadian economy doing? That was the most dire forecast I have heard from a Canadian central banker in a very long time, and I agree with everything he said.
So we might want to take note of this. This is twice now that I’ve agreed with the US Federal Reserve’s position, and I’m agreeing with the Bank of Canada. Or I could say it from a more comical standpoint and say the Bank of Canada is finally agreeing with me. Either way, guys, it’s not good. And because I’m domiciled in Canada, I’ll give everybody fair warning — 50% chance another federal election could be triggered next week unless the Liberals can pass this budget.
So there are so many negatives against the Canadian dollar. I would strongly look at selling the Canadian dollar anywhere you can — NZD/CAD, AUD/CAD, EUR/CAD, GBP/CAD, USD/CAD. But here’s what I’ve seen from last week: the market continued to sell USD/CAD until that press conference, and they immediately dumped when they heard what Tiff Mlin said. You can see the pair reversing.
So next week, buying on a dip — all the signals in VP are looking quite good. The neural index, neural index strength, I have an MA diff cross, and the break of the 60 level on the predicted RSI is likely to trigger a breakout. But the only way I would reverse my position is if we get a sustained break of 1.3920 — to be crystal clear here, guys. Right now, there isn’t any fundamental or technical reason for me to buy the Canadian dollar. The “elbows up” crowd can have what they want, but when it comes down to trading, guys, we’ve got to look at both intermarket analysis, seasonals, and our strong intermarket technical tools — and they are all in agreement that the Canadian dollar is not something I want to buy at the current time.
My position going forward could change, but I need the fundamentals. I need a trade deal between the US and Canada. I need a hawkish Bank of Canada. I need strong unemployment numbers coming out of Canada. I don’t have any of these things. The bulk of the jobs coming out of Canada — they’re coming out of Alberta. I think last month’s 60,000-job surprise — well, 43,000 of those came from one province. So again, it’ll be very interesting next week, but longs clearly are favored here.
Australian Dollar versus U.S. Dollar ($AUD/USD)
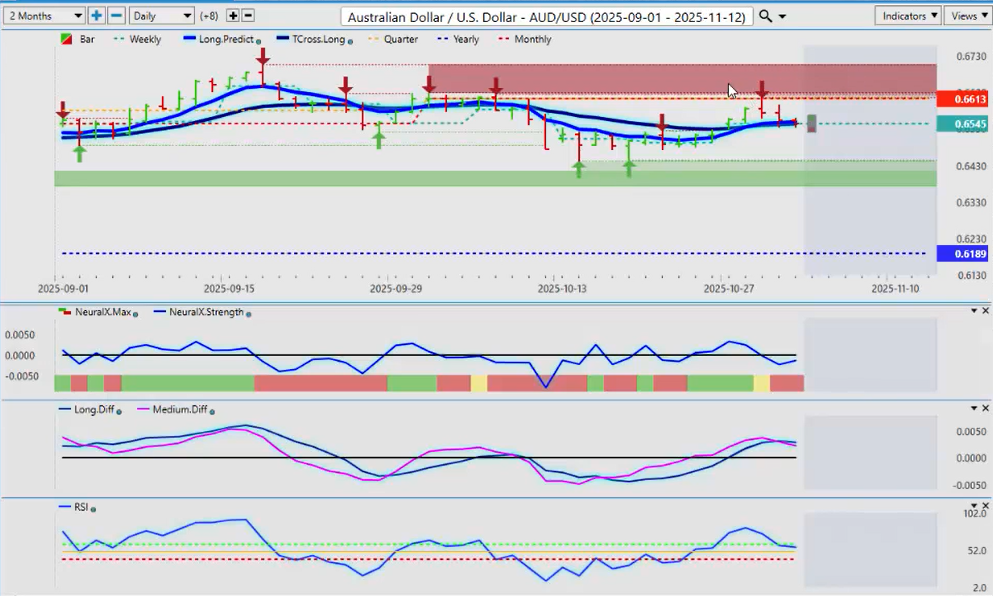
Now, the AUD/USD and the NZD/USD — they’re taking a bit of a hit with that dollar strength. They started off the week very strong, and you can see on Wednesday, that’s when things started to go south. The media got the Fed’s position wrong. Or, in the alternative, they were simply spreading false information — I’m not sure which. Disinformation, I should say. But you can see we have stopped right on the Tross long, 0.6543.
So that is the line in the sand. It does look like the pair is turning bearish again, but we remain positive on the year, 0.6189. So again, when they say how bearish the Aussie is, guys, this would be your response and say, “Well, I beg to differ. The Aussie opened up the calendar year, and it’s currently up 5.67% against the dollar.”
And I believe the AUD/USD and the NZD/USD can benefit from a trade deal between China and the US. But don’t let anybody tell you differently, guys. That’s the current performance, and that’s a pretty darn good performance for a currency in a calendar year, being up 5.6% against the US dollar.
But I will concede, we do have an MA diff cross right here — that’s very concerning because of where the market resides, right on that TROSS long. So, I believe we’ll probably come a little bit lower next week into 0.6444, but I don’t believe there’s a long-term play to the downside on the AUD/USD or the NZD/USD.
New Zealand Dollar versus U.S. Dollar ($NZD/USD)
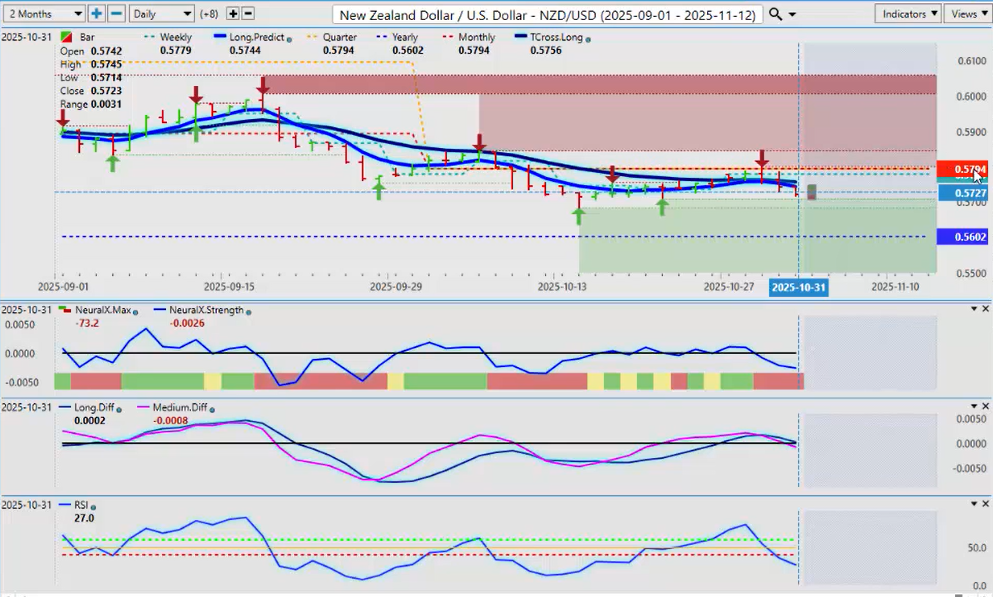
So, when we look at the NZD/USD — have a quick peek at it too — very similar here, guys. We’ve got our quarterly opening price 0.5794 and our TROS long coming in at 0.5756. Those are your resistance points. Personally, I will put a buy stop order sitting waiting above 0.5794. When — not if, but when — the market turns around, I will have a buy order ready to go.
But again, that’s a hypothetical trade. No recommendation is being made here to buy or sell anything, but simply to point out critical levels in the market where you can stand away from this volatility and simply wait for the market to rip back higher. But I will further concede that we do have an MA diff cross. The Kiwi is already below the TORS long, and momentum to the downside is building.
So, the AUD/USD remains the stronger of the two. Between the Aussie and the Kiwi, the Aussie still remains the stronger currency. So, we will have another choppy, volatile week, guys. But with that, there will always be opportunity if you know your levels.


